www.hydrol-earth-syst-sci.net/16/2095/2012/ doi:10.5194/hess-16-2095-2012
© Author(s) 2012. CC Attribution 3.0 License.
Earth System
Sciences
Consistency between hydrological model, large aperture
scintillometer and remote sensing based evapotranspiration
estimates for a heterogeneous catchment
B. Samain1, G. W. H. Simons2, M. P. Voogt2, W. Defloor3, N.-J. Bink4, and V. R. N. Pauwels1
1Laboratory of Hydrology and Water Management, Ghent University, Ghent, Belgium 2WaterWatch, Wageningen, The Netherlands
3Flemish Environmental Agency, Department Operational Water Management, Brussels, Belgium 4Wittich and Visser, Rijswijk, The Netherlands
Correspondence to:B. Samain ([email protected])
Received: 17 November 2011 – Published in Hydrol. Earth Syst. Sci. Discuss.: 9 December 2011 Revised: 18 June 2012 – Accepted: 19 June 2012 – Published: 13 July 2012
Abstract.The catchment averaged actual evapotranspiration rate is a hydrologic model variable that is difficult to quan-tify. Evapotranspiration rates – up till present – cannot be continuously observed at the catchment scale.
The objective of this paper is to estimate the evapotran-spiration rates (or its energy equivalent, the latent heat fluxes LE) for a heterogeneous catchment of 102.3 km2in Belgium using three fundamentally different algorithms.
One possible manner to observe this variable could be the continuous measurement of sensible heat fluxes (H) across large distances (in the order of kilometers) using a large aper-ture scintillometer (LAS), and converting these observations into evapotranspiration rates. Latent heat fluxes are obtained through the energy balance equation using a series of sen-sible heat fluxes measured with a LAS over a distance of 9.5 km in the catchment, and point measurements of net ra-diation (Rn) and ground heat flux (G) upscaled to catchment average through the use of TOPLATS, a physically based land surface model.
The resulting LE-values are then compared to results from the remote sensing based surface energy balance algorithm ETLook and the land surface model. Firstly, the performance of ETLook for the energy balance terms has been assessed at the point scale and at the catchment scale. Secondly, consis-tency between daily evapotranspiration rates from ETLook, TOPLATS and LAS is shown.
1 Introduction
Evapotranspiration (ET) estimates are needed for a wide range of problems in hydrology, agronomy, forestry and land management, and water resources planning, such as water balance computation, river flow forecasting, ecosystem mod-eling, etc. Due to complex interactions amongst the compo-nents of the land-plant-atmosphere system, evapotranspira-tion is perhaps the most difficult of all the components of the hydrologic cycle to assess (Xu and Singh, 2005).
Most methods for the estimation of evapotranspiration rates are point-scale approaches. Estimates at large spatial scales can be obtained using remote sensing and spatially dis-tributed hydrological models. For large scale assessment of ET, extended networks of (field) sensors have a large poten-tial for ET estimation. However, typically, regional to con-tinental scale information on ET is obtained with the ap-plication of Earth observation techniques, although thermal and optical techniques require clear sky imagery (Verstraeten et al., 2008), which limits these techniques for the continuous observation of ET.
for a variety of reasons (expensive technology, complexity, absorption effects, and required licenses), these are not yet commercially available (Meijninger et al., 2006). At present, optical scintillometers are more widely used, but they can only estimate the sensible heat flux across a large distance.
A number of studies have already focused on estimation of evapotranspiration rates (or LE) from sensible heat flux mea-surements acquired from LAS-data. In all of these studies, the latent heat flux is always estimated as the rest-term of the energy balance (LE =Rn−G−H). So, the estimation of a representative value for the available energy (AE =Rn−G) is always crucial for the accuracy of the retrieved values of LE. For short scintillometer paths over a homogeneous sur-face, Pauwels and Samson (2006) and Savage (2009) showed that the latent heat flux as rest-term of the energy balance whereH is measured by a scintillometer andRnandGare measured at a point location along the scintillometer path, re-sulted in a good agreement between the LAS-derived latent heat fluxes and LE as measured with Bowen Ratio Energy Balance (BREB) and Eddy Covariance (EC) – stations along the path. The same method was used for larger and more het-ereogeneous areas by Ezzahar and Chehbouni (2009) and Bai et al. (2009) who used theH from a scintillometer measur-ing over a distance of about 1 km and 2.5 km respectively, combined with point measurements ofRnandGwithin the scintillometer path to calculate the area averaged sensible heat flux. Hemakumara et al. (2003) estimated the latent heat flux on a daily basis (24 h) from LAS-measured H-fluxes over an almost 2 km path length with mixed land cover and point-measurements ofRn. Because LE was estimated on a daily basis, the soil heat storage was assumed to be minimal, and LE24h has been calculated from Rn,24h andH24h with promising results in a comparison with results from a remote sensing based surface energy balance algorithm. Guyot et al. (2009) calculated the spatially averaged latent heat flux for a small (12 km2) heterogeneous catchment in West Africa (Northern Benin) as the residual term of the energy balance equation whereH was measured with a scintillometer over the catchment, using point measurements ofRnwhich were shown to be representative for the heterogeneous catchment in wet conditions, and aggregated values ofGwhich were obtained as a simple average of localG-estimations based on soil temperature measurements at three different locations within the catchment. Ezzahar et al. (2009) derived the area-averaged latent heat flux as the residual term of the energy balance equation through the combination of the LAS mea-surements over a 3.2 km slanted, heterogeneous path, and an aggregation scheme to derive area-average available energy based on the local measurements of the surface temperature, the albedo and the incoming solar radiation, all measured over the three different vegetation types. From all of these studies, it was concluded that a LAS is an adapted device to estimate the actual evapotranspiration through an energy bal-ance approach at the catchment scale if the available energy
(Rn−G) is carefully estimated, so it can be assumed repre-sentative for the considered area.
Typically, evaluation of scintillometer measured H and derived LE fluxes is performed by comparison with the measurements of an EC (Eddy Covariance) or BREB (Bowen Ratio Energy Balance) station. For homogeneous land cover along the scintillometer path (e.g. Pauwels and Samson, 2006; Savage, 2009), these can be assumed to be represen-tative for the entire path. For more heterogeneous conditions (e.g. Ezzahar et al., 2009; Guyot et al., 2009; Bai et al., 2009), a weighted average from EC or BREB observations on different land cover types under the path is made, or a footprint analysis of the scintillometer signal is performed to determine which EC or BREB observations need to be as-signed which weight in the aggregation scheme. However, sensible and latent heat fluxes do not only depend on the land cover type, but also on the soil moisture conditions, which can show a high spatial variability. So, in strongly het-ereogeneous areas at large spatial scales, the evaluation ap-proach based on one or more point measurements becomes infeasible (Samain et al., 2011). Alternative evaluation pro-cedures for LAS-measurements over heterogeneous areas are described by Kleissl et al. (2008, 2009b), who intercompared different scintillometers over the same area. Models can also be used, as for example Ezzahar and Chehbouni (2009), who used a two-source energy-balance model, and Samain et al. (2011) who used a spatially distributed physically based land surface model. Another alternative for the evaluation of a LAS measurement is through the use of remote sensing data as performed by Hemakumara et al. (2003) and Kleissl et al. (2009a). Hemakumara et al. (2003) used the remote sens-ing based surface energy balance algorithm for land (SE-BAL, Bastiaanssen et al., 1998) and NOAA satellite images to evaluate the LAS-derived ET-values and found that the av-erage deviation of ET estimates between SEBAL and LAS for five 10-day periods was 17 % and that this deviation fell to 1 % when monthly estimates were considered. Kleissl et al. (2009a) have shown that SEBAL results generally agree with the 10-min-averaged surface LAS measurements at the over-pass time at six sites and for four satellite overover-passes in 2006. Although both studies indicate that the use of remote sensing data is a good evaluation tool for flux measurements over a large and heterogeneous area (as can be done with a scintil-lometer), the used remote sensing techniques are restricted by cloud coverage (Hemakumara et al., 2003) and only the instanteneous moments of satellite overpass can be evaluated (Kleissl et al., 2009a).
algorithms have been evaluated to produce a continuous se-ries (including stable conditions) ofH from the LAS data (Samain et al., 2012).
The main goal of this study is to explore the consistency for evapotranspiration estimates over a large, heterogeneous area between three fundamentally different techniques: the based values of actual evapotranspiration using
LAS-H and the energy balance approach, the land surface model TOPLATS, and the remote sensing algorithm ETLook that is developed to calculate ET for lower temporal resolutions (daily time step).
A first objective of this paper is to make continuous series of hourly actual evapotranspiration rates for the Bellebeek catchment based on LAS measurements and the energy bal-ance approach. This continuous catchment averaged actual ET-series can then, for example, be used as model forcing for rainfall-runoff models or for the validation of land sur-face and weather prediction models. Therefore, the contin-uous series ofH based on the LAS-data is used in combi-nation with areally representative values of available energy (<AE>=< Rn−G >). The estimates of<AE>are based on local measurements ofRnandGwhich have been com-pared and upscaled for the heterogeneous catchment through the use of the calibrated spatially distributed physically based land surface model as described in and applied by Samain et al. (2011). This results in an operationally applicable tech-nique for the estimation of catchment averaged actual evap-otranspiration rates through the combination of only three measurements (Hfrom LAS, and locally measured, but up-scaled values for<AE>=< Rn−G >).
The second objective is to evaluate the consistency of the LAS-derived series of evapotranspiration rates on a daily ba-sis for a period of six months through comparison with the results of ETLook, an algorithm based on remote sensing data to compute continuous daily evapotranspiration rates for large areas. Before checking the consistency between LAS-and ETLook-results, the performance of ETLook is evalu-ated by comparing ETLook-results to point-measurements and to catchment averaged fluxes modeled with the land sur-face model.
2 Site and data description
2.1 Site description
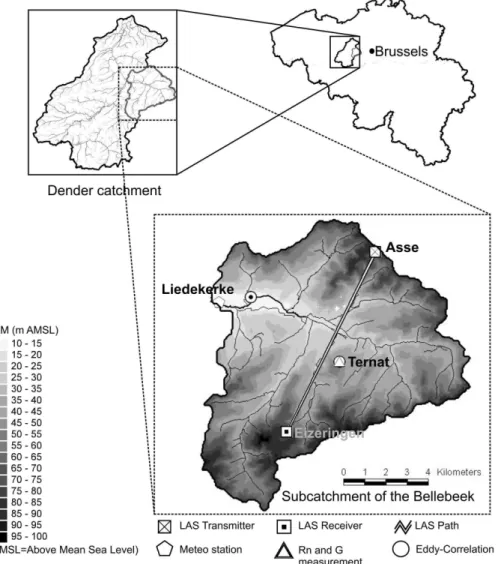
The study was performed in the Dender catchment in Belgium. Figure 1 shows the location of the catchment together with a Digital Elevation Model (DEM) of the area. A LAS was installed in the sub-catchment of the Bellebeek (102.3 km2). The elevation in the sub-catchment ranges between 10 and 110 m. Soil texture is predominantly loam (74 %), and the land use is predominantly agriculture (63.6 %) and pasture (22.9 %). A total 8.6 % of the surface
consists of urban land cover and the remaining area consists of forest (4.8 %) and open water (0.1 %).
2.2 Surface data sets
Figure 1 shows the location of the meteorological station used in this study. Continuous measurements of wind speed and wind direction at 10 m height, as well as precipitation rates, air pressure, and air and dew point temperature at a height of 2 m were available at a 10-min interval from the me-teorological station of Liedekerke, situated near the outlet of the catchment. Further, net radiation data from a NR-Lite net radiometer (Kipp and Zonen, Delft, The Netherlands) at 2 m height and ground heat flux observations from two HFP01 soil heat flux sensors (Hukseflux, Delft, The Netherlands) at 5 cm depth were also available at this site.
From 15 April 2009, an Eddy Covariance (EC) installa-tion was installed at 2 m above the surface of a grassland in Ternat approximately in the middle of the scintillometer-path. The EC station consists of a 3-D sonic anemometer (CSAT3, Campbell Scientific Ltd.), and a Krypton hygrom-eter (KH2O, Campbell Scientific Ltd.). Raw data were sam-pled at a rate of 10 Hz. The half-hourly fluxes were calculated off-line using the TK2 software package (Mauder and Fo-ken, 2004; Mauder et al., 2008). With the TK2-package, the fluxes were calculated after despiking, cross wind correction, planar fit correction, correction of oxygen cross sensitivity for the Krypton hygrometer, correction of spectral loss, and correction for density fluctuations (WPL-correction, Webb et al., 1980). In combination with this EC-station, net radi-ation (NR-lite net radiometer) at 2 m above the surface and soil heat flux (two HFP01SC soil heat flux sensors) just be-low the surface were registered at a 10 min interval and were averaged to one hour intervals.
2.3 Scintillometer data
2.3.1 Introduction
Fig. 1.The location of the study site in Belgium, a DEM of the study area and the location of the meteorologic stations and the LAS in the study area.
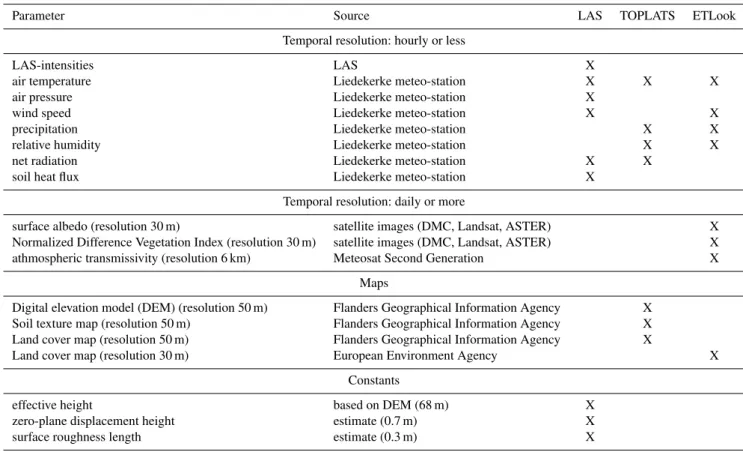
From the 1-min data of observed intensities, 1-min H -values are derived using the calculation procedure explained in Samain et al. (2011). From this procedure, obtaining the sensible heat flux from a scintillometer measurement over a heterogeneous area requires the measurement of a number of additional parameters (Table 1): air temperature, air pressure, Bowen ratio, zero-plane displacement height, and friction ve-locity representative for the area under the LAS. As shown in Samain et al. (2011), representative sensible heat fluxes for the heterogeneous catchment of the Bellebeek can be calcu-lated from the LAS data at 68 m height in combination with the air temperature and air pressure from the meteorologi-cal station at Liedekerke, the zero-plane displacement height estimated as 0.7 m and the friction velocity calculated from the measured wind speed at the Liedekerke meteorological station. The 1-min values ofH are then averaged per hour. Samain et al. (2012) further describe the construction of an almost continuous series of hourly sensible heat fluxes using
an operational algorithm based on the diurnal cycle of the refractive index structure parameterCN2 and by ignoring the humidity correction based on the Bowen ratio. This ignoring of the humidity correction has been shown to result in an increase of the completeness of the resultingH-series with only a marginal error inH. In this paper, the energy balance equation will be applied to calculate latent heat fluxes from theseH-fluxes.
2.3.2 Available time series from LAS
Table 1.Input data for the three different techniques to calculate catchment averaged latent heat flux.
Parameter Source LAS TOPLATS ETLook
Temporal resolution: hourly or less
LAS-intensities LAS X
air temperature Liedekerke meteo-station X X X
air pressure Liedekerke meteo-station X
wind speed Liedekerke meteo-station X X
precipitation Liedekerke meteo-station X X
relative humidity Liedekerke meteo-station X X
net radiation Liedekerke meteo-station X X
soil heat flux Liedekerke meteo-station X
Temporal resolution: daily or more
surface albedo (resolution 30 m) satellite images (DMC, Landsat, ASTER) X
Normalized Difference Vegetation Index (resolution 30 m) satellite images (DMC, Landsat, ASTER) X
athmospheric transmissivity (resolution 6 km) Meteosat Second Generation X
Maps
Digital elevation model (DEM) (resolution 50 m) Flanders Geographical Information Agency X
Soil texture map (resolution 50 m) Flanders Geographical Information Agency X
Land cover map (resolution 50 m) Flanders Geographical Information Agency X
Land cover map (resolution 30 m) European Environment Agency X
Constants
effective height based on DEM (68 m) X
zero-plane displacement height estimate (0.7 m) X
surface roughness length estimate (0.3 m) X
20 September 2009. For this six months period (4392 hourly time steps), no LAS data are available for 755 time steps (or 17.2 % of the time steps). Using the algorithm for constructing a continuous time series of H from LAS, as explained by Samain et al. (2012), from the remaining 3637 time steps, a reliable estimate ofH could be obtained for 3100 time steps, which is an availability of approximately 85 % of the available LAS-time steps. The loss of 15 % of the data is because no reliable H could be calculated because of precipitation (7.2 %) or because no reliable hourly CN2
was obtained from LAS-data (1.3 %) or the algorithm could not be applied (6.3 %), e.g. because no clearCN2-minimum could be found around the transition between different sta-bility conditions.
3 <LE>from LAS
A LAS provides the opportunity to provide surface fluxes of sensible heat across a distance of several kilometers and over a heterogeneous landscape. As shown by different au-thors, it is feasible to use the LAS for operationally estimat-ing area-averaged<LE>as the residual term of the energy balance equation, providing estimates of area-average avail-able energy (<AE>=< Rn−G >) are available. Samain et al. (2011) have shown that the LAS measurements over a
-200 -100 0 100 200 300 400 500 600 700 -200
-100 0 100 200 300 400 500 600 700
Mean X = 46 Mean Y = 34.9 Slope = 0.859 Intercept = -4.63 R = 0.961 RMSE = 36.8 N = 26723
AE
Liedekerke(W m
-2)
<AE>
T
OPLA
TS
(W
m
-2
)
(a)
-200 -100 0 100 200 300 400 500 600 700
-200 -100 0 100 200 300 400 500 600 700
Mean X = 34.9 Mean Y = 34.9 Slope = 1 Intercept = 7.26e-015 R = 0.975 RMSE = 24.6 N = 26723
<AE>
Liedekerke- upscaled (W m
-2)
<AE>
T
OPLA
TS
(W
m
-2
)
(b)
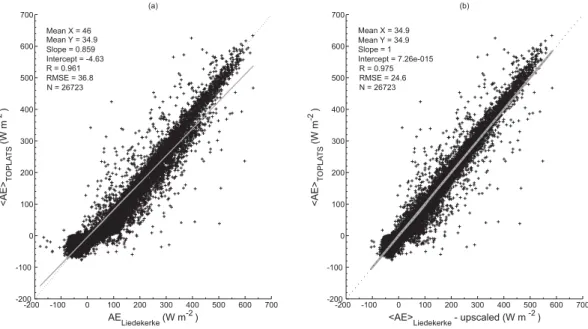
Fig. 2.Comparison between AELiedekerkeand<AE>TOPLATS(a)and comparison between upscaled values of AELiedekerkefor the
catch-ment according to the monthly statistics as given in Table 2(b).
3.1 The hydrologic model (TOPLATS)
The land-surface model used in this study is the TOPMODEL-Based Land-Atmosphere Transfer Scheme (TOPLATS) (Famiglietti and Wood, 1994), which is more extensively described in Samain et al. (2011). It is a physi-cally based, spatially distributed land surface model that for every pixel within the catchment solves the surface energy balance equation through an iteration for the soil surface temperature.
As listed in Table 1, the TOPLATS model for the Belle-beek catchment uses a digital elevation model, soil texture and land cover maps and continuous meteorological obser-vations which are considered to be representative for and uniformly distributed over the study area. In Samain et al. (2011), the land surface model has been calibrated and vali-dated using discharge and energy balance terms at an hourly time step. TOPLATS has been calibrated for a period preced-ing the study period (from 1 August 2006 through 14 Au-gust 2007) and validated from 15 AuAu-gust 2007 through 28 August 2009 (Samain et al., 2011). The considered period of this study is thus a part of the validation period. A good correspondence between observed and modeled discharge showed the accuracy of the model at the catchment scale. The accuracy of the model at the point scale was illustrated by the ability to simulate net radiation and soil heat flux at the pixel where BREB (Bowen Ratio Energy Balance)-stations were located, and latent and sensible heat flux from the source ar-eas around the BREB-stations (Samain et al., 2011).
The model has further been used to evaluate the LAS mea-surement of the sensible heat flux over the LAS path withH
as modeled within the footprint and within the catchment.
For unstable conditions, it has been concluded that the LAS measurements of the sensible heat flux are representative for the catchment (Samain et al., 2011).
3.2 From point-measured AE to catchment averaged
<AE>
The objective of this study is to obtain <LE> in an op-erational way. Using the energy balance approach, this re-quires operational estimates of catchment-representative val-ues of the available energy <AE>, which are acquired from point-measurements and model results. At the meteo-rological station of Liedekerke, net radiation (Rn,Liedekerke) and soil heat flux (GLiedekerke) are continuously measured. From these data, point-values of AE can be calculated as AELiedekerke=Rn,Liedekerke−GLiedekerke. Because area-average observations of net radiation and soil heat flux are not available, the catchment averaged available energy cal-culated with the TOPLATS-model for every pixel within the catchment (<AE>TOPLATS=Rn,TOPLATS−GTOPLATS) is used to check the local measurements of AELiedekerke for the catchment. For the period from 1 January 2008 through 8 April 2011, the hourly values of<AE>TOPLATSare com-pared to the ground-based measurements of AELiedekerke in Fig. 2a. The mean monthly values of AELiedekerke and
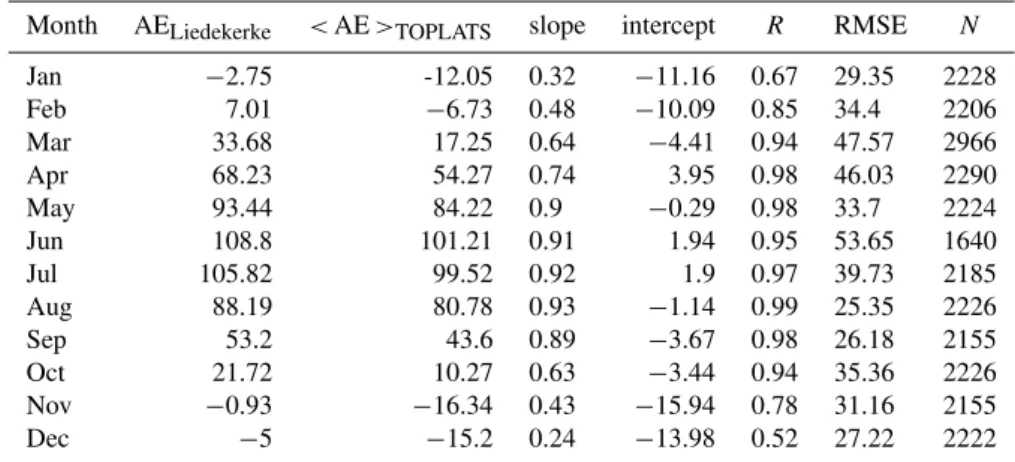
Table 2.Statistics of the comparison between AELiedekerkeand<AE>TOPLATSper month. Units are in W m−2.
Month AELiedekerke <AE>TOPLATS slope intercept R RMSE N
Jan −2.75 -12.05 0.32 −11.16 0.67 29.35 2228
Feb 7.01 −6.73 0.48 −10.09 0.85 34.4 2206
Mar 33.68 17.25 0.64 −4.41 0.94 47.57 2966
Apr 68.23 54.27 0.74 3.95 0.98 46.03 2290
May 93.44 84.22 0.9 −0.29 0.98 33.7 2224
Jun 108.8 101.21 0.91 1.94 0.95 53.65 1640
Jul 105.82 99.52 0.92 1.9 0.97 39.73 2185
Aug 88.19 80.78 0.93 −1.14 0.99 25.35 2226
Sep 53.2 43.6 0.89 −3.67 0.98 26.18 2155
Oct 21.72 10.27 0.63 −3.44 0.94 35.36 2226
Nov −0.93 −16.34 0.43 −15.94 0.78 31.16 2155
Dec −5 −15.2 0.24 −13.98 0.52 27.22 2222
be applied for the conversion of AELiedekerke to <AE> -values. Nevertheless, from regressions taken per month (Ta-ble 2), it seems that there is an annual pattern in the re-gression slopes. This can be explained by the fact that the point-measurements are taken on a grass field where veg-etation does not change much throughout the year, while the model results are an average for the entire catchment where the vegetation is changing throughout the year as, e.g. crops are sown, grow and harvested again, resulting in a different radiation budget. In order to take into account this dynamic character of the catchment, the parameters of the monthly regressions (Table 2) are used to convert the point measurements of AELiedekerke into <AE>TOPLATS-values, which can be considered as catchment averaged values of
<AE>. The converted values of<AE>from the point-measured AELiedekerkevalues are shown in Fig. 2b where the slope of 1 and theRof 0.975 illustrate that the adjusted val-ues of<AELiedekerke,upscaled>are now more representative for the catchment.
3.3 <LE>from<AE>and< H >
Because the point-measurements of AELiedekerkecan be con-sidered as being operationally available because they are re-trieved from a permanent meteorological station, the above regression approach would allow to continuously and op-erationally calculate catchment averaged values of<AE>, which can be used for continuously calculating the catchment averaged latent heat flux<LE>using the energy balance equation and values of< H > as retrieved from the LAS. For the hourly time steps where LAS-data are available and
< H >could be calculated according to the principles ex-plained by Samain et al. (2012) in order to become a continu-ous series of< H >(stable and unstable conditions),<LE>
is calculated as<AE>−< H >. These values of<LE>
can then be compared to results of the remote sensing model ETLook.
4 <LE>from ETLook
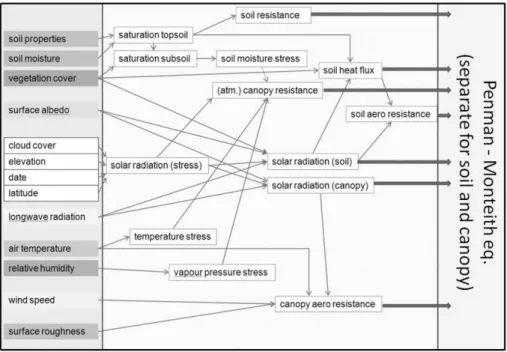
As explained earlier, it is infeasible to evaluate area-averaged values of<LE>for the heterogeneous Bellebeek catchment with a weighted average of ground-based LE-measurements. Therefore, the remote sensing-based algorithm ETLook is used to intercompare<LE>for a limited time period. ET-Look is an algorithm to compute evapotranspiration based on remote sensing data (Pelgrum et al., 2010). ETLook has been developed in addition to the SEBAL model (Bastiaanssen et al., 1998). A schematic overview of the different input pa-rameters and intermediate products of the ETLook algorithm is illustrated in Fig. 3. Being mainly driven by actual soil moisture instead of surface temperature, usage of ETLook avoids the limiting factors of models based on closure of the energy balance. These include poor suitability of the mod-els in larger areas, where differences in surface temperature cannot be solely explained by differences in the surface en-ergy balance. Also, ETLook does not rely on thermal infrared sensors sensitive to cloudy conditions, which is a particular advantage in regions with a temperate climate. The model has been tested for different climatological conditions and locations around the world (Pelgrum et al., 2010).
ETLook distributes incoming solar radiation over canopy and soil within a pixel based on satellite-derived Leaf Area Index (LAI) values. The Penman-Monteith equation is solved separately for vegetation and soil in order to split the evapotranspiration (ET) into transpiration (T) and evaporation (E):
T =
1 Rn,canopy+ρ cpr 1e a,canopy
1+γ
1+ rcanopy
ra,canopy
(1)
E=
1 Rn,soil−G+ρ cpra,soil1e
1+γ
1+ rsoil
ra,soil
, (2)
where 1 is the slope of the saturation vapour pressure curve (hPa K−1), 1
Fig. 3.Schematic flowchart of ETLook.
is the air density (kg m−3),c
p is the specific heat of dry air
(J kg−1K−1),γ is the psychrometric constant (hPa K−1),G is the soil heat flux (W m−2),R
n,canopyandRn,soil (W m−2) are the net radiation for canopy and soil respectively,rcanopy andrsoil (s m−1) are the canopy and soil resistance respec-tively, and ra,canopy andra,soil (s m−1) are the aerodynamic canopy and soil resistance respectively.
DailyRnis computed by correcting solar radiation at the top of the atmosphere for atmospheric influences and sur-face albedo, and adding the occurring upward and downward longwave radiation. The LAI is then used to partition net ra-diation between canopyRn,canopyand soilRn,soil. The aero-dynamic canopy and soil resistance,ra,canopyandra,soil, are a function of wind speed and surface roughness. The soil re-sistancersoilis a function of the soil moisture content in the top soil: with less moisture in the top soil, the resistance to evaporation will increase. Soil moisture can be derived from remote sensing observations (such as AMSR-E microwave measurements). The canopy resistancercanopyis a function of the LAI and four dimensionless stress functions, which are dependent on soil moisture content and meteorological conditions.
The ETLook model for the Bellebeek catchment has a spa-tial resolution of 30 m and is run with time steps of one day. All inputs and outputs are daily values and Eqs. (1) and (2) are solved once for every day.
As summarized in Table 1, the model is based on the following input data. Firstly, daily spatial information on surface albedo and Normalized Difference Vegetation In-dex (NDVI) were obtained from remote sensing imagery from satellites as DMC (Disaster Monitoring Constellation),
non-irrigated conditions in both the calibration area and the current study area.
The ETLook algorithm has been trained using water bal-ance data and SEBAL simulations for the year 2010 in The Netherlands. Given the similar climatological and geograph-ical conditions, this model configuration was assumed appli-cable for the study area currently under consideration. The ETLook algorithm is applied for the Bellebeek catchment for a six-month period: from 1 April 2009 through 30 Septem-ber 2009. No ETLook results are available for 4 April 2009 because no meteorological data from the Liedekerke station were available that day. ETLook produces spatial informa-tion on Rn, G, LE and H (W m−2) on a daily basis. It is clear that for the estimation of the surface fluxes, the ETlook approach is based on different input data compared to the LAS-approach. As such, the consistency between ETLook-and LAS-derived fluxes can be analysed.
5 Results and discussion
5.1 Performance of ETLook
Before evaluating the consistency between LAS-derived
<LE>and ETLook-derived<LE>, the consistency of the output of the ETLook algorithm is analysed on the point scale and on the catchment scale with, respectively, measurements of the Eddy Covariance station in Ternat and TOPLATS model results of the catchment.
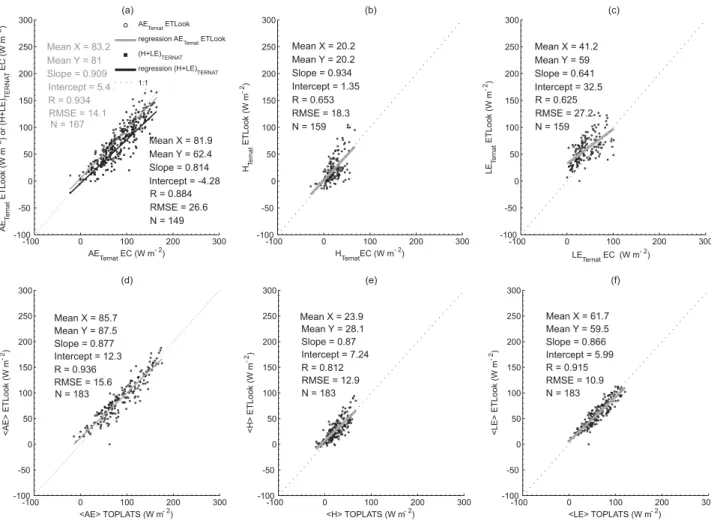
For the consistency analysis at the point scale, the calcu-lated fluxes from the pixel where the EC-station is situated are extracted from the ETLook grids and compared to daily averages of the EC-measurements. A valid value for a daily average is only considered when all 24 hourly data (out of 24 h) are available. Scatter plots of this comparison for daily available energy (Rn−G),Hand LE are shown in Fig. 4a–c, respectively.
From Fig. 4a, it is clear that ETLook succeeds rather well in estimating the available energy at the point-scale (slope = 0.909 and determination coefficientR= 0.934). The ETLook estimated sensible and latent heat fluxes do rea-sonably agree with the EC-measurements. However, there is some mismatch (R= 0.653 and 0.625 forH and LE respec-tively) which, e.g. can be due to a footprint issue, because the source area of the EC-measurement exceeds the 30 m resolu-tion of ETLook (Samain et al., 2011). Apart from this expla-nation, it is probably mainly caused by the energy balance closure problem of the EC-technique. From the mean val-ues ofH and LE, it can be seen that ETLook estimates both fluxes to be higher than measured with the EC-equipment. On the extra scatterplot in Fig. 4a, the sum of H and LE measured with the EC-station is plotted against the available energy measured at the Ternat station. From the mean values and the slope of 0.814, it is clear that for most of the daily time steps,H+ LE is less thanRn−G, which means that the
Table 3. Evapotranspiration sums for every 10-day period in the considered six-months period from estimates by ETLook, TOPLATS and LAS. The number of considered days within the 10-day period is indicated byN.
year month Days for N ETLook TOPLATS LAS
10-day (days) (mm) (mm) (mm)
period
2009 April 1–10 3 4.78 3.88 2.96
11–20 3 6.12 4.92 2.63
21–30 5 8.02 8.29 4.72
May 1–10 8 12.78 15.98 12.09
11–20 8 13.67 16.70 13.48
21–31 8 21.41 23.91 20.09
June 1–10 8 16.52 19.13 15.54
11–20 0 – – –
21–30 0 – – –
July 1–10 7 14.93 17.98 14.96
11–20 4 10.11 11.28 12.03
21–31 8 24.53 22.89 23.28
Aug 1–10 6 19.10 18.43 18.70
11–20 5 12.07 12.71 12.73
21–31 9 22.17 20.23 17.21
Sep 1–10 10 17.28 16.74 12.37
11–20 4 5.78 4.25 3.02
21–30 3 3.56 2.90 0.77
measurements from the EC-station show an unclosed energy-balance, a problem that has been described extensively. Ac-cording to Foken (2008), the energy balance closure problem of EC-measurements is not a problem of measurement errors or storage terms, but a scale problem as EC equipment is not able to measure the exchange processes on the larger scale and, as such, does not measure large scale fluxes that also need to be accounted for in the energy balance at the point scale.
At the catchment scale, the average of the fluxes calculated by ETLook for all pixels within the catchment are compared to the catchment averaged fluxes calculated by TOPLATS and averaged to a daily time step. Scatterplots for<AE>,
-100 0 100 200 300 -100 -50 0 50 100 150 200 250 300
Mean X = 85.7 Mean Y = 87.5 Slope = 0.877 Intercept = 12.3 R = 0.936 RMSE = 15.6 N = 183
<AE> TOPLATS (W m- 2)
<AE> ETLook (W m -2 ) (d)
-100 0 100 200 300
-100 -50 0 50 100 150 200 250 300
Mean X = 23.9 Mean Y = 28.1 Slope = 0.87 Intercept = 7.24 R = 0.812 RMSE = 12.9 N = 183
<H> TOPLATS (W m- 2)
<H> ETLook (W m -2 ) (e)
-100 0 100 200 300
-100 -50 0 50 100 150 200 250 300
Mean X = 61.7 Mean Y = 59.5 Slope = 0.866 Intercept = 5.99 R = 0.915 RMSE = 10.9 N = 183
<LE> TOPLATS (W m- 2)
<LE> ETLook (W m -2 ) (f)
-100 0 100 200 300
-100 -50 0 50 100 150 200 250 300
Mean X = 83.2 Mean Y = 81 Slope = 0.909 Intercept = 5.41 R = 0.934 RMSE = 14.1 N = 167
Mean X = 81.9 Mean Y = 62.4 Slope = 0.814 Intercept = -4.28 R = 0.884 RMSE = 26.6 N = 149
AE
TernatEC (W m - 2 ) AE T ernat ETLook (W m -2 ) or (H+LE) TERNA T EC (W m -2 ) (a)
AETernatETLook regression AETernatETLook (H+LE)TERNAT regression (H+LE)TERNAT 1:1
-100 0 100 200 300
-100 -50 0 50 100 150 200 250 300
Mean X = 20.2 Mean Y = 20.2 Slope = 0.934 Intercept = 1.35 R = 0.653 RMSE = 18.3 N = 159
H
TernatEC (W m - 2 ) HT ernat ETLook (W m -2) (b)
-100 0 100 200 300
-100 -50 0 50 100 150 200 250 300
Mean X = 41.2 Mean Y = 59 Slope = 0.641 Intercept = 32.5 R = 0.625 RMSE = 27.2 N = 159
LE
TernatEC (W m - 2)
LE T ernat ETLook (W m -2 ) (c)
Fig. 4.Comparison for AE,Hand LE between ETLook and point-measurements(a),(b)and(c), and between ETLook and TOPLATS(d), (e)and(f).
5.2 Consistency between LAS, ETLook and TOPLATS
Because ETLook is able to estimate the energy balance terms at the point scale and at the catchment scale, it can be used as a consistency check for the latent heat flux (or evapo-transpiration rates) estimated from the LAS. Samain et al. (2011) have shown that the sensible heat flux estimates from the LAS in unstable conditions are representative for the catchment.
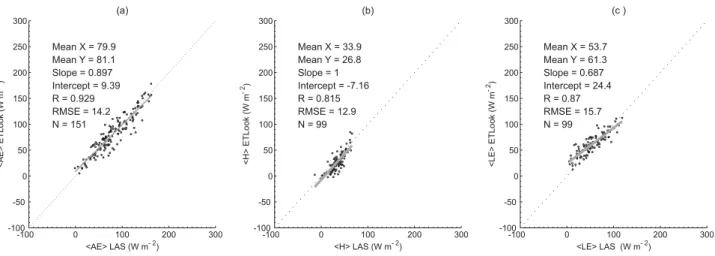
To evaluate the consistency between LAS and remote sensing-based fluxes, the daily averages of the measured ssible heat flux by the LAS, the used values of available en-ergy to convert LAS-H into LE-values and the resulting la-tent heat flux from the energy balance equation are compared to the catchment-average of these daily fluxes (<AE>,
< H >and<LE>) calculated by ETLook. Scatterplots for all these components of the energy balance on the catchment scale are presented in Fig. 6a–c respectively, while the time series are shown in Fig. 5.
The scatterplot and time series of <AE> reveal that the available energy for the catchment estimated from the
Liedekerke point-measurements but upscaled to the catch-ment through the use of the hydrologic model shows good correspondence with the catchment available energy cal-culated by ETLook (RMSE = 14.2 W m−2, R= 0.93 and slope = 0.9). This is comparable to the results of Teixeira et al. (2009) where an RMSE of 17.5 W m−2andR2of 0.94 showed a good agreement between SEBAL results and field measurements.
As Samain et al. (2012) states that the daily average ofH
derived from LAS-data can be largely influenced by a wrong estimate forH during some hours of the day, valid daily av-erages of the LAS-derived fluxes are considered only where for all 24 h out of 24 hourly data are available to calculate
< H >and<LE>. Because of the procedure for sensible heat flux calculation from LAS-data (Samain et al., 2012), there are a considerable amount of hours where no< H >
(and resulting<LE>) could be determined from LAS data, and hence less daily averages could be calculated than for
<AE>.
Apr(17) May(07) May(27) Jun(16) Jul(06) Jul(26) Aug(15) Sep(04) Sep(24) -100 0 100 200 <AE> (W m -2 )
Apr(17) May(07) May(27) Jun(16) Jul(06) Jul(26) Aug(15) Sep(04) Sep(24) 0 5000 10000 <AE> cum -2 ) <AE> ETLOOK <AE> TOPLATS <AE> LAS
Apr(17) May(07) May(27) Jun(16) Jul(06) Jul(26) Aug(15) Sep(04) Sep(24) -50 0 50 100 150 <H> (W m -2 )
Apr(17) May(07) May(27) Jun(16) Jul(06) Jul(26) Aug(15) Sep(04) Sep(24) 0 5000 10000 <H> cum -2 ) <H> ETLOOK <H> TOPLATS <H> LAS
Apr(17) May(07) May(27) Jun(16) Jul(06) Jul(26) Aug(15) Sep(04) Sep(24) -50 0 50 100 150 <LE> (W m -2 )
Apr(17) May(07) May(27) Jun(16) Jul(06) Jul(26) Aug(15) Sep(04) Sep(24) 0 5000 10000 <LE> cum -2 ) <LE> ETLOOK <LE> TOPLATS <LE> LAS
Fig. 5.Time series for daily<AE>(top panel),< H >(middle panel) and<LE>(bottom panel) as calculated by ETLook, TOPLATS and LAS for the Bellebeek catchment. Cumulative values for the available days are given as well (right axes).
-100 0 100 200 300
-100 -50 0 50 100 150 200 250 300
Mean X = 79.9 Mean Y = 81.1 Slope = 0.897 Intercept = 9.39 R = 0.929 RMSE = 14.2 N = 151
<AE> LAS (W m- 2)
<AE> ETLook (W m -2 ) (a)
-100 0 100 200 300
-100 -50 0 50 100 150 200 250 300
Mean X = 33.9 Mean Y = 26.8 Slope = 1 Intercept = -7.16 R = 0.815 RMSE = 12.9 N = 99
<H> LAS (W m- 2)
<H> ETLook (W m -2 ) (b)
-100 0 100 200 300
-100 -50 0 50 100 150 200 250 300
Mean X = 53.7 Mean Y = 61.3 Slope = 0.687 Intercept = 24.4 R = 0.87 RMSE = 15.7 N = 99
<LE> LAS (W m- 2)
<LE> ETLook (W m -2 ) (c )
Fig. 6.Comparison for ETLook-derived and LAS-derived<AE>(a),< H >(b)and<LE>(c).
ETLook and the estimated fluxes from LAS-data correlate rather well and are close to the expected 1 : 1 relation. From this comparison it can also be seen that LAS estimates the daily average of< H >on average slightly higher than ET-Look, and as both estimates of<LE>are based on the en-ergy balance equation, it is clear that the LAS-derived daily
< LE >-fluxes are on average slightly lower than estimated by ETLook. However, the RMSE-values for dailyH and LE of respectively 12.9 and 15.7 W m−2andR-values of 0.815 and 0.87 are also comparable to the results of Teixeira et al. (2009) where RMSE values of 41.8 and 33.8 W m−2 were found withR2-values of 0.93 and 0.83 between SEBAL es-timates and field measurements ofHand LE.
in comparison with ETLook appear in April and Septem-ber. For those months, the resemblance between ETLook-and TOPLATS-results is slightly better. For the other months there is no clear over- or underestimation of the 10-day evap-otranspiration estimates by any of the three techniques used. For the 10-day periods from May to August, the average dif-ferences between LAS and ETLook and between LAS and TOPLATS are respectively 3.5 % and 12.6 %, which is sim-ilar to the results of Hemakumara et al. (2003) where the deviation of 10-days ET between LAS and SEBAL was av-eragely 17 %.
Samain et al. (2011) mentioned an underestimate of
< H >measured with the LAS compared to the TOPLATS results. Different possible explanations for this underesti-mation of < H > have been mentioned, such as the satu-ration effect, flux divergence and/or uncertainty of the sta-bility functions. This underestimate of < H > would re-sult in an overestimate of LAS-derived <LE> compared to TOPLATS. However, from the 10-day evapotranspira-tion rates, this overestimate of <LE>by LAS compared to TOPLATS is not clear for the considered period in this study. Probably a better judgement of stable and unstable conditions for the LAS (as elaborated in Samain et al., 2012) or the model parameters for TOPLATS are an explanation for the better agreement between TOPLATS and LAS for the considered period.
6 Summary and conclusions
In this paper, daily estimates of the evapotranspiration rates for a heterogeneous catchment of 102.3 km2from three dif-ferent techniques have been made and intercompared.
Firstly, the catchment averaged evapotranspiration rates are estimated from the energy balance approach based on LAS-measurements of H over a 9.5 km path within the catchment and estimates of the available energy for the catch-ment. Operational estimates of the catchment available en-ergy are calculated from point measurements ofRnandGin the catchment and adjusted to the catchment scale through the use of the calibrated land surface model TOPLATS.
Secondly, ETLook is introduced as a remote sensing tool to estimate continuous series of the energy balance terms for large areas and for high temporal resolutions (up to daily time step) without the restriction of cloud free conditions. As such, ETLook provides the opportunity of a consistency analysis for the large-scale estimates of the sensible and la-tent heat flux from the LAS. Therefore, in first instance, the performance of ETLook at the point and at the catchment scale is evaluated by comparing the ETLook-results to daily averages of AE,H and LE from an EC-station in the catch-ment and to TOPLATS model results for the catchcatch-ment.
Because it seems that ETLook is able to estimate the en-ergy balance terms for daily time steps at the point scale and at the catchment scale, it is used to intercompare the
latent heat flux (or evapotranspiration rates) estimated from the LAS and TOPLATS on a daily basis. As for the avail-able energy, ETLook and the estimates from the Liedekerke point-measurements adjusted to the catchment scale through the use of the hydrologic model show good correspondence with an RMSE of 14.2 W m−2 andR-value of 0.929. For the sensible and latent heat fluxes, daily averages from LAS and ETLook-results are also in good agreement (RMSE of 12.9 and 15.7 W m−2), but with some more bias (R= 0.815 and 0.87). Also, from the evapotranspiration rates calculated per 10-day period, there is a good correspondence between TOPLATS-results and both ETLook and LAS-derived evap-otranspiration rates with average differences from 12.6 % to 3.5 %.
To conclude, ETLook provides the opportunity to estimate continuous series of the energy balance terms of a large area such as a catchment for daily time steps. However, as flood forecast models usually work at a higher temporal resolution (hours), ETLook is less suitable to produce (hourly) catch-ment averaged evapotranspiration estimates. Because a LAS works at a much higher temporal resolution (minute), it is more suitable to provide hourly estimates of catchment aver-aged evapotranspiration rates. The evapotranspiration rates can be estimated from sensible heat flux estimates by the LAS using the energy balance approach when representa-tive estimates of the available energy for the catchment can be determined. Another restriction in the use of the LAS is the fact that stability conditions have to be determined and that no fluxes can be calculated for conditions where the LAS-signal is disturbed, e.g. by precipitation or fog. Nev-ertheless, from the intercomparison of both the ETLook and TOPLATS-results, it seems that despite these limitations, for hours where LAS data are available, the LAS can provide good estimates of the evapotranspiration rates at a high tem-poral resolution.
Acknowledgements. The authors would like to express their gratitude to the Department Operational Water Management of the Ministery of the Flemish Community for providing the meteoro-logical, and scintillometer data and to the Flanders Geographical Information Agency for providing the soil texture, land use and DEM maps. We would also like to thank A. Van der Hasselt for the kind offer to install the EC-station on his property in Ternat. A special thanks to Davy Loete from the Laboratory of Hydrology and Water Management of Ghent University for his help in the installation and maintenance of the EC-station. We would also like to thank the Foundation for Scientific Research of the Flemisch Community (FWO-Vlaanderen) for their funding of the EC equipment, and Henk De Bruin, Volker Thiermann and Bettina Schrauf for the information and support on scintillometer measurements and treatment.
References
Bai, J., Liu, S., and Mao, D.: Area-averaged Evapotranspiration Fluxes Measured from Large Aperture Scintillometer in the Hai River Basin, in: River Basin Research And Planning Approach, edited by: Zhang, H., Zhao, R., and Zhoa, H., Orient ACAD Fo-rum, Marrickville, Australia, 331–340, 2009.
Bastiaanssen, W., Menenti, M., Feddes, R., and Holtslag, A.: A remote sensing surface energy balance algorithm for land (SE-BAL), J. Hydrol., 213, 198–212, 1998.
Ezzahar, J. and Chehbouni, A.: The use of scintillome-try for validating aggregation schemes over heteroge-neous grids, Agr. Forest Meteorol., 149, 2098–2109, doi:10.1016/j.agrformet.2009.09.004, 2009.
Ezzahar, J., Chehbouni, A., Hoedjes, J., Ramier, D., Boulain, N., Boubkraoui, S., Cappelaere, B., Descroix, L., Mougenot, B., and Timouk, F.: Combining scintillometer measurements and an ag-gregation scheme to estimate area-averaged latent heat flux dur-ing the AMMA experiment, J. Hydrol., 375, 217–226, 2009. Famiglietti, J. S. and Wood, E. F.: Multiscale modeling of spatially
variable water and energy balance processes, Water Resour. Res., 30, 3061–3078, 1994.
Foken, T.: The energy balance closure problem: An overview, Ecol. Appl., 18, 1351–1367, doi:10.1890/06-0922.1, 2008.
Guyot, A., Cohard, J.-M., Anquetin, S., Galle, S., and Lloyd, C.: Combined analysis of energy and water balances to estimate la-tent heat flux of a sudanian small catchment, J. Hydrol., 375, 227–240, 2009.
Hartogensis, O., Watts, C., Rodriquez, J.-C., and De Bruin, H. A. R.: Derivation of an effective height for scintillometers: La Poza ex-periment in Northwest Mexico, J. Hydrometeorol., 4, 915–928, 2003.
Hemakumara, H., Chandrapala, L., and Moene, A.: Evapotranspi-ration fluxes over mixed vegetation areas measured from large aperture scintillometer, Agr. Water Manage., 58, 109–122, 2003. Kleissl, J., Gomez, J., Hong, S. H., Hendrickx, J. M. H., Rahn, T., and Defoor, W. L.: Large aperture scintillometer intercomparison study, Bound.-Lay. Meteorol., 128, 133–150, 2008.
Kleissl, J., Hong, S.-H., and Hendrickx, J. M. H.: New Mexico Scin-tillometer Network. Supporting Remote Sensing and Hydrologic and Meteorological Models, B. Am. Meteorol. Soc., 90, 207– 218, doi:10.1175/2008BAMS2480.1, 2009a.
Kleissl, J., Watts, C. J., Rodriguez, J. C., Naif, S., and Vivoni, E. R.: Scintillometer Intercomparison Study-Continued, Bound.-Lay. Meteorol., 130, 437–443, doi:10.1007/s10546-009-9352-z, 2009b.
Kohsiek, W., Meijninger, W. M. L., Debruin, H. A. R., and Beyrich, F.: Saturation of the large aperture scintillometer, Bound.-Lay. Meteorol., 121, 111–126, 2006.
Mauder, M. and Foken, T.: Documentation and instruction manual of the eddy covariance software package TK2, Univ. of Bayreuth, Dept. of Mikrometeorology, Bayreuth, Germany, 2004.
Mauder, M., Foken, T., Clement, R., Elbers, J. A., Eugster, W., Gr¨unwald, T., Heusinkveld, B., and Kolle, O.: Quality control of CarboEurope flux data – Part 2: Inter-comparison of eddy-covariance software, Biogeosciences, 5, 451–462, doi:10.5194/bg-5-451-2008, 2008.
Meijninger, W., Hartogensis, O., Kohsiek, W., Hoedjes, J., Zuurbier, R., and De Bruin, H. A. R.: Determination of area-averaged sen-sible heat fluxes with a large aperture scintillometer over a het-erogeneous surface – Flevoland field experiment, Bound.-Lay. Meteorol., 105, 37–62, 2002.
Meijninger, W. M. L., Beyrich, F., Luedi, A., Kohsiek, W., and De Bruin, H. A. R.: Scintillometer-based turbulent fluxes of sen-sible and latent heat over a heterogeneous land surface – A con-tribution to LITFASS-2003, Bound.-Lay. Meteorol., 121, 89– 110, 2006.
Pauwels, V. and Samson, R.: Comparison of different methods to measure and model actual evapotranspiration rates for a wet slop-ing grassland, Agr. Water Manage., 82, 1–24, 2006.
Pelgrum, H., Miltenburg, I., Cheema, M., Klaasse, A., and Bas-tiaanssen, W.: ETLook a Novel Continental Evapotranspiration Algorithm, in: Remote Sensing and Hydrology Symposium, Jackson Hole, Wyoming, USA, 2010.
Samain, B., Ferket, B., Defloor, W., and Pauwels, V.: Estimation of catchment averaged sensible heat fluxes using a Large Aper-ture Scintillometer, Water Resources Research, 47, W05536, doi:10.1029/2009WR009032, 2011.
Samain, B., Defloor, W., and Pauwels, V.: Continuous time series of catchment-averaged sensible heat flux from a Large Aperture Scintillometer: efficient estimation of stability conditions and im-portance of fluxes under stable conditions, J. Hydrometeorol., 13, 423–442, doi:10.1175/JHM-D-11-030.1, 2012.
Savage, M. J.: Estimation of evaporation using a dual-beam surface layer scintillometer and component energy bal-ance measurements, Agr. Forest Meteorol., 149, 501–517, doi:10.1016/j.agrformet.2008.09.012, 2009.
Teixeira, A. H. D. C., Bastiaanssen, W. G. M., Ahmad, M. D., and Bos, M. G.: Reviewing SEBAL input parameters for as-sessing evapotranspiration and water productivity for the Low-Middle Sao Francisco River basin, Brazil Part A: Calibra-tion and validaCalibra-tion, Agr. Forest Meteorol., 149, 462–476, doi:10.1016/j.agrformet.2008.09.016, 2009.
Verstraeten, W. W., Veroustraete, F., and Feyen, J.: As-sessment of evapotranspiration and soil moisture content across different scales of observation, Sensors, 8, 70–117, doi:10.3390/s8010070, 2008.
Webb, E., Pearman, G., and Leuning, R.: Correction of Flux Mea-surements for Density Effects due to Heat and Water Vapor Transfer, Q. J. Roy. Meteorol. Soc., 106, 85–100, 1980. Xu, C. and Singh, V.: Evaluation of three