SELECTION CRITERIA
Juliana Costa de Rezende1, Cesar Elias Botelho2, Antônio Carlos Baião de Oliveira3, Felipe Lopes da Silva4, Gladyston Rodrigues Carvalho5, Antônio Alves Pereira6 (Recebido: 8 de julho de 2013; aceito: 21 de novembro de 2013)
ABSTRACT: In order to investigate the aspects related to the use of selection indexes in Coffea arabica breeding, analytical
procedures were used: index based on the sum of ranks of Mulamba and Mock (ISR), index of desired gains of Pesek and Baker (DGI), classic index of Smith and Hazel (CI), base index of Williams (BI), and direct and indirect selection (DIS). Thirty-nine progenies were evaluated in the 4th generation by selfing after the 2nd backcross between “Catuai” and “Mundo Novo”. The
evaluations were realized in coffee plants from 30 months old on, having the following characteristics: yield of eight harvests, classification for blend 16 and over, percentage of floating fruits, vegetative vigor and percentage of flat beans. The analytical procedures of selection indexes showed possibilities of applications in advanced generations of breeding being superior when compared with DIS. The DGI was not appropriate in the situation analyzed in this work. The selection based on CI and BI was the criteria that showed the best results in terms of gains in yield and grain size, and in the distribution of gains in the other characteristics.
Index terms: Coffea arabica, genetic breeding, selection indexes.
PROGRESSOS GENÉTICOS EM PROGÊNIES DE CAFÉ POR DIFERENTES CRITÉRIOS DE SELEÇÃO
RESUMO: Objetivando-se investigar os aspectos relacionados à utilização de índices de seleção no melhoramento de café arábica, foram utilizados os procedimentos analíticos: índice com base em soma de postos de Mulamba and Mock (ISP), índice de ganhos desejados de Pesek and Baker (IGD), índice clássico de Smith e Hazel (IC), índice-base de Williams (IB) e a seleção direta e indireta (SDI). Foram avaliadas 39 progênies na 4ª geração por autofecundação, após o 2º retrocruzamento entre ‘Catuaí’ e ‘Mundo Novo’. As avaliações foram realizadas em cafeeiros a partir dos 30 meses de idade, compreendendo as seguintes características: produtividade de oito colheitas, classificação quanto à peneira 16 e acima, porcentagem de frutos granados, vigor vegetativo e porcentagem de grãos chatos. Os procedimentos analíticos dos índices de seleção apresentam possibilidades de aplicações em gerações avançadas de melhoramento sendo superiores em relação à SDI. O IGD não foi adequado na situação analisada no presente trabalho. A seleção com base nos IC e IB foi o critério que apresentou os melhores resultados em termos de ganhos em produtividade e tamanho de grãos e na distribuição de ganhos nas demais características. Termos para indexação: Coffea arabica, melhoramento genético, índices de seleção.
1 INTRODUCTION
In order to obtain higher cultivars in breeding program, it is necessary that all or most of their agronomic characteristics are favorable ones. Therefore, selection indexes have been proposed as criterion of simultaneous selection of many desirable traits, therefore increasing the probability of success of the program.
Selection indexes are multivariate techniques by which numerical values are created, working as an additional, theoretical trait, resulting from the combination of multiple information within the experimental unit. They make it possible the selection based in a complex of variables that are able to gather several economic traits.
1,2,5Empresa de Pesquisa Agropecuária de Minas Gerais Epamig - Unidade Regional do Sul de Minas
Cx. P. 176 - 37.200-000 - Lavras - MG - [email protected], [email protected], [email protected]
3 Embrapa Café - Campus da UFV S/N - Cx. P. 216 - 36570-000 - Viçosa- MG - [email protected] 4,6 Epamig - Unidade Regional da Zona da Mata - Campus da UFV S/N - Cx. P. 216 - 36570-000 - Viçosa - MG
[email protected], [email protected]
Selection shall be coherent with the desirable objectives and the selection process used so it will result in better simultaneous gains (CRUZ; REGAZZI; CARNEIRO, 2004).
Different indexes represent various alternatives of selection in breeding programs, and percentage gains, consequently. According to Cruz, Regazzi and Carneiro (2004), the classic index, proposed by Hazel (1943) and Smith (1936), consists in a linear combination of several economic traits whose weight coefficients are estimated in order to maximize correlation between the index and the phenotypic aggregated. Pesek and Baker (1969) proposed an index in which the economic weights could be replaced by the gains desired by the breeder for each trait, subjected to
productivity (Prod), in 60 kg sacks of processed coffee per hectare (sack/ha) from 8 harvests (1998 to 2005); classification of grains in 16 or above sieve (Sieve); percentage of formed grains (Form); plant vigor (PV) and percentage of flat beans (Flat) immediately after 2005 harvest.
Production was measured immediately after harvest, performed from May to July every year. Afterwards, conversion for 60 kg processed coffee sacks ha-1 was carried on. This conversion was made by approximation of values, taking into account an average yield of 480 L of “farm coffee” for each 60 kg sack of processed coffee.
Samples of 200 g of processed coffee of each plot were classified in intercalated sieves, with mass of the grains retained in each one, transformed into percentage and sum of 16, 17 and 18 sieve regarded as the trait 16 and above sieve. Percentage of formed beans was made by using the modified methodology proposed by Antunes Filho and Carvalho (1955) by which 100 cherry fruits are placed in water, being considered floating grains those which remained in the surface. The difference of this value for 100 is the percentage of formed beans.
Plant vigor of the coffee trees was evaluated by distributing marks according to a 10 point arbitrary scale as suggested by Carvalho, Mônaco and Fazuoli (1979). Classification by grain type was carried out by summing the number of defects found in 200 g samples of processed coffee, by putting apart flat-type beans.
Gains by direct and direct selection were estimated (CRUZ; REGAZZI; CARNEIRO, 2004) for the five evaluated traits, considering the selection of the twelve best progenies, approximately 28.5%. Selection was for increase for all the traits. In addition to this strategy, selection process was also carried out based in the classical index (HAZEL, 1943; SMITH, 1936), desired gain index (PESEK; BAKER, 1969), base index (WILLIAMS, 1962) and index based on sum of ranks (MULAMBA; MOCK, 1978).
The classic index (CI) was based in solving the following matrix system: b = P-1Ga, where b is the 5 ×1 dimension vector of index balance coefficients to be estimated: P-1 is the inverse of 5 × 5 dimension matrix of phenotypic variances and covariances among traits; G is the 5 × 5 dimension matrix of genetic variances and covariances among characteristics; and a is a 5 × 1 vector of economic weights.
the restrictions imposed by the phenotypic and genotypic constitution of the population. Williams (1962) proposed the so-called base-index, which does not require estimates of the genotypic and phenotypic parameters and uses relative economic values as coefficients. Mulamba and Mock (1978) classified the genotypes in relation to each one of the traits, in an order favorable to the breeding, eliminating the need of establishing economic weights and estimates of genotypic and phenotypic covariance.
Those indexes were checked by other authors in soybean (COSTA et al., 2004), popcorn (RANGEL et al., 2011), passion fruit (GRANATE; CRUZ; PACHECO, 2007) and eucalyptus (MARTINS; MARTINS; PINHO, 2006). However, the reports on the use of those indexes in the selection of segregating populations of Coffea arabica are rare.
The objective of this work was to estimate genetic gains predicted by different selection indexes for five agronomic characteristics, evaluated in 42 progenies of Coffea arabica L. and compares them with each other.
2 MATERIAL AND METHODS
The experiment was settled on Fazenda Experimental da Epamig, in Três Pontas, Southern Minas Gerais state in January 1996, at altitude of 900 m, latitude of 21o 22’01” S and longitude 45o 30’45” W. Average annual rainfall is 1.670 mm and annual average temperature is 20.1oC. The soil in the experiment area is classified as argisol, with average texture.
It was evaluated 42 genotypes within F4 generation, with 39 genotypes resulting from the 4th generation by selfing after the second “Mundo Novo” and “Catuaí” backcross and three cultivars used as control (Catuaí Vermelho IAC 99, Rubi MG 1192 and Acaiá Cerrado MG 1474).
It was used a random block design, with three replicates and six plants per plot. An spacing of 2.50 m between rows x 0.70 m between plants, corresponding to 5.714 plants per hectare was used. Settlement and conduction of the experiment were in agreement with the technical recommendations for coffee crops. Phytosanitary management was preventively and curatively performed, by using chemical products, followed by seasonality of occurrence of pests and diseases.
Evaluations started when plants were at 30 months of age, comprising the following traits:
Construction of index of desired gains (IDG), as suggested by its own name, is based in the desired gains and it involves the knowledge of expression of expected gains of several traits, which is defined by: b = G-1Δg
d, in which Δgd is the vector of desired gains; G-1 is the inverse of genetic variance and covariance matrix.
Base index (BI) proposes the establishment of indexes by a linear combination of average phenotypic values of the traits, which are directly balanced by their respective economic weights, in which I = a1x1 + a2x2 +... + anxn = a’X, in which X and a are n × 1 vectors, whose elements are the means and economic weights of the studied traits, respectively.
In the index based on sum of ranks (IBSR), orders of each genetic material are summed up in relation to each of the traits in an order favorable to breeding, resulting in the selection index, as it is described in the following: I = r1 + r2 + ...+ rn , in which I is the index value for a given individual or family; rj is the rank of an individual in relation to the jth trait; n is the number of traits by considering the index. Moreover, the variables are specified for different weights, so I = p1r1+p2r2+... + pnrn, in which pj is the economic weight given to the jth trait (CRUZ; REGAZZI; CARNEIRO, 2004; SANTOS et al., 2007).
Gain prediction was done to achieve an ideotype which was searched for obtaining progenies with better productivity, with no reduction in the means of the other traits. For each one of the selection indexes, it was used weights randomly obtained until it was found one which could predict the greatest genotypic gain.
The economic weights used in the experiment were the statistics coefficient of genetic variation (CVg), genetic standard deviation (SDg), heritability (h2), and the relationship between coefficient of genetic variation and coefficient of environment variation (CVg/CVe) and the values given for the relative importance (RI) of each trait, which were 100, 50, 40, 70 and 10 for Prod, Sieve, Formed, PV and Flat, respectively. Genes program (CRUZ, 2006) was used in genetic-statistics analyses and the chosen estimator was based in the selection differential.
3 RESULTS AND DISCUSSION
Significant differences (P<0.01) were found for all evaluated traits, showing the presence of genetic variability among progenies and the possibility of obtaining genetic gains with the selection. By observing the means of the evaluated
traits, it is concluded that they meet results from studies of progenies with C. arabica (CARVALHO et al., 2006, 2008; CORREA; MENDES; BARTHOLO, 2006). Coefficients of experimental variation varied from 1.93 to 16.32%, showing a good precision in the evaluation of the traits.
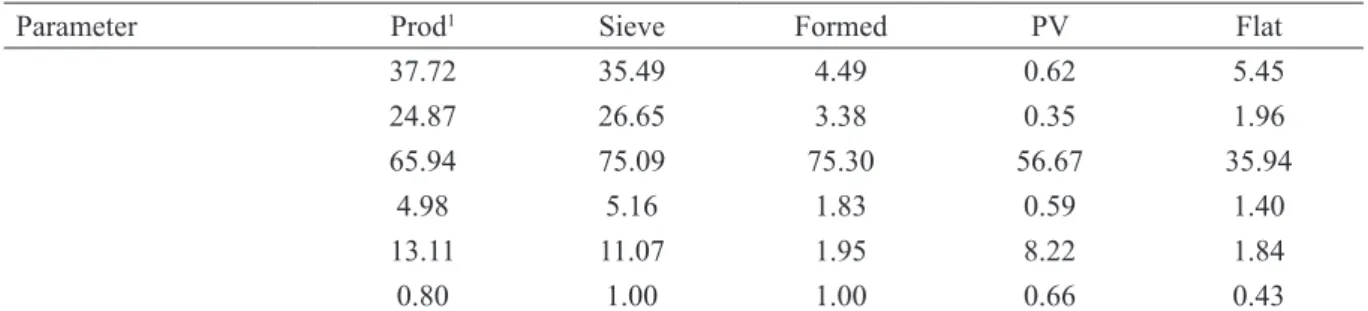
The use of selection indexes presents some difficulties as for example the determination of economic weights, which shall be established by respecting the proportionality of the factors involved (BAKER, 1986). A good option which has been used to establish the economic weights is the use of statistics of the data itself, as for example genetic standard deviation, heritability, coefficient of genetic variation and the relationship between coefficient of genetic variation and the coefficient of residual variation (Table 1) (MARTINS et al., 2003; MARTINS; MARTINS; PINHO, 2006; SANTOS et al., 2007). Those estimates of components express the genotypic variability, therefore, they are very important in a breeding program. The greater their magnitudes, the more heterogeneous the genotypes evaluated and the greater the possibility of selecting higher genetic material, aiming at using them as parents (FERRÃO et al., 2008).
The presence of a considerable amount of genetic variability, associated to the low coefficient of environmental heterogeneity, resulted in moderately high values of heritability for most traits, when compared to the other studies evaluating progenies of Coffea arabica (PETEK; SERA; FONSECA, 2008; REZENDE et al., 2001). Those results evidence the population potential in a study for breeding by selection. Although it had presented a low value of heritability, Flat is an important variable and any gain in this trait should be regarded. Thus, the estimates for this characteristic may indicate genetic variability and maximize genetic gain.
Coefficient of genetic variation expresses the magnitude of genetic variation in relation the trait mean. Estimates of coefficient of genetic variation reveal that the traits analyzed, presented low variation, overall (Table 1). This could have occurred because the studied population was in a quite high level of inbreeding (F4 generation).
The rate CVg/CVe, also known as relative coefficient of variation, estimated for the studied traits, resulted in values equal to one for Sieve and Formed and near to Prod, reflecting in a situation favorable for those traits. On the other hand, values of CVg/CVe for PV and Flat were 0.66 and 0.44, showing the difficulty in selecting higher progenies from those traits.
TABLE 1 - Phenotypic variances ( ), genotypic variance ( ), heritability ( ), genetic standard deviation ( ), coefficient of genetic coefficient of genetic variation ( ) and relationship between coefficient of genetic and residual variation
(
)
in coffee tree F4 progenies obtained by the crossing between Catuaí and Mundo Novo cultivars.Parameter Prod1 Sieve Formed PV Flat
37.72 35.49 4.49 0.62 5.45 24.87 26.65 3.38 0.35 1.96 65.94 75.09 75.30 56.67 35.94 4.98 5.16 1.83 0.59 1.40 13.11 11.07 1.95 8.22 1.84 0.80 1.00 1.00 0.66 0.43
1Productivity of processed coffee in sacks/ha/year of 8 harvests; Sieve: classification according to sieve 16 and above; Formed: percentage of
formed beans; PV: plant vigor and Floating: percentage of floating beans.
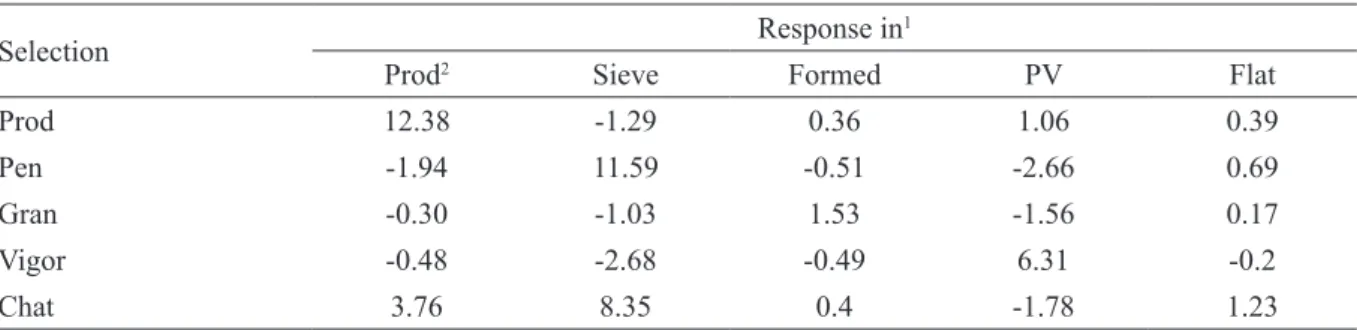
Firstly, in the direct and indirect selection, it is expected to obtain gains in only one trait on which selection is done, and it may occurs many favorable or unfavorable responses on the traits with secondary importance (COSTA et al., 2004). The best result was achieved when selection was done on Flat, a situation which provided considerable gains for Sieve and Prod (Table 2).
In coffee breeding programs, it is searched an ideotype whose performance includes, besides other characteristics, a high productive capacity and an increase in the size of the grains (FERREIRA et al., 2005). When selection is done on the Prod trait, small gains for traits Formed, PV and Chat were found, and a negative result was found for Sieve. A lower performance was found when selection was done on PV trait, which resulted in a loss for all the other traits (Table 2).
Overall, satisfying gains were not achieved by strategy of direct and indirect selection for the five studied traits (Table 2). In this case, it is recommended using the theory of selection indexes, aiming at achieving more balanced responses in the gains, for the evaluated traits (FERREIRA et al., 2005; MARTINS; MARTINS; PINHO, 2006).
When the classical index of Hazel (1943) and Smith (1936) was used, it was possible to achieve positive gains for the main evaluated traits (Prod and Sieve), regarding all the given economic weights (Table 3). Those results show that it is possible to promote effective increase of concentration of favorable alleles of those traits in the population. By these index, it was not predicted desirable gains for traits Formed, Flat
and PV, and this last one even presented negative signals, showing a low perspective of selecting vigorous genotypes.
According to Petek, Sera and Fonseca (2008), planting and cultivation system can soften and even solve problems from vigor loss, due to excessive loads as it was found in this work. By regarding CVg, DPg, CVg/CVe, h2 and PT as economic weights, joint percentage gain predicted by IC was 16.5%, 16.05%, 14.68%, 14.68% and 16.05%, respectively, showing an efficiency of those criterions in the selection of adequate genotypes by using this index in the selection (Table 3).
Index of Pesek and Baker (1969) presented identical gains in the traits by using different economic weights. The gains predicted jointly with this index, in function of the two main traits, were lower than the ones predicted by other selection indexes used in this work, with a gain estimate of 0.08% in all evaluated weights. The joint gain for all given economic weights was 8.01% (Table 3).
The base-index proposed by Williams (1962) provided compensating gains for Prod and Sieve, which expressed joint percentage gains of 16.16%, 15.95%, 15.55%, 15.55%, and 14.92% when CVg, DPg, CVg/CV and, h2 were used as economic weights and the economic weight given as attempt (WA), respectively. Thus, based on the economic weights used for achieving selective gains for the main traits, it is found that base index provided better results for selection of progenies of coffee tree from ‘Catuaí’ x ‘Mundo Novo’ crossing.
TABLE 2 - Estimate of percentage gains by direct and indirect selection for five traits evaluated in F4 coffee tree
progenies obtained by the crossing between Catuaí and Mundo Novo cultivars.
Selection Response in1
Prod2 Sieve Formed PV Flat
Prod 12.38 -1.29 0.36 1.06 0.39
Pen -1.94 11.59 -0.51 -2.66 0.69
Gran -0.30 -1.03 1.53 -1.56 0.17
Vigor -0.48 -2.68 -0.49 6.31 -0.2
Chat 3.76 8.35 0.4 -1.78 1.23
1Gains by direct selection = principal diagonal, in boldface; gains by indirect selection = out of the principal diagonal. 2Prod:Productivity of
processed coffee in sacks/ha/year of 8 harvests; Sieve: classification according to sieve 16 and above; Formed: percentage of formed beans; PV: plant vigor and Floating: percentage of floating beans.
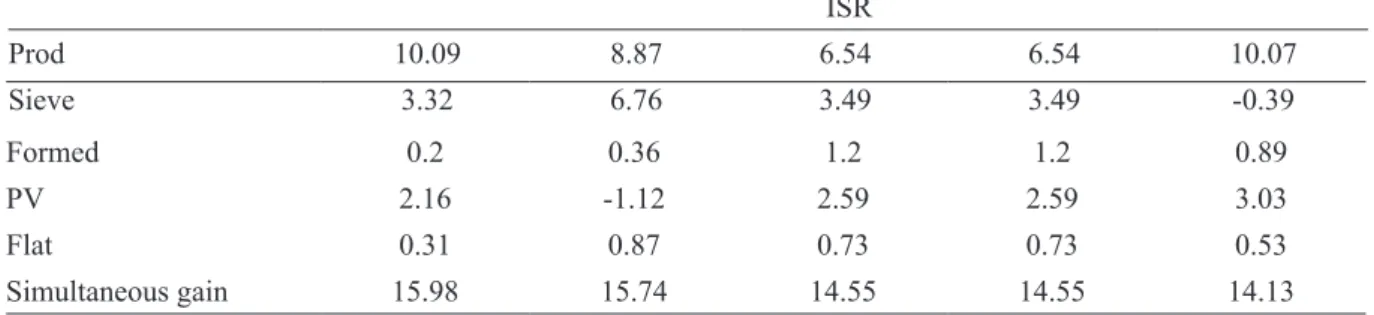
TABLE 3 - Estimates of percentage gains by simultaneous selection, by using classic index of Smith and Hazel (CI), desired gain index (DGI), base-index of Williams (BI) and index based on sum of ranks (ISR) based on five criteria of economic weight for five traits evaluated in F4 coffee tree progenies obtained from the crossing between
Catuaí and Mundo Novo cultivars.
Characteristics 1 CI CVg2 DPg CVg/CVe h2 WA Prod 7.9 7.9 6.65 6.65 4.01 Sieve 8.05 8.05 8.51 8.51 3.58 Formed 0.27 0.27 0.6 0.6 0.51 PV -1.12 -1.12 -2.0 -2.0 0.84 Flat 0.95 0.95 0.92 0.92 0.56 Simultaneous gain 16.5 16.05 14.68 14.68 16.05 DGI Prod 0.08 0.08 0.08 0.08 0.08 Sieve 2.68 2.68 2.68 2.68 2.68 Formed 0.89 0.89 0.89 0.89 0.89 PV 3.36 3.36 3.36 3.36 3.36 Flat 0.67 0.67 0.67 0.67 0.67 Simultaneous gain 8.01 8.01 8.01 8.01 8.01 BI Prod 7.4 7.9 7.58 7.58 10.54 Sieve 8.76 8.05 7.97 7.97 4.38 Formed 0.02 0.27 0.56 0.56 0.13 PV -0.69 -1.12 -0.96 -0.91 0.62 Flat 0.77 0.95 0.86 0.86 0.68 Simultaneous gain 16.26 16.05 16.06 16.06 16.35 Cont. ...
Formed 0.2 0.36 1.2 1.2 0.89
PV 2.16 -1.12 2.59 2.59 3.03
Flat 0.31 0.87 0.73 0.73 0.53
Simultaneous gain 15.98 15.74 14.55 14.55 14.13
1Prod:Productivity of processed coffee in sacks/ha/year of 8 harvests; Sieve: classification according to sieve 16 and above; Formed: percentage
of formed beans; PV: plant vigor and Floating: percentage of floating beans.2CVg = coefficient of genetic variation; DPg = genetic standard
deviation; CVg/CVe = index of variation; h2 = heritability; WA = weight given by attempts (100, 50, 40, 70, 10).
ISR
Prod 10.09 8.87 6.54 6.54 10.07
Sieve 3.32 6.76 3.49 3.49 -0.39
TABLE 3 Cont.
The joint percentage gain predicted by IB was similar for all economic weight used (Table 3). The highest genetic gains for grain productivity were predicted by the index based on sum of ranks of Mulamba and Mock (1978), when CVg, DPg and PT, were used as economic weights with estimates of 10.09%, 8.87% and 10.07%, for those weights, respectively. However, the desired trait 16 and above sieve presented a modest gain estimate for the weights CVg, CVg/CV, h2 and WA, and the last one presented expression of negative gains. The predicted joint percentage gain, when CVg, DPg ,CVg/CV, h2 and WA were used as economic weights was 15,98%, 15,74%, 14.55%, 14.55% and 14.03%, respectively.
Several authors have evaluated the use of selection indexes in breeding programs, and the index with the best results of predicted gains varies in each case. With the objective of evaluating the best methods of selection in the identification of clones of potato (Solanum tuberosum L.), Barbosa and Pinto (1997) concluded that the indexes studied in the present work were efficient in the simultaneous selection of many traits.
In the selection of higher progenies of popcorn UNB-2U, index of Mulamba and Mock (1978) resulted in more adequate proportional gains in the use of arbitrary economic weights for capacity of expansion and grain productivity, with respective values of 7.16% and 10.00% in the third cycle of recurring selection (SANTOS et al., 2007), 10.55% and 8.50% in the fourth cycle (AMARAL JUNIOR et al., 2010) and 6.01% and 8.53% in the fifth cycle of recurring selection (RANGEL et al., 2011).
When selecting higher progenies of popcorn CMS-43, Granate, Cruz and Pacheco (2002) achieved gain prediction in a greater number of traits by index of Smith (1936) and Hazel (1943), with joint percentage gains for
capacity of expansion and grain productivity of 9.14%. This same index was more efficient in the work of Ferreira et al. (2005) when comparing expected gains achieved by selection in progenies of corn full siblings.
4 CONCLUSIONS
Analytical procedures of selection indexes present possibilities of application in advanced generations of Arabica coffee breeding, with higher results in relation to direct and indirect selection.
Index of Pesek and Baker (1969) is adequate for the situation analyzed in the present work.
Selection index proposed by Hazel (1943) and Williams (1962) is the selection criterion which presents the best results in function of gains of productivity and sieve and in the distribution of gains in the other traits, so, it can be indicated as the most appropriate criterion for breeding in the studied population of C. arabica.
5 ACKNOWLEDGMENTS
We thank INCT-Café, Consórcio de Pesquisa Café and FAPEMIG, for financially supporting the Project. We also thank CNPq (JCR) for a PNPD fellowship.
6 REFERENCES
AMARAL JUNIOR, A. T. do et al. Improvement of a popcorn population using selection indexes from a fourth cycle of recurrent selection program carried out in two different environments. Genetics and Molecular Research, Ribeirão Preto, v. 9, p. 340-347, 2010.
ANTUNES FILHO, H.; CARVALHO, A. Melhoramento do cafeeiro, ocorrência de lojas vazias em frutos de café Mundo Novo. Bragantia, Campinas, v. 13, p. 165-179, 1954.
BAKER, R. J. Selection indices in plant breeding. Boca Raton: CRC, 1986. 218 p.
BARBOSA, M. H. P.; PINTO, C. A. B. P. Eficiência de índices de seleção na identificação de clones superiores de batata. Pesquisa Agropecuária Brasileira, Brasília, v. 32, p. 887-884, 1997.
CARVALHO, A.; MÔNACO, L. C.; FAZUOLI, L. C. Melhoramento do cafeeiro: XL estudos de híbridos de café Catuai. Bragantia, Campinas, v. 38, p. 202-216, 1979.
CARVALHO, A. M. et al. Avaliação de progênies de cafeeiros obtidas do cruzamento entre Catuaí e Híbrido de Timor. Scientia Agraria, Curitiba, v. 9, p. 249-253, 2008.
CARVALHO, G. R. et al. Seleção de progênies oriundas do cruzamento entre ‘Catuaí’ e ‘Mundo Novo’ em diferentes regiões do Estado de Minas Gerais. Bragantia, Campinas, v. 65, p. 583-590, 2006.
CORREA, L. V. T.; MENDES, A. N. G.; BARTHOLO, G. F. Comportamento de progênies de cafeeiros Icatu. Ciência e Agrotecnologia, Lavras, v. 30, p. 618-622, 2006.
COSTA, M. M. et al. Ganho genético por diferentes critérios de seleção em populações segregantes de soja. Pesquisa Agropecuária Brasileira, Brasília, v. 39, p. 1095-1102, 2004.
CRUZ, C. D. Programa Genes: biometria. Viçosa, MG: UFV, 2006. 382 p.
CRUZ, C. D.; REGAZZI, A. J.; CARNEIRO, P. C. S. Modelos biométricos aplicados ao melhoramento genético. 3. ed. Viçosa, MG: UFV, 2004. v. 1, 480 p. FERRÃO, R. G. et al. Parâmetros genéticos em café Conilon. Pesquisa Agropecuária Brasileira, Brasília, v. 43, p. 61-69, 2008.
FERREIRA, A. et al. Seleção simultânea de Coffea canephora por meio da combinação de análise de fatores e índices de seleção. Pesquisa Agropecuária Brasileira, Brasília, v. 40, p. 1189-1195, 2005.
GRANATE, M. J.; CRUZ, C. D.; PACHECO, C. A. P. Predição de ganho genético com diferentes índices de seleção no milho-pipoca CMS-43. Pesquisa Agropecuária Brasileira, Brasília, v. 37, p. 1001-1008, 2002.
HAZEL, L. N. The genetic basis for constructing selection indexes. Genetics, Austin, v. 28, p. 476-490, 1943.
MARTINS, I. S. et al. Eficiência da seleção univariada direta e indireta e de índices de seleção em Eucalyptus grandis. Revista Árvore, Viçosa, v. 27, p. 327-333, 2003.
MARTINS, I. S.; MARTINS, R. C. C.; PINHO, D. S. Alternativas de índices de seleção em uma população de Eucalyptus grandis Hill ex maiden. Cerne, Lavras, v. 12, p. 287-291, 2006.
MULAMBA, N. N.; MOCK, J. J. Improvement of yield potential of the Eto Blanco maize (Zea mays L.) population by breeding for plant traits. Egypt Journal of Genetics and Cytology, Cairo, v. 7, p. 40-51, 1978. PESEK, J.; BAKER, R. J. Desired improvement in relation to selection indices. Canadian Journal of Plant Sciences, Ottawa, v. 1, p. 215-274, 1969.
PETEK, M. R.; SERA, T.; FONSECA, I. C. B. Predição de valores genéticos aditivos na seleção visando obter cultivares de café mais resistentes à ferrugem. Bragantia, Campinas, v. 67, p. 133-140, 2008.
RANGEL, R. M. et al. Análise biométrica de ganhos por seleção em população de milho pipoca de quinto ciclo de seleção recorrente. Revista Ciência Agronômica, Fortaleza, v. 42, p. 473-481, 2011.
RESENDE, M. D. V. et al. Estimativas de parâmetros genéticos e predição de valores genotípicos no melhoramento do cafeeiro pelo procedimento REML/ BLUP. Bragantia, Campinas, v. 3, p. 185-193, 2001. SANTOS, F. S. et al. Predição de ganhos genéticos por índice de seleção na população de milho-pipoca UNB-2U sob seleção recorrente. Bragantia, Campinas, v. 66, p. 389-396, 2007.
SMITH, H. F. A discriminant function for plant selection. Annals of Eugenics, Norwich, v. 7, p. 240-250, 1936.
WILLIAMS, J. S. The evaluation of a selection index. Biometrics, Arlington, v. 18, p. 375-393, 1962.