ScienceDirect
Available online at www.sciencedirect.com
ScienceDirect
www.elsevier.com/locate/procedia Procedia Structural Integrity 5 (2017) 355–362
2452-3216 2017 The Authors. Published by Elsevier B.V.
Peer-review under responsibility of the Scientific Committee of ICSI 2017 10.1016/j.prostr.2017.07.182
ScienceDirect
Keywords: surface engineering; surface roughness; machining parameters; optimization; Taguchi method
* Corresponding author. Tel.: +0-351-273-303-081; fax: +0-351-273-313-051. E-mail address: jribeiro@ipb.pt
ScienceDirect
2nd International Conference on Structural Integrity, ICSI 2017, 4-7 September 2017, Funchal,
Madeira, Portugal
Optimization of machining parameters to improve the surface
quality
João Eduardo Ribeiro
a,b*, Manuel Braz César
a,c, Hernâni Lopes
daPolytehnic Institute of Bragança, ESTIG-IPB, Campus de Santa Apolónia, Bragança 5300-253, Portugal bINEGI - LOME, Campus da FEUP
– Rua Dr. Roberto Frias nº400, 4200-465 Porto, Portugal cCONSTRUCT-LESE, FEUP, Rua Dr. Roberto Frias, 4200-465 Porto, Portugal
dPolytechnic Institute of Porto, DEM/ISEP, R. Dr. António Bernardino de Almeida, 4200-072 Porto, Portugal
Abstract
The preparation of quality surfaces is very important process in the surface engineering. The surface roughness will influence the quality and effectiveness of the subsequent coatings for protection against corrosion, wear resistance and finishes quality of decorative layers. For these reasons, the authors of the present work have focused in manufacturing parameters that influence the surface quality of hardness metallic materials. In this work, the effects of varying four parameters in the milling process, namely cutting speed, feed rate, radial depth and axial depth. The influence of these parameters on the surface roughness are analyzed individually and also the interaction between some of them for the milling machining of hardened Steel (steel 1.2738), being used the Taguchi optimization method. For this purposed was built a L16 orthogonal array and for each parameter were defined two different levels, corresponding to sixteen experimental tests. From these tests were retrieved sixteen surface roughness measurements The influence of each parameter in surface roughness were then obtained by applying the analysis of variance (ANOVA) to experimental data. It is noted that the minimum roughness measured was 1.05µm. This study also serve to determined the contribution of each machining parameters and their interaction for surface roughness. The results show that the radial cutting depth and the interaction between the radial and axial depth of cut are the most revelevant parameters, being their contributions for the minimization surface roughness about 30% and 24%, respectively.
© 2017 The Authors. Published by Elsevier B.V. © 2017 The Authors. Published by Elsevier B.V.
1.Introduction
The roughness level on surface finishing has a crucial role in the efficiency and quality of subsequent surface coatings, Thomas (2014). From many processes used to prepare the surfaces, the machining is the most used and allow low levels of surface roughness, Benardos and Vosniakos (2003), which can reach values down-to 50 nm for optical applications, Guenther et al. (1984). The economic factors have a strong impact in today’s machining processes demanding a higher productivity, flexibility of the production systems, reduction of costs and obtaining manufactured parts with better surface and dimensional quality, Besseris (2008).
Most of the industries use different machining techniques, namely drilling, turning, milling, among others, as well as, the combination of these techniques. However, the efficiency is not the same for all machining techniques, i. e. to obtain the same part there is a more suitable machining technique that allows a better quality for the machining time and a lower power consumption. The best technique depends on the goal to be achieved. Today, the most widely used machining process in the industry is milling due to its high flexibility, especially if it is associated with the numerical control. Several studies focus have on the milling process to optimized the quality of the finishing surface and time production time Shivade (2014), Ghani (2004) and Zhang (2007). However, one issue that arises often is how these new technologies evolved in the industry. In this context, adequate planning of experiences is presented as one of the ways to achieve the competitiveness characteristics or critical factors. The use of the scientific method in the implementation of experimental projects is associated with the foundations of modern statistical, theoretical and experimental, which began in the 20th century and is largely due to Ronald Fisher (1925) and (1935). The first practical application of Design of Experiments (DOE) was in British Textile in 1930, Box (1978). From the relevant contributions of Fisher, many experimental designs were developed for the most varied situations, including in machining processes, Yih-Fong (2006) and Chang and Kuo (2007).
According to the machining goal and the choice of a cutting tool, there are different combinations of parameters, mainly cutting speed, feed rate, axial or radial cut depth, when combined can lead to a very distinctive results in terms of machined surface quality and tool wear. However, it is very difficult to define the best combination that provides a lower roughness value and, at same time, maximizing the tool life. In addition, it is essential to reduce costs without reducing the quality of results. The quality of the machined surface is normally evaluated by measuring surface roughness, which is a fundamental characteristic of the surface quality. Typically, the surface roughness is obtained experimentally, being also possible, according to some researchers, be predicted by means of mathematical algorithms, Suresh et al. (2003), Sing and Rao (2007), although, these studies are very consuming process and expensive. To obtain the best combination of parameters it is necessary to test a large number of combinations, which is impractical for the industry. Optimization techniques are an interesting solution to minimize the number of combinations of experimental tests.
In the last decades, many optimization techniques have been developed for machining, Aggarwal and Singh (2005), being the most used fuzzy logic, Palanikumar et al. (2006), genetic algorithms, Wang and Jawahi (2004), Taguchi method, Yang and Tarng (1998), grey relational analysis, Tzenga et al. (2009), and the surface response method Myers and Montgomery (1995). In this work was implemented the Taguchi method for the minimization of surface roughness in milling operation.
The Taguchi method, Ross (1996), is based on the statistical design of experimental tests that can economically satisfy the process for optimizing the manufacture of a part. One of the advantages of this method is that several factors are considered at once, including the noise factors. This method is a powerful tool, but needs to be combined with other statistical tools, such as analysis of variance (ANOVA), principal component analysis (PCA), Moshat et al.
(2010) or relational analysis, Lin (2004) to extend the results of the Taguchi.
2.Experimental Procedures
2.1.Experimental Design
These experimental tests have the objective of minimizing the surface roughness according to the specifications of the milling tools. The characteristic of surface roughness quality is one of the most important properties in the machining processes. The goal of this work is to determine the optimum combination of parameters that leads to the minimum surface roughness for the milling machining of a hardened Steel (steel 1.2738).
The signal-to-noise (S/Ns) ratio used in the surface roughness test is the lowest, since we want to minimized the level of roughness. Also, the aim is to improve the surface finishing by measuring the roughness.
The cutting speed (Vs), feed rate (Fz), radial depth (ap) and axial depth (ae) are the most common parameters in the machining processes. The chosen levels in this work are in the range of the ones defined by the tool manufacturer, Palbit®. The cutting speed is defined as 200-300 [mm/min], feed rate in the range 0.10-0.30 [mm/t], radial cutting depth in the of 1-2 [mm], and finally, the axial cutting depth between 0.10-0.35 [mm]. The four cutting parameters selected for this study are presented in Table 1.
Table 1. Levels of cutting parameters.
Parameters Level 1 Level 2
A - Cutting speed [mm/min] 200 300
B - Feed rate [mm/t] 0.10 0.30
C - Axial depth [mm] 0.10 0.35
D - Radial depth [mm] 1.0 2.0
Table 2. Taguchi L16 array.
Test Number A B C D
1 1 1 1 1
2 1 1 1 2
3 1 1 2 1
4 1 1 2 2
5 1 2 1 1
6 1 2 1 2
7 1 2 2 1
8 1 2 2 2
9 2 1 1 1
10 2 1 1 2
11 2 1 2 1
12 2 1 2 2
13 2 2 1 1
14 2 2 1 2
15 2 2 2 1
16 2 2 2 1
In a first stage of the work, it is intended to perform the sixteen experimental tests and verify which is the one presents the lowest value of the roughness. Once the roughness values have been determined, a combination of the four parameters can be chosen in which, for the tool and machine tool under study, leads to a less roughness.
2.2.Experimental Tests
The experimental tests were performed by milling machining operation around a cylindrical part. In the case of the Taguchi method were conducted according to the values of the parameters defined by the orthogonal array of Taguchi, L16 defined in Table 2.
The milling machining operations were made on steel for moulds (GMTC 1.2738) with 219 mm in diameter and 40 mm in height, presenting a hardness of 45 Rockwell C. The roughness was measured using the Mitutoyo SJ-301 Portable Surface Roughness Tester at three different locations with constant angle variation of 120°, as shown in Fig. 1a). This have the objective of minimizing error of the surface roughness measurement. In the present study, was used the arithmetic mean roughness (Ra), since is one of the most widespread amplitude parameter employed in industry.
For each location, five measurements were taken and the lowest and the highest roughness value were ignored. The sixteen tests were performed on the CNC, Deckel Maho DMC 63V. The inserts used for the milling cutter were WNHU 04T310, manufactured by Palbit®. Milling operations were performed using a circular trajectory
clockwise around the perimeter of the work-piece block.
To measure the roughness profile, the sensor was connected with the aid of a heavy steel block as a support, avoiding human interference as shown in Fig. 1b).
Fig. 1. (a) Details of roughness measurement points on the steel block; (b) Roughness measurement set-up.
3.Results and Discussion
The following sections present the arithmetic mean roughness (Ra) measured in the sixteen tests for the three
different locations and statistical analysis of these results.
3.1.Results
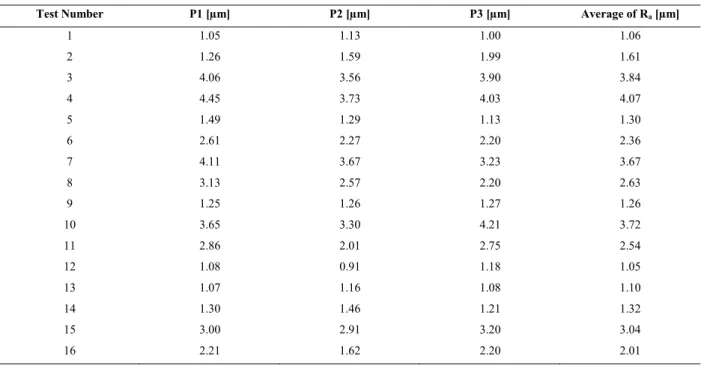
The surface roughness Ra measured at each point (P1, P2 and P3) and their average values are presented in Table
3, being these arranged according the Taguchi array (Table 2).
The mean roughness of the sixteen tests obtained by the Taguchi method is Ra=2.29 μm. The test with the least
roughness is the twelfth with the value of Ra=1.05 µm, followed by first test with a value of Ra=1.06 µm. However,
the test with higher value of roughness was the fourth being Ra=4.07 µm.
Table 3. Experimental results of Ra measurements for the sixteen tests.
Test Number P1 [µm] P2 [µm] P3 [µm] Average of Ra [µm]
1 1.05 1.13 1.00 1.06
2 1.26 1.59 1.99 1.61
3 4.06 3.56 3.90 3.84
4 4.45 3.73 4.03 4.07
5 1.49 1.29 1.13 1.30
6 2.61 2.27 2.20 2.36
7 4.11 3.67 3.23 3.67
8 3.13 2.57 2.20 2.63
9 1.25 1.26 1.27 1.26
10 3.65 3.30 4.21 3.72
11 2.86 2.01 2.75 2.54
12 1.08 0.91 1.18 1.05
13 1.07 1.16 1.08 1.10
14 1.30 1.46 1.21 1.32
15 3.00 2.91 3.20 3.04
16 2.21 1.62 2.20 2.01
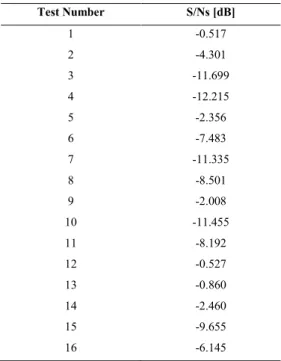
3.2.Signal-to-noise ratio
In the machining process one of the most important goal is to minimize the roughness of the finishes surface. For this purpose, the most appropriate control factor is the smallest S/Ns ratio that can be defined by equation 1.
n
i i S
y
n
N
S
1 2
1
log
10
(1)where n is the number of samples and y is the observed data.
According to Taguchi method, the S/Ns ratios were determined for the sixteen tests, being now presented in Table 4.
Table 4. Average roughness value and S / Ns ratio.
Test Number S/Ns [dB]
1 -0.517
2 -4.301
3 -11.699
4 -12.215
5 -2.356
6 -7.483
7 -11.335
8 -8.501
9 -2.008
10 -11.455
11 -8.192
12 -0.527
13 -0.860
14 -2.460
15 -9.655
16 -6.145
3.3.ANOVA analysis
The purpose of the analysis of variance is to determine which design parameters presents the highest influence surface roughness. The results of variance for the degrees of freedom (Df), sum of squares (Sq), the mean of squares (Md) and their interactions are shown in table 5. Where Md parameter is obtained by dividing the sum of squares by the corresponding degrees of freedom.
Table 5. Results of ANOVA for surface roughness.
Group Df Sq Md F Value Contribution [%]
A 1 18.287 18.287 1.27 6.4
B 1 0.281 0.281 0.02 0.1
C 1 84.772 84.772 5.9 29.6
D 1 2.612 2.612 0.18 0.9
AxB 1 1.002 1.002 0.07 0.4
AxC 1 28.505 28.505 1.99 10.0
AxD 1 2.822 2.822 0.2 1.0
BxC 1 4.124 4.124 0.29 1.4
BxD 1 2.029 2.029 0.14 0.7
CxD 1 69.938 69.938 4.87 24.4
Residual 5 71.800 14.36 25.1
Total 15 286.171 286.171 100.0
greater than four, means that the variation of the breeding or cutting parameter has a significant impact on the roughness.
In this study, the contribution of each of the machining parameters and their interaction was determined. The analysis of the F-ratio values reveals that the most important factors are radial cutting depth and the interaction between radial cutting depth and axial cutting depth result on the minimization surface roughness. These have contributions of about 30% and 24%, Table 5.
The optimum cutting parameters for surface roughness are the level 2 (300 mm/min) cutting speed, the feed rate level 2 (0.3 mm/t), the level 1 (0.1 mm) axial cutting depth and the level 1(1.0 mm) radial cutting depth.
4. Conclusions
The Taguchi method proved to be quite robust and allowed in this study to determine the contribution of each of the machining parameters and their interaction. Through the analysis of the values it is shown that the most important factors are radial cutting depth and the interaction between radial cutting depth and axial cutting depth, leading to the minimization of surface roughness, being their contributions of about 30% and 24%, respectively.
For an optimum surface roughness, the results of the Taguchi method and the ANOVA analysis lead to the combination of a cutting speed of 300mm / min, feed rate of 0.30mm / t, axial depth 0.1mm and radial depth 1mm, which corresponds to the Ra=1.10 µm.
References
Aggarwal, A., Singh, H., 2005. Optimization of machining techniques – A retrospective and literature review. Sadhana 30, 699-711.
Benardos, P., Vosniakos, G., 2003. Predicting surface roughness in machining: a review. International Journal of Machine Tools and Manufacture 43, 833–844.
Besseris, G., 2008. Product Screening to Multicustomer Preferences: Multiresponse Unreplicated Nested Super-ranking. International Journal of Quality, Statistics, and Reliability 2008, 1-16.
Box, G., Hunter, W., Hunter, J., 1978. Statistics for Experimenters. John Wiley & Sons, 1st edition, New York.
Chang, C., Kuo, C., 2007. Evaluation of surface roughness in laser-assisted machining of aluminum oxide ceramics with Taguchi method. International Journal of Machine Tools & Manufacture 47, 141–147.
Fisher, R., 1925. Statistical Methods For Research Workers, Cosmo Publications, London. Fisher, R., 1935. The design of experiments, Oliver and Boyd Publications, Edinburgh.
Ghani, J., Choudhury, I., Hassan, H., 2004. Application of Taguchi method in the optimization of end milling parameters. Journal of materials processing technology 145, 84-92.
Guenther, K., Wierer, P., Bennett, J., 1984. Surface roughness measurements of low-scatter mirrors and roughness standards. Applied Optics 23, 3820–3836.
Hasçahk, A., Çaydas, U., 2008. Optimization of turning parameters for surface roughness and tool life based on the Taguchi method. International Journal of Advanced Manufacturing Technology 38, 896-903.
Lin, C., 2004. Use of the Taguchi Method and Grey Relational Analysis to Optimize Turning Operations with Multiple Performance Characteristics. Materials and Manufacturing Processes 19, 209-220.
Moshat, S., Datta, S., Bandyopadhyay, A., Pal, P., 2010. Optimization of CNC end milling process parameters using PCA-based Taguchi method. International journal of engineering, science and technology 2, 92-102.
Myers, R., Montgomery, D., 1995. Response Surface Methodology: Process and Product Optimization Using Design of Experiments. Wiley – Interscience. New York.
Nalbant, M., Gökkaya, H., Sur, G., 2007. Application of Taguchi method in the optimization of cutting parameters for surface roughness in turning. Materials and Design 28, 1379-1385.
Palanikumar, K., Karunamoorthy, L., Karthikeyan. R., Latha B., 2006. Optimization of machining parameters in turning GFRP composites using a carbide (K10) tool based on the taguchi method with fuzzy logics. Metals and Materials International 12, 483-491.
Ribeiro, J., Lopes, H., Queijo, L., Figueiredo, D., 2017. Optimization of Cutting Parameters to Minimize the Surface Roughness in the End Milling Process Using the Taguchi Method. Periodica Polytechnica Mechanical Engineering 61, 30-35.
Ross, P., 1996. Taguchi techniques for quality engineering. Edited by McGraw-Hill, 2nd Edition, New York.
Shivade, A., Bhagat, S., Jagdale, S., Nikam, A., Londhe, P., 2014. Optimization of Machining Parameters forTurning using Taguchi Approach. International journal of recent technology and engineering 3, 145-149.
Suresh, P., Rao, P., Deshmukh, S., 2002. A genetic algorithmic approach for optimization of surface roughness prediction model. International Journal of Machine Tools and Manufacture 42, 675-680.
Thomas, T., 2014. Roughness and function. Surface Topography: Metrology and Properties 2, 014001.
Tzenga, C-J., Lin, Y-H., Yang, Y-K., Jeng, M-C., 2009. Optimization of turning operations with multiple performance characteristics using the Taguchi method and Grey relational analysis. Journal of Materials Processing Technology 209, 2753–2759.
Wang, X., Jawahi, I., 2004. Web-based optimization of milling operations for the selection of cutting conditions using genetic algorithms. Proceedings of the Institution of Mechanical Engineers, Part B: Journal of Engineering Manufacture 218, 647-655.
Yih-Fong, T., 2006. Parameter design optimization of computerized numerical control turning tool steels for high dimensional precision and accuracy. Materials and Design 27, 665–675.