ABSTRACT: Composite materials are vastly employed in rocket nozzle extensions and as thermal protection shields in aerospace industry. In both cases, ablative and thermal properties play an important role for material choice and equipment sizing. These properties are strongly dependent on the way the pieces are manufactured. For the case of nozzle extensions, wrapping is the most common technique employed, which can be done by diverse ways. In this work, samples of the carbon reinforced carbon iber (CRCF) were extracted from pre-forms obtained by biased and parallel tape wrapping processes with a resol-type phenolic resin used as polymer matrix, in order to study the inluence of the iber angle in the ablative behavior and thermal conductivity. Experimental results for both manufacturing techniques were obtained through ablation tests carried out in a plasma torch, were compared and had the different behaviors discussed. A computational simulation based in a two-front ablation model was also performed, in order to explain the inluence of thermal conductivity on the different behaviors presented for biased iber samples. Results show that the angle of the ibers relative to the heat lux direction is an important parameter to determine the ablative properties and the thermal performance of composite wrapped structures.
KEYWORDS: Ablation, Carbon-phenolic, Plasma torch, Computational simulation.
Effect of the Fiber Orientation Relatively to
the Plasma Flow Direction in the Ablation
Process of a Carbon-Phenolic Composite
Sônia Fonseca Costa e Silva1, Humberto Araújo Machado1,2, Edison Bittencourt3INTRODUCTION
The thermal resistance and ablation characteristics of composite materials are properties which play a very important role in the ield of aerospace technology. When composite materials with excellent characteristics are exposed to extremely high temperatures, above 1,500°C, not only their surface and structure but also their intrinsic features can be protected from the decomposition, which can occur at these temperatures. he ablation of a material depends on its intrinsic conditions and also on extrinsic conditions such as thermal, chemical and mechanical factors according to the variables of theoretical or practical environments (Schmidt, 1971). Ablation is an endothermic and erosive process which involves complex physical and chemical reactions.
here are several types of materials used in these ablative thermal protection systems, as each material presents certain advantages and disadvantages in terms of its properties (speciic mass, mechanical strength, melting temperature etc.) and environmental conditions that they are subjected to (heat low, temperature, mechanical stress etc.).
Carbon-based materials have been considered to be promising candidate for severe environments with super high temperature and high pressure for their high temperature capability (over 2,000°C), high thermal shock resistance, good ablation resistance and low density (Kanevceet al., 1999).
Phenolic resin reinforced with carbon fabric has been a popular ablative material for rocket nozzles. Phenolic resin is the preferred matrix material due to its ability to eiciently
1.Instituto de Aeronáutica e Espaço – São José dos Campos/SP – Brazil 2.Universidade Estadual do Rio de Janeiro – Resende/RJ – Brazil 3.Universidade Estadual de Campinas – Campinas/SP – Brazil.
Author for correspondence:Sonia Fonseca Costa e Silva | Instituto de Aeronáutica e Espaço | Praça Marechal Eduardo Gomes, 50 – Vila das Acácias | CEP: 12.228-904 São José dos Campos/SP – Brazil | Email: [email protected]
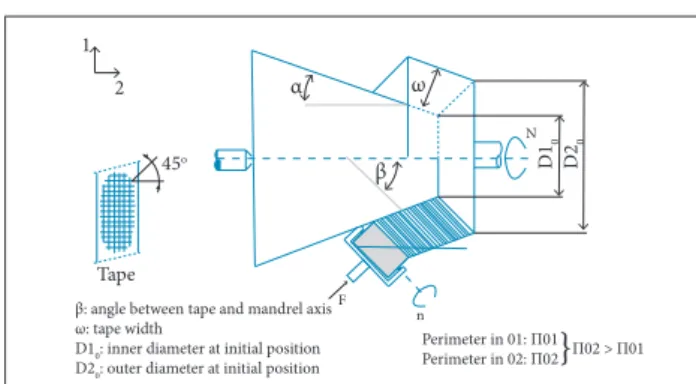
Figure 1. Scheme of a typical tape wrapping equipment.
Figure 3. Biased wrapping on conical mandrel.
Figure 2. Parallel wrapping on conical mandrel.
Break
Warming (hot air breathing)
Mandrel rotation
Cooling
Tape 1
2
F
α n
N
N: mandrel rotation n: roll rotation F: compression force α: mandrel slope
Tape 1
2
45o
ω
β
n F
N α
D1
0
D2
0
β: angle between tape and mandrel axis ω: tape width
D10: inner diameter at initial position D20: outer diameter at initial position
Perimeter in 01: П01 Perimeter in 02: П02}П02 > П01 form char during endothermic pyrolysis (Ticket al., 1965).
Carbon-fabric is preferred as reinforcement due to its ability to resist high-temperature erosive aerodynamic shear forces because of its high thermal stability, low thermal conductivity and higher inter-laminar shear strength (ILSS) in the composite form (Savage, 1993). However, there is always an urge to improve the ablation resistance of carbon-phenolic composites to further realize relatively thinner ablative composite structures to reduce the overall weight of aerospace systems.
Carbon iber reinforced phenolic matrix composites (FRFC) have been used in the aerospace industry for the thermal-structural components. hese materials can support aggressive thermal environments, such as in rocket nozzles throats, where a large amount of hot gases, due to the burning of propellant, pass through. hese rocket nozzle extensions must submit, when in operation, low wear ablation on the inner walls. Furthermore, the wear should occur fairly homogeneous, i.e. distributed over the entire inner surface of the structure that has direct contact with the exhaust gases.
he carbon-phenolic ablative behavior should be inluenced by the manufacturing process. he carbon-phenolic nozzle are commonly produced by a wrapping process, which consists in wrapping the carbon iber tissue around a conic or bell shaped guide, in order to obtain the nozzle proile. he winding process with woven tape (“tape wrapping”) basically consists on wrapping a tape over a steel mandrel. hese strips are obtained by cutting fabric-based glass pre-impregnated with phenolic resin iber, sil-ica or carbon (Clements and Ward, 1966). he winding system is equipped with a compactor roller with pneumatic actuation, which compresses the “prepreg” tape as it is being deposited on the mandrel, as shown in Fig. 1.
tapes used typically have iber oriented towards 0° and 90° in a balanced manner, i.e. with an equal amount of ilaments per unit length in the warp direction (the longitudinal direction of the fabric) and wet (transverse direction of the fabric), compared to the same principal directions (Clements and Ward, 1966). There is no pattern of weaving preferred for the tapes to be wounded in parallel. Figure 2 shows a plan view of the winding parallel deposition system showing the movement of the equipment’s axes operating on a mandrel in the shape of a truncated cone.
• Biased wrapping: consists on wrapping the tapes in an angle (b) relative to the main axis of the winding mandrel direction (Clements and Ward, 1966). Compared to the parallel winding, this technique presents major practical diiculties. Most of the technological problems of this type of process arise from the fact that a single tape, at one point, has to go through diferent perimeters along the width, as evidenced in Fig. 3. For this to be possible in practice, the tapes to be used should allow a certain relative movement between the various fibers that constitute them. he ibers in this case should be directed to ± 45° regarding the same principal directions and, as in the previous case, these ibers should be distributed
he tape wrapping technique can be divided into: • Parallel wrapping:consists on wrapping the tapes in
Lateral sample
Top sample α = 22o
α = 22o;β = 20o
90o - (α + β)
α
α
90o - α
90o - α
90o - α
Biased sample
β
in a balanced way in the wet (direction 2) and warp directions (direction 1).
For optimum levels of quality and performance of ablation be achieved, it is necessary that the polymerization of the composite be carried out under high pressure. For the polymerization of ablative high-performance composites, such as those proposed for the structure of the divergent nozzle and components, it is strongly recommended that more specialized equipment be used like hydroclaves, where the pressurizing medium is water in its liquid state (Clements and Ward, 1966).
In this paper, thermal degradation experiments were carried out using high low of plasma jet (Fujimoto et al., 2003), in order to simulate the warmed gas low through a rocket nozzle engine. he experimental results were obtained for three dif-ferent angles of carbon iber in test samples. A computational simulation is also performed, in order to compare the accuracy between the theoretical model for composite ablation and the empirical data.
EXPERIMENTAL PROCEDURE
MATERIALS
The carbon iber used in the present work is T22R-ECHO with thickness of 0.45 mm, weave pattern 2 x 2 Twill, areal weight of 350 ± 35 g/m2and density of 1.55 g/cm3. A phenolic
resin resol-type matrix with viscosity of 1,000 cPs at 20°C has been used. The “prepreg” process was carried out in the Plastlow company facilities. After wetting, the iber volume reached 55 – 60%.
The inclined and parallel wrapping process was performed on a property equipment of the Instituto de Aeronáutica e Espaço (IAE) of the Departamento de Ciência e Tecnologia Aeroespacial (DCTA), The polymerization cycle was carried out in an hydroclave at high pressure, which gives the perfect polymerization of the phenolic resin used and an ablative structure with high compaction and low void content (porosity). The cycle used for polymerization (curing) was: 1 h at 100°C and 3 h at 165°C with a pressure of 7.0 MPa.
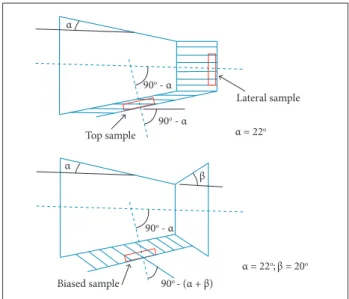
After the wrapping and curing process, the samples were extracted in different positions, according to the manufacturing process. Both the position of extraction and the wrapping pro-cess play important roles in the thermal properties and ablative behavior of the composite, since they directly affect the iber orientation in the sample (Fig. 4), where, for parallel wrapping, a = 22° and, for biased wrapping, b = 20°.
ABLATION TEST
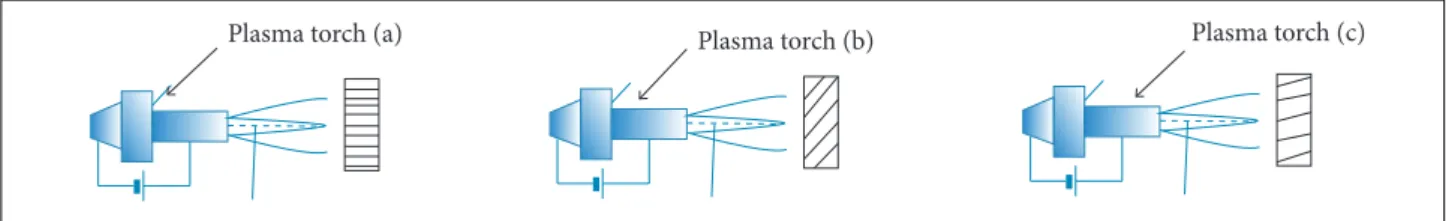
A plasma torch test was performed to investigate the ablation property of carbon-phenolic composites. he operation was carried out in atmospheric pressure. A direct current (DC) arc plasma system was designed for continuous working at a power up to 50 KW. he intensity of current was adjusted to 135 A with ten-sion of 300 V. So that, the maximum achievable power obtained, due the power supply, is about 30 KW, which gives a plasma enthalpy of about 5.5 MJ/kg. he gas low was maintained at 4.5 x 10⁻³ kg/s. he specimen was placed vertically to the lame direction in air. hree iber orientations were assessed in rela-tion to exposure to plasma jet: parallel ibers to the plasma low (parallel wrapping - lateral sample - 0°); ibers at an angle of 68° in relation to the plasma low (parallel wrapping - top sample); and ibers at an angle of 48° in relation to the plasma low (biased sample), as shown in Fig. 5.
he ablation test was carried out in a time from 30 to 120 s
and the distance between the nozzle tip of the plasma gun and the front surface of the specimen varied from 4 to 10 cm. he surface of the samples reached temperatures in the range from 1,200 to 1,900K and it was measured by an optical pyrometer Mod. IR-AH 3SU Chino. Figure 6 shows the schematic illustration of the apparatus utilized for ablation test using an arc plasma torch.
he burn-through time was measured. he erosion rate was calculated by dividing the mass change before and ater the test into a burn-through time for each specimen. One representative sample was used for each condition of testing. he specimens were cut in samples with diameter of 1.2 cm.
• Air is considered a perfect gas.
• Radiation is absorbed or emitted by the external surface, but is not transmitted.
he moving boundary problem was solved by the interface tracking method, introduced by Unverdi and Tryggvason (1992) and employed by Juric (1996) in the solution of phase-change problems. In this method, a ixed uniform Eulerian grid is gen-erated, where the conservation laws are applied over the complete domain. he interface acts as a Lagrangian referential, where a moving grid is applied. he instantaneous placement of the interface occurs through the constant remeshing of the moving grid, and each region of the domain is characterized by the indicator func-tion, which identiies the properties of the wall and the air around it. he method can be extended for various interfaces, through the use of one particular indicator function for every phase within the domain of simulation (Machado, 2013). his method allows the representation of any geometry and also the characterization of every layer separately. It is accomplished without a high increase in the computational cost and does not need any pre-processing (construction of unstructured grid or coordinate transformation). In this work, this method is employed to estimate the ablative per-formance of the carbon-phenolic composite, considering a two-di-mensional approach in both the heat conduction and the moving boundary problem. Both the set of equations and the numerical solution are described in detail in the work of Machado (2014).
RESULTS
he specimens submitted to ablation test were extracted to pre-form obtained by biased and parallel wrapping using a hole saw to remove small cylinders with a diameter of 12.5 mm. Ater cutting, each sample was identiied and weighed on a precision balance (± 0.0001 g). A reweighing of the specimens was also taken ater exposure to heat low, to determine the rate of mass removed per unit of area and time of exposure to the plasma jet (kg/m2s) and to estimate the experimental
Figure 5. Orientation of the ibers in relation to the plasma low: (a) parallel wrapping (lateral sample cut) - 0°, (b) parallel wrapping (top sample cut) - 68°, (c) biased wrapping (biased sample cut) - 48°.
Figure 6. Scheme of an apparatus for ablation test using arc plasma torch.
COMPUTATIONAL SIMULATION
A computational code was employed to simulate a one-dimensional ablation process, alike that conducted experimentally, where material samples were exposed to a plasma jet and had their temperature and heat lux measured. In this study, the target was not a perfect match between experimental and theoretical data but the qualitative behavior of the physical approach, in order to verify its coherence between the experimental and numerical results.
The ablation model proposed (Machado, 2014) for a
composite material will consider the presence of two layers: the virgin material and the char layer that appears ater the pyrolysis front. Two moving fronts will be accounted: the pyrolysis and the ablation front of the char layer. Both will appear at constant and speciic temperatures. he hypotheses considered to build the mathematical model are:
• Solid materials are isotropic with constant properties. • he pyrolysis front is considered to have zero thickness. • Char layer recession is supposed to occur due oxidation
or sublimation at constant temperature. • Melting layer is absent.
• he resulting gases fully react and perfectly mix with the external air layer, without inluence over its properties.
Plasma torch (a) Plasma torch (b) Plasma torch (c)
Optical pyrometer
Plasma jet Target material
Sample holder
Jet core Plasma torch
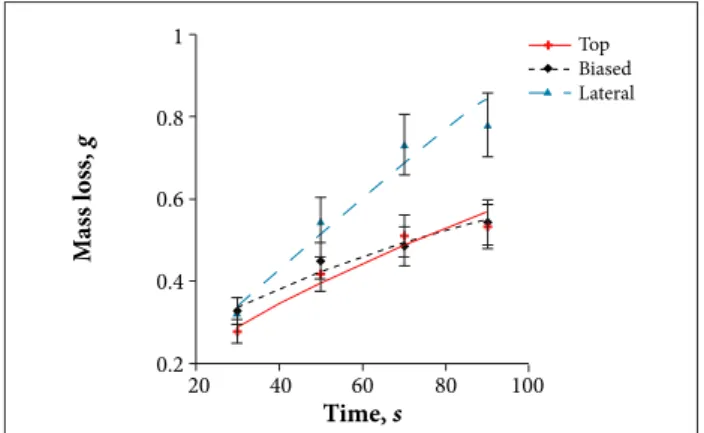
Figure 9. Variation of mass loss over time for a heat lux of 1.376 MW/m2.
Figure 11. Results of the variation of total mass low in the heat exposure time of 70 s.
Figure 8. Variation of mass loss over time for a heat lux of 0.903 MW/m2.
Figure 10. Results of the variation of total mass low in the heat exposure time of 50 s.
Figure 7. Variation of mass loss over time for a heat lux of 0.626 MW/m2.
0.2
20 40 60 80 100
0.4 0.6 0.8 1
M
ass l
oss,
g
Time, s
Top Biased Lateral
0.2
20 40 60 80 100
0.4 0.6 0.8 1
M
ass l
oss,
g
Time (s)
Top Biased Lateral
0.2
20 40 60 80 100
0.4 0.6 1.0
0.8 1.2
M
ass l
oss,
g
Time (s)
Top Biased Lateral
0.2
0.6 0.8 1.0 1.2 1.4
0.4 0.5 0.6 0.8
0.7 0.9
M
ass l
oss,
g
Heat flux (MW/m2)
Top Biased Lateral
0.4
0.6 0.8 1.0 1.2 1.4
0.6 0.8 1.0 1.2
M
ass l
oss,
g
Heat flux (MW/m2)
Top Biased Lateral mass loss rate. According to the results, the mass loss of the
samples increases with time of exposure to the plasma jet in both manufacturing processes, biased and parallel wrapping (side section and top cut), as shown in Figs. 7, 8 and 9. he samples obtained by parallel wrapping with the side cut exposure had higher removing mass in relation to exposed samples cut from
the top and samples obtained by biased wrapping, due to the orientation of the ibers.
If the ibers are oriented parallel to the plasma low, high mechanical strength enhancement of the orientation plane is produced and a minimum internal heat conduction is also achieved because heat transfer occurs almost completely through the resin and, with strict packaging of the ibers, it becomes more difficult. The resulting effect is a high non-uniform ablation and the tendency to mechanical erosion is increased by gases formed in the substrate material, which are trapped by closely packed ibers and yield pressure rising, resulting in a crack in the material. We observed that the mass loss is lower in the samples with a certain angle relative to the plasma low (Figs. 10 and 11).
continuous iber supported by the phenolic resin, since it is not easily removed by the high-velocity gas low, causing the material to be capable of presenting greater resistance to mechanical erosion. his erosion resistance regularly decreases as the ibers approach the parallel orientation. here are also basic limitations for this type of orientation. he mechanical properties are relatively low at the plane perpendicular to the ibers; this leads to occasional material removal and failure by stress during ablation. With the ibers in this orientation, the heat transfer rate of the substrate material can be appreciably higher because they provide a direct drive line to the inside, increasing the thickness of the material required to produce the desired insulation.
he mass loss rate was the parameter chosen in order to compare the experimental data and numerical results. he rate was obtained dividing the mass loss by the time of exposure. he same procedure was employed to obtain the mean mass loss rate in the simulations. However, the calculation of the mass loss rate is done instantaneously through the integration at each time step, while the experimental method shows the inal result ater the selected period.
he properties used in the simulation are presented in Table 1 (Machado, 2013). Although some of the thermophysical prop-erties of the ablativematerials were measured during the exper-iments, most of them had to be extracted from diverse literature
sources. The values for thermal conductivity depend on the iber orientation. he higher value (11 W/m2°C) is considered when the fiber is normal to the surface were the heat flux is imposed (parallel to the heat lux direction) and the lower value (0.8 W/m2°C) is considered when the fibers lie parallel to the surface and normal to the heat lux direction. Both cases were considered for the numerical simulation.
he one-dimensional heat conduction problem was solved considering prescribed heat flux in the warmed face and adiabatic surface in the opposite side, as boundary conditions. he initial temperature was 27°C (300 K). he same heat luxes measured in the samples — 0.464 MW/m2, 0.626 MW/m2, 0.903 MW/m2, 1.376 MW/m2 and 1.725 MW/m2 — were imposed to the warmed face.
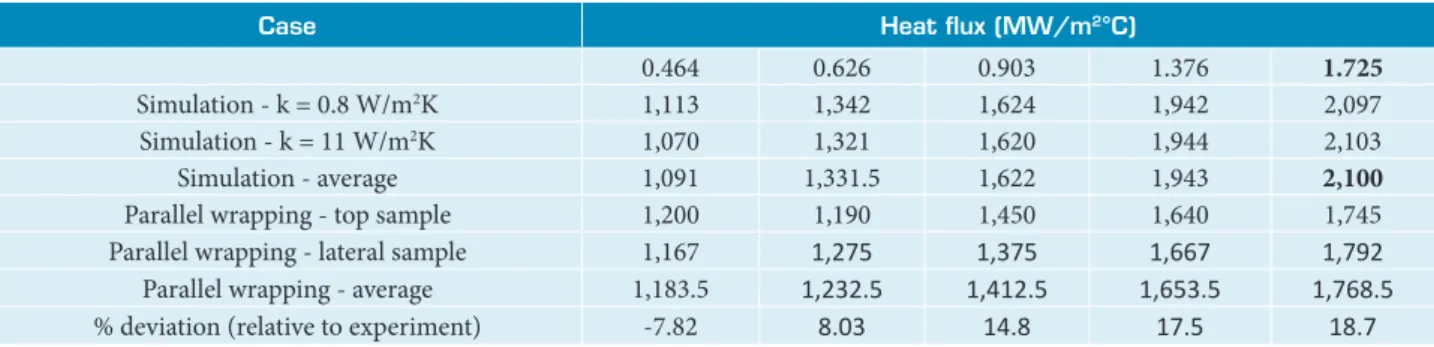
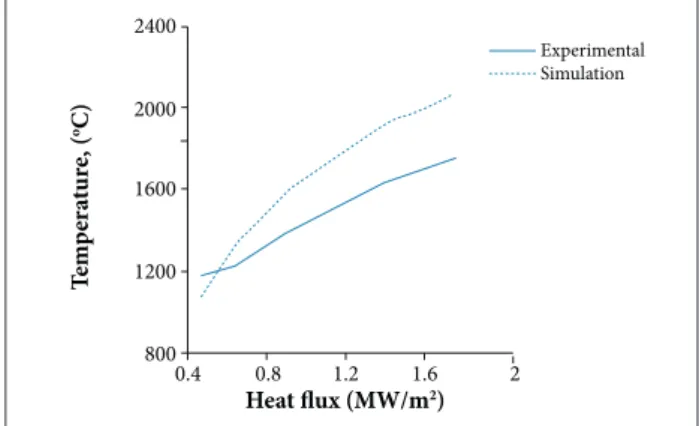
Table 2 shows the temperature of sample’s surface in the side were the plasma jet was impinged (for the experiment) andthe heat lux was imposed (simulation). Deviation of the numerical results relative to the average experimental data rises from -7.82 to 18.7%. Even considering the uncertainty of the experimental results, the simple approach used in the mathematical model (that neglects the inluence of various physical processes) and the values of the properties used in the calculation (which were extracted from diverse sources and consequently are subjected to diferent conditions of evaluation) are considered to present physical coherence and both curves, numerical and experimental, have a similar behavior, as shown in Fig. 12.
Figures 13, 14 and 15 show the comparison among the experimental results of all samples for each value of thermal conductivity used in the computational simulation and the mass loss rate with the time. he experimental results present the points resulting of measurements and the respective itting curves, according to the slope of the iber. In all cases, the mass loss rate seems to be underestimated by numerical simulation. he numerical results show little inluence of thermal conductivity variation. he results for both values used (0.8 to 11 W/m2°C)
are relatively close. In Fig. 13, the sample curves obtained by
Table 1. Properties of the carbon-phenolic resin.
1Barros (2008); 2Sutton (1970); 3Savvatimskii (2003); 4Khlybov and Makhankov (2008); 5Russel (1996); 6Tick et al. (1965); Khlybov and Makhankov (2008).
Property Virgin Char
k (W/moC) 0.8–111 1.732 Cp (J/kgoC) 1,3001 1,8003
r(kg/m3) 1,7001 1,1843
e 0.924 0.73
Heat of pyrolysis (MJ/kg) 2.335 Pyrolysis temperature (oC) 3506
Heat of melting/sublimation (MJ/kg) 10.53 Melting temperature (oC) 3,7003
Case Heat lux (MW/m2°C)
0.464 0.626 0.903 1.376 1.725
Simulation - k = 0.8 W/m2K 1,113 1,342 1,624 1,942 2,097
Simulation - k = 11 W/m2K 1,070 1,321 1,620 1,944 2,103
Simulation - average 1,091 1,331.5 1,622 1,943 2,100
Parallel wrapping - top sample 1,200 1,190 1,450 1,640 1,745
Parallel wrapping - lateral sample 1,167 1,275 1,375 1,667 1,792
Parallel wrapping - average 1,183.5 1,232.5 1,412.5 1,653.5 1,768.5
% deviation (relative to experiment) -7.82 8.03 14.8 17.5 18.7
Figure 13. Mass loss rate with time: simulation and experimental results for q = 0.626 MW/m2.
Figure 15. Mass loss rate with time: simulation and experimental results for q = 1.376 MW/m2.
Figure 12. Temperature at t = 90 s in the sample’s warmed surface, according to heat lux.
Figure 14. Mass loss rate with time: simulation and experimental results for q = 0.903 MW/m2.
800
0.4 0.8 1.2 1.6 2
1200 1600 2000 2400
T
emp
er
at
u
re
, (
oC)
Heat flux (MW/m2)
Experimental Simulation
0.02
20 40 60 80 100
0.04 0.06 0.08 0.12
0.1 0.14
M
ass l
oss r
at
e (kg/m
2s)
Time (s)
Simulation – k = 0.8 W/m2K Simulation – k = 0.8 W/m2K Biased wrapping
Parallel wrapping – lateral sample Parallel wrapping – top sample
0.04
20 40 60 80 100
0.08 0.12 0.16
M
ass l
oss r
at
e (kg/m
2s)
Time (s)
Simulation – k = 0.8 W/m2K
Simulation – k = 11 W/m2K
Biased wrapping
Parallel wrapping – lateral sample Parallel wrapping – top sample q = 0.903 MW/m2
0.04
20 40 60 80 100
0.08 0.12 0.16 0.2
M
ass l
oss r
at
e (kg/m
2s)
Time (s)
Simulation – k = 0.8 W/m2K Simulation – k = 11 W/m2K Biased wrapping
Parallel wrapping – lateral sample Parallel wrapping – top sample q = 1.376 MW/m2
parallel wrapping (lateral and top sample) and biased wrapping produce the same slope compared with the numerical simulation, without crossing at any point. he crossing between the curves appears in all cases for numerical simulation, but only in the two last cases for the experimental results (Figs. 14 and 15). Although the irst case does not present such crossing, these curves feature similar behavior of their numerical counterparts. In all cases, the lateral sample curves present a level of mass loss rate above the two other samples. It indicates that the inluence of the iber orientation and the thermal conductivity variation afects the ablation process.
When the ibers are disposed normally to the heat lux, conduction occurs mainly through the resin, and the result is a high and non-uniform ablation as described for each value of heat lux observed for the samples obtained by biased and top cut parallel wrapping. The samples where ibers are perpendicular or biased to the direction of gas low provide greater resistance to cutting gas effort and minimize the mechanical erosion of the surface, reducing the ablation rate, as shown in Figs. 13,
14 and 15, which is conirmed by the proximity of both curves in all results.
The discrepancy between the experimental and numerical temperatures and mass loss rates can be the result of other processes. The catalycity (Carleton and Marinelli, 1992; Kovalev and Kolesnikov, 2005; Barbato et al., 2000) effect of the surface over the recombination of species produced by decomposition due to high temperature can increase the heat lux. Since this is an exothermic reaction, such increasing may have resulted in higher heating rates and mass loss rates, which is not considered in the numerical simulation.
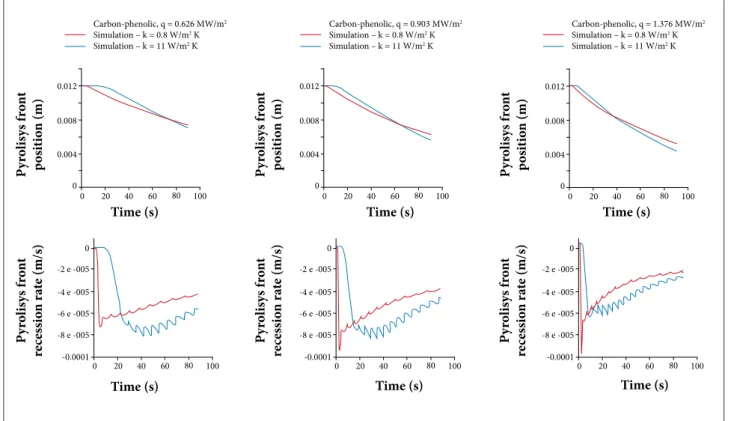
Figure 16. Effects of thermal conductivity difference between carbonized layer (“char”) and the virgin material over the pyrolysis dynamics. P yr o lis ys f ro n t p os it io n (m) P yr o lis ys f ro n t p os it io n (m) P yr o lis ys f ro n t p os it io n (m) P yr o lis ys f ro n t re cess io n r at e (m/s) P yr o lis ys f ro n t re cess io n r at e (m/s) P yr o lis ys f ro n t re cess io n r at e (m/s)
Time (s) Time (s) Time (s)
Time (s) Time (s) Time (s)
Carbon-phenolic, q = 0.626 MW/m2
Simulation – k = 0.8 W/m2 K
Simulation – k = 11 W/m2 K
Carbon-phenolic, q = 0.903 MW/m2
Simulation – k = 0.8 W/m2 K
Simulation – k = 11 W/m2 K
Carbon-phenolic, q = 1.376 MW/m2
Simulation – k = 0.8 W/m2 K
Simulation – k = 11 W/m2 K
0
0 20 40 60 80 100 0.004
0.008 0.012
0
0 20 40 60 80 100 0.004
0.008 0.012
0
0 20 40 60 80 100 0.004
0.008 0.012
-0.0001
0 20 40 60 80 100 -6 e -005
-8 e -005 -2 e -005
-4 e -005 0
-0.0001
0 20 40 60 80 100 -6 e -005
-8 e -005 -2 e -005
-4 e -005 0
-0.0001
0 20 40 60 80 100 -6 e -005
-8 e -005 -2 e -005
-4 e -005 0
exothermic (oxidation) and will have an important impact on energy to the surface.
These effects may result in increasing mass loss rate and decreasing temperature, when compared with the mathematical model. Such effects are implicit in the physical parameters that were measured under speciic conditions, which are not exactly applicable to the actual physical phenomenon and occur at high temperatures. It is expected that these effects occur during the tests in plasma torch because the temperatures in samples’ surface can reach values between 3,600°C – 5,000°C.
he intersection between the curves for the mass loss rate with time among the biased and top parallel wrapping processes appear to be mainly due to the thermal conductivity variation with the angle of inclination of the ibers, since the two curves are far from the lateral parallel wrapping curve in which the fibers are parallel to the heat flow; consequently, ablation processes involved are diferent from those in which the ibers are inclined in relation to the low. When the experimental results are compared with the numerical simulation for the two extreme values of thermal conductivity (0.8 W/m2°C when
the iber is perpendicular to the low and 11 W/m2°C when the
iber is parallel), results present the same behavior. It is noted
that, as the heat lux increases, the crossover point tends to the let, in the direction of convergence of the curves on the initial times. A possible explanation for this behavior, based on numerical results, is related to the diference in conductivity between the carbonized layer (“char”) and the virgin material. he “char” works as an insulator, with a conductivity slightly above the lowest value considered for the virgin material (1.73 W/m2°C) and reaches higher temperatures than this,
because it is directly exposed to the plasma jet and its maximum surface temperature (melting point) can reach 3,700°C.
Y (thickness, m)
T
em
p
er
at
ur
e (K)
1500
1000
500
0
0 0.005 0.01
Y (thickness, m)
T
em
p
er
at
ur
e (K)
2000
1000
0
0 0.005 0.01
Y (thickness, m)
T
em
p
er
at
ur
e (K)
1500
1000
0
0 0.005 0.01
k = 0.8 W/m.oC
k = 11 W/m.oC
q = 0.626 MW/m2 q = 0.903 MW/m2 q = 1.376 MW/m2
Fig. 16, with the resulting char layer working as a thermal insulator. In every case (high and low conductivity), the speed of pyrolysis fronts converge with the time and the diference between them reduces as heat lux increases.
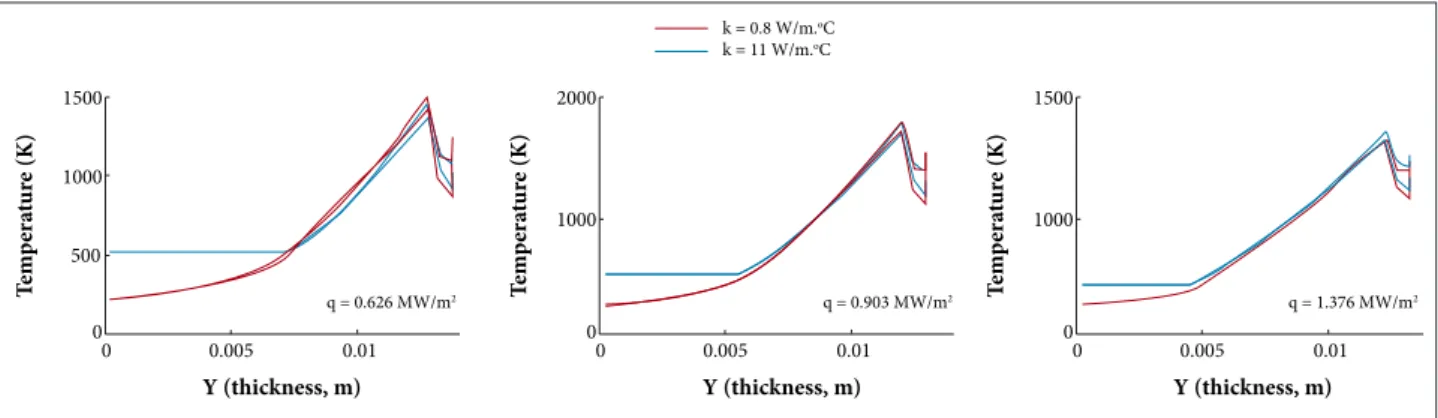
Figure 17 shows results for temperature distribution ater a period of 90 s. In the case of lower thermal conductivity, the highest temperature gradients are observed in the virgin material layer, which results in lower temperatures at the opposite surface to the heat lux. In the case of higher thermal conductivity, there is almost no temperature gradient in the virgin material layer, resulting in a higher temperature on the opposite side to the heat lux. his fact is relevant for a thermal protection system, since one of the objectives of the ablative heat shield is to ensure that temperatures remain below the operating limits. In both cases, the temperature proile of the char layer is quite similar.
CONCLUSION
In this paper, the efect of the iber orientation in a carbon-phenolic ablator was studied. Experimental results were obtained from a test with a plasma jet emulating the gas low within a
rocket nozzle engine, using samples made by two diferent wrapping procedures and extracted from two diferent ways. he experimental data were compared with numerical results of computational simulation, obtained for the maximum and minimum values of thermal conductivity for the composite, according to the iber orientation (perpendicular or parallel to the heat lux).
Comparison of surface temperature at 90 s of warming showed relatively good agreement between experiment and computational simulation, in spite of all uncertainties involved in both methods. he numerical results showed little efect of thermal conductivity over the mass loss rate. However, the experimental results showed a considerable diference between the top sample (ibers normal to heat lux) and the lateral and biased sample (ibers inclined to heat lux direction), which indicates that the iber slope relative to the heat lux afects other physical processes involved in ablation, like pyrolysis gas releasing and surface catalycity efect.
Although the diference between numerical and experimental results and between the top samples and the lateral and biased samples, the order of magnitude and the curve behavior were considered similar, which attested the physical coherence of all results.
Figure 17. Temperature proile in the char and virgin layers of “char” after 90 s of jet exposure.
REFERENCES
Barbato, M., Reggiani, S., Bruno, C. and Muylaert, J., 2000, “Model for Heterogeneous Catalysis on Metal Surfaces with Applications to Hypersonic Flows”, Journal of Thermophysics and Heat Transfer, Vol. 14, No. 3, pp. 412-420. doi: 10.2514/2.6539
Barros, E.A., 2008, “Thermal Plasma for Ablation in Materials Used in Heat Shield of Space Systems” (in Portuguese), Master’s Dissertation, Instituto Tecnológico de Aeronáutica, São José dos Campos, Brazil.
Carleton, K.L. and Marinelli, W.J., 1992, “Spacecraft Thermal Energy Accommodation from Atomic Recombination”, Journal of Thermophysics and Heat Transfer, Vol. 6, No. 4, pp. 650-655. doi: 10.2514/3.11547
Fujimoto, K., Shioya, T. and Satoh, K., 2003, “Degradation of Carbon-Based Materials due to Impact of High-Energy Atomic Oxygen”, International Journal of Impact Engineering, Vol. 28, No. 1, pp. 1-11. doi: 10.1016/S0734-743X(02)00057-X
Juric, D., 1996, “Computations of Phase Change”, Ph.D. Thesis, University of Michigan, Ann Arbor, USA.
Kanevce, L.P., Kanevce, G.H. and Angelevski, Z.Z., 1999, “Comparison of Two Kinds of Experiments for Estimation of Thermal Properties of Ablative Composite”, Proceedings of the 3º International Conference on Inverse Problems in Engineering, Port Ludlow, USA.
Khlybov, V.I. and Makhankov, S.A., 2008, “Experimental Studies to Determine Ablation Parameters and Emissivity of Thermal-Protective Materials”, Technical Report, OAO-Makeyev GRT (Restricted).
Kovalev, V.L. and Kolesnikov, A.F., 2005, “Experimental and Theoretical Simulation of Heterogeneous Catalysis in Aerothermochemistry (a Review)”, Fluid Dynamics, Vol. 40, No. 5, pp. 669-693. doi: 10.1007/s10697-005-0106-4
Machado, H.A., 2013, “Simulation of Ablation in a Sounding Rocket Thermal Protection System Via an Interface Tracking Method with Two Moving Fronts”, Journal of Aerospace Technology and Management, Vol. 5, No. 4, pp. 409-420. doi: 10.5028/jatm.v5i4.262
Machado, H.A., 2014, “Simulation of Two Moving Fronts Ablation in a Composite Thermal Protection System Via an Interface Tracking
Method”, Proceedings of the 11º IAAA/ASME Joint Thermophysics and Heat Transfer Conference, Atlanta, USA.
Russel, G.W., 1996, “Evaluation of Thermal of an Epoxy Composite Using a Complex Modeling Technique”, Proceedings of the AIAA, ASME and ASEE, 32º Joint Propulsion Conference and Exhibit, Lake Buena Vista, USA.
Savage, G., 1993, “Carbon-Carbon Composites”, Chapman & Hall, London, 389p.
Savvatimskii, A.V., 2003, “Melting Point of Graphite and Liquid Carbon”, Physics-Uspekhi, Vol. 46, No. 12, pp. 1295-1303. doi: 10.1070/PU2003v046n12ABEH001699
Schmidt, D.L., 1971, “Ablative Polymers in Aeroespace Technology”, In: D’Alelio, G.F. and Parker, J.A. (Eds.), “Ablative Plastics”, Marcel Dekker, New York, USA, pp. 1-2.
Sutton, K., 1970, “An Experimental Study of a Carbon-Phenolic Ablation Material”, NASA Technical Note D-5930.
Tick, S.J., Huson, G.R. and Griese, R., 1965, “Design of Ablative Thrust Chambers and Their Materials”, Journal of Spacecraft and Rockets, Vol. 2, No. 3, pp. 325-331. doi: 10.2514/3.28179