ABSTRACT: This paper presents the preparation and characterization of carbon iber felt and activated carbon iber felt from textile polyacrylonitrile iber. Carbon ibers are usually related to aircraft manufacturing or high mechanical purposes. Activated carbon ibers are known as excellent adsorbent materials. Despite all advantages, carbon iber and activated carbon iber are expensive materials because of their raw material cost. On the other hand, in this study, carbon iber felt and activated carbon iber felt were produced from textile polyacrylonitrile iber, which is cheaper than their precursor, polyacrylonitrile iber, and can be converted into carbon iber felt and activated material with high micropore content and surface area. This research describes the transformation of textile polyacrylonitrile iber in its oxidized form. After that, the oxidized material was transformed in felt and, in the sequence, converted into carbon iber felt and activated carbon felt. The carbon iber felt and activated carbon iber felt were characterized by X-ray photoelectron spectroscopy, Raman spectroscopy and scanning electron microscope. N2 isotherms were performed to qualify the material obtained for further electrochemical applications. The main result was the conversion dynamics of textile polyacrilonitrile iber into carbon iber in felt form and activated carbon iber in felt with high surface area and high micropores content.
KEYWORDS: Carbon iber, Activated carbon iber, Raman spectroscopy.
Production and Characterization of Activated
Carbon Fiber from Textile PAN Fiber
Miguel Angelo do Amaral Junior1, Jorge Tadao Matsushima1, Mirabel Cerqueira Rezende2, Emerson Sarmento Gonçalves3, Jossano Saldanha Marcuzzo1, Maurício Ribeiro Baldan1
INTRODUCTION
Activated Carbon Fiber Felt (ACFF) has special characteristics when compared with common activated carbons (granular or powder). It can be transformed into fabric, woven or yarn forms which gives them self-sustainable characteristics. In addition, ACFF shows well-defined pore structures on its surface providing a high and fast adsorption capacity for speciic components, such as for speciic components with small molecular dimensions as ions, metals or organic. One of the most important characteristics, which makes ACFF a very special adsorbent material, is its pore size distribution (Suzuki 1994). In the ACFF case, a large amount of micropores can be found directly connected on their surface leading to a faster and less energetic adsorption mechanism, especially for gases (Cuña
et al. 2014). ACFF is widely used in many applications such as air puriication and water treatment, chemical (adsorption and desorption for organic compounds and solvents), military area such as protection garment and masks (Marsh and Reinoso 2006). he density of ACFF is considerably lower than the regular carbon iber, making it ideal for applications requiring low weight. Despite all the advantages of Carbon Fiber Felt (CFF) and ACFF application, their use has been limited due to their relatively high cost.
he use of the textile type polyacrilonitrile (PAN) iber to produce CFF and ACFF is a way to produce a material having an attractive surface area and some studies show this possibility (Carrott et al. 2001; Nabais et al. 2005; Marcuzzo et al. 2012). he use of standard textile iber as raw material to make CFF
1.Instituto Nacional de Pesquisas Espaciais – Coordenação de Laboratórios Associados – Laboratório Associado de Sensores e Materiais – São José dos Campos/SP – Brazil. 2.Universidade Federal de São Paulo – Instituto de Ciência e Tecnologia – Curso de Engenharia de Materiais – São José dos Campos/SP – Brazil. 3.Departamento de Ciência e Tecnologia Aeroespacial – Instituto de Aeronáutica e Espaço – Divisão de Materiais – São José dos Campos/SP – Brazil.
Author for correspondence: Miguel Angelo do Amaral Junior | Instituto Nacional de Pesquisas Espaciais – Coordenação de Laboratórios Associados – Laboratório Associado de Sensores e Materiais | Avenida dos Astronautas, 1.758 – Jardim da Granja | CEP: 12.227-010 – São José dos Campos/SP – Brazil | Email: [email protected]
and ACFF is a way to make this material economically attractive (Yoon et al. 2004). Containing more than 95% of carbon, CFF and ACFF made from textile PAN have low electric resistance and they show potential application for catalytic process, especially when combined with metallic particles or in the form of ilms (Chung 2004; Pierozynski 2012). he CFF and ACFF can also be used as electrodes. he aim of this study is to present the production and characterization of CFF and ACFF made from a standard textile PAN.
MATERIALS AND METHODS
MATERIAL
he commercial 200 ktex tow of 5.0 dtex textile PAN ibers was thermal oxidized in a laboratory scale oven set by, aiming the production of lame resistant ibers. he oxidation process was performed in 2 steps, the irst at 200 °C and the second at 300 °C. he total time process was 50 min for each step. Ater that, the oxidized PAN produced was used as a raw material to produce felt with 200 g/m2 and about 3 mm thickness. he
oxidized PAN iber felt was carbonized, resulting into CFF. Ater that, the CFF was submitted to activation process to obtain the ACFF (Marcuzzo et al. 2012).
During the carbonization process, the oxidized PAN loses about 50% in mass and shrinks linearly about 10%. he shrinkage is an important parameter and must be controlled because an inadequate shrinkage result in poor mechanical characteristics and the iber can not be handled. For this purpose, the oxidized PAN iber felt sample was cut into pieces of about 0.7 × 0.25 m and placed in a special sample holder that can control the sample shrinkage in 2 dimensions.
he set was then introduced in an electrical furnace. Both ends of the furnace tube were closed by langes, which allowed the insertion and the purge of processing gas to provide an atmosphere condition necessary for the carbonization and activation. he carbonization was performed in argon atmosphere at a inal temperature of 1,000 °C at a heating rate of 30 °C/min. he process time at maximum temperature was set in 20 min to complete the carbonization process. After finishing the carbonization process, the furnace was turned of and maintained in Ar atmosphere. his condition of inert atmosphere was maintained until the room temperature inside the furnace reactor was reached.
he CFFs were carbonized at 900 °C, prior to activation, which was immediately accomplished at 1,000 °C, replacing
the Ar gas by CO2 gas, during 50 min. he activation time was previously deined by tests where the mechanical evaluation was done (Marcuzzo et al. 2012). he activation time of 50 min was ixed to guarantee the minimal mechanical condition to complete the carbonization process.
METHODS
he characterization was performed by gas adsorption aiming the measurements of surface area and pore size distribution function. he isotherm was performed by Beckman Coulter SA 3100 equipment. The Brunauer, Emmett, Teller (BET) method was applied to determine the total surface area and the pore size distribution was estimated by applying the Non-Local Density Function heory (NLDFT) method over the adsorption isotherm, and the micropore volume was also estimated by the same method (Marsh and Reinoso 2006). he burn-of was estimated weighing the sample before and ater the activation process.
he structural characterization of the CFF and ACFF were carried out by micro-Raman scattering spectroscopy (Renishaw Microscopy - 2000). Using the 514.5 nm line of an Ar ion laser taking the spectra at the range from ~ 800 to ~ 1,800 cm−1.
The optical microscope was used to excitation laser beam onto the sample and to collect the backscattered light. he diameter of the laser spot on the sample surface was 0.45 µm for the fully focused laser beam at 50X objective magniication. he instrument was calibrated using a pure diamond crystal. From the Raman spectroscopy, it was possible, quantitatively, to evaluate the change in the graphite organization through itting by a combination of 4 Lorentzian bands (L, D1, D2, D4) and a Gaussian band (D3) (Sadezky et al. 2005).
The morphological aspects of the CFF and ACFF were evaluated by scanning electron microscopy (SEM) using a JEOL JSM microscope. All the X-ray photoelectron spectroscopy (XPS) measurements were carried out with a Kratos Axis Ultra XPS spectrometer using a monochromatic Al-Kalpha(1,486.5 eV) X-ray radiation with power of 15 kV at 150 W. he emitted photoelectrons were detected using a hemispherical analyzer at 15 µm spatial resolution. he vacuum system was maintained at approximately 10-9 Torr during all the experiments. Survey scans
Figure 1. Nitrogen isotherm of ACFF at 77 K. 0.0
250
200
150
100
50
0
0.2
Relative pressure [P/P
0]
Q
u
an
ti
ty a
bs
o
rb
ed [cm
3 /g S
TP]
0.4 0.6 0.8 1.0
0 0.5
0.4
0.3
0.2
0.1
0.0
2
Pore width [nm]
dV(d) [cm
3/(nm.g)]
4 6 8 10
120,000
I
n
te
ns
it
y [a.u
.]
100,000
80,000
25,000 100,000 80,000 60,000 40,000 20,000 0
20,000
15,000
10,000 545
300 290 280
535 525 515
60,000
40,000
20,000
0
800
Binding energy [eV]
600 400 200
O 2s 23 e V
N 1s 398 e V O 1s 531 e V
C 1s 285 e V C F F A C F F
0
Figure 2. Pore size distribution curve of ACFF by NLDFT.
RESULTS AND DISCUSSION
SURFACE TEXTURE ANALYSIS
he aim of this topic is to show the characterization of CFF and ACFF. he carbonized iber felt material, in theory, has about no signiicant surface area. he nitrogen isotherm technique was not able to show information about CFF surface area; consequently, it was considered smooth and without pores. On the other hand, for ACFF, the N2 adsorption at 77 K isotherm showed signiicant information about surface texture. he isotherm is shown in Fig. 1 and is typically type I isotherm with no hysteresis and the saturation occurring at 0.2 relative working pressure and atmospheric pressure (P/P0).
than 1.0 nm, because of N2 penetration limit. However, it can be clearly observed in this curve that the distribution in the region for a width less than 1 nm is ascendant in the direction of origin. his fact infers that pore volume and surface area of micropores may be bigger than those calculated by using these isotherms. he main ACFF characteristics are presented in Table 1.
These results indicate that this activated material is predominantly populated with micropores. The pore size distribution curve is shown in Fig. 2, and it clearly shows that the maximum pore width presented is around 2 nm and the predominant pores are sized at around 1.2 nm. his technique does not give information about pores sized less
Sample Burn off (w%) BET (m²/g) Vmicropore Vtotal
ACFF 35 1,260 0.53 0.59
Table 1. Surface characteristics of ACFF.
X-RAY PHOTOELECTRON SPECTROSCOPY DATA
XPS has proved a powerful method for the investigation of carbon surfaces (Kim and Park 2011; Ma et al. 2013). XPS surface characterization method combines surface sensitivity with the ability to quantitatively obtain both elemental and chemical state information. he surface chemistry of carbons is determined by the distribution and the nature of the surface functional groups. Many diferent functional groups can be identiied on carbon surface. he information of all elements can be obtained from the survey scan spectrum of XPS. Vision sotware was used to calculate atomic concentrations. From survey spectra, atomic concentrations were calculated using peak areas of elemental lines.
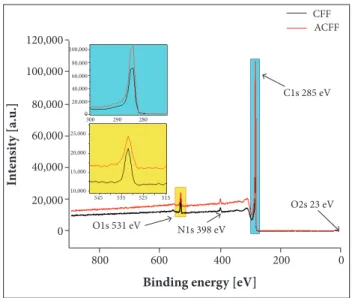
X-Ray Photoelectron Spectroscopy Survey Spectra
Figure 3 shows the XPS survey spectra from which the elemental composition of the most external surface of the CFF
and ACFF samples was revealed. he spectra indicate that the major peaks in the spectra were due to the C 1s and O 1s, and a smaller N 1s peak is also discernible.
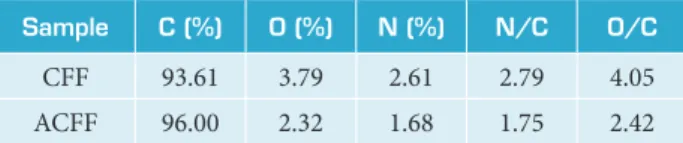
he contribution of the XPS technique in this work is the precise identiication of the elements present on the surface of CFF and ACFF samples. he elemental composition (in %) on the CFF and ACFF samples were summarized in Table 2. XPS survey spectra showed the presence of less than 4.0% of oxygen on the surface of CFF and ACFF. he ACFF displayed O/C ratio of 2.42% while CFF showed higher O/C ratio of 4.05%. he same behavior was observed in the relative percentages of N/C atoms decreasing from 2.79 to 1.75% ater the activation process.
ACFF samples. he spectra consist of 2 major peaks attributed to D1 and G. he G peak corresponds to the 1st-order Raman. he band frequency G (~ 1,584 cm-1) is the E
2g 1st-order mode at the Brillouim zone center (gamma point). he G peak is due to the C-C bond stretching of all pairs of sp2 atoms in both
rings and chains. In particular, the G peak is the main Raman signature for sp2 carbon. he spectra also exhibit additional
irst-order band characterized by a disorder that represents a zone-edge A1g mode. Since the D1 band is activated by defects, its intensity can be used to quantify disorders. Besides, it is used to characterize the microcrystallite size (La), which can be estimated from the ratio between D1and G bands by using the method of Tuinstra and Koenig (1970). homsen et al. (2004) were the irst to explain the Raman spectra of the D mode using the concept of double resonances for a given laser energy and phonon branch. he origin and dispersion of the D band in carbon materials were also investigated by Matthews et al.
(1999). To explain the physical basis, these authors discussed the 2-D electron and phonon dispersion curves for graphite and concluded that the electronic transition only occurs in the
Sample C (%) O (%) N (%) N/C O/C
CFF 93.61 3.79 2.61 2.79 4.05
ACFF 96.00 2.32 1.68 1.75 2.42
Table 2. Elemental composition and N/C and O/C ratio for the CFF and ACFF samples.
he elemental composition and N/C as well as O/C ratio show a chemical surface change ater the activation process. Besides, a slight increase in the amount of carbon was observed. The contribution of the XPS technique in this work is the precise identiication of the elements present on the surface of CFF and ACFF samples. As expected, carbon, oxygen and nitrogen have been found on the surface of both ibers. In Fig. 3, it was observed that the carbon peak intensity is higher for ACFF. On the other hand, it may be observed a decrease in the oxygen amount ater the activation process. In other words, the activation process contributed to the removal of the oxygen layer on the CFF, increasing the amount of carbon on the surface of ACFF.
RAMAN ANALYSIS
Raman spectroscopy is a technique widely used for analyzing carbon-based materials due to its sensitivity to diferent carbon structures, which produce distinctive Raman peaks for various forms of carbon. For example, the exact frequencies of the Raman bands of diamond, graphite, and amorphous forms of carbon depend on the crystallite size and stress present in the diferent carbon domains. he graphitic materials consist of a large number of peaks. However, the most intense broad bands are the G and D. In this paper, the D band is assigned as D1. Raman spectra have been analyzed following Sadezky
et al. (2005). Figure 4 shows the Raman spectra of the CFF and Figure 4. Raman spectra of the CFF and ACFF. 1.0
D4
D
2
D3
D
1
G
CFF
0.0 0.2 0.4 0.6 0.8
800 1,000 1,200 1,400 1,600 1,800
Raman shift [cm−1]
In
te
ns
it
y [a.u
.]
1.0
D4
D2
D3
D1
G
ACFF
0.0 0.2 0.4 0.6 0.8
800 1,000 1,200 1,400 1,600 1,800
Raman shift [cm−1]
In
te
ns
it
y [a.u
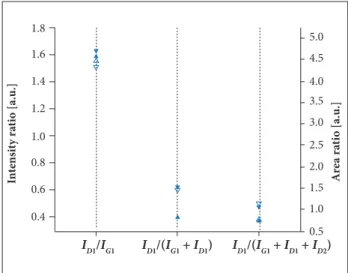
vicinity of the K point in the Brillouin zone. In the literature, it has been accepted that the relationship between band intensities is proportional to the degree of organization of carbonaceous materials. However, this relationship has been used in diferent forms as (ID1/IG)A,H or (ID1/(IG+ ID1))A,H. he subscripts A and
H indicate that the ratio is based on integrated intensities or peak heights, respectively. Beyssac et al. (2003) proposed to characterize the organization using R2= (ID1/(IG+ ID1 + ID2))A,H. In this study, we tested the 3 diferent forms used in the literature. Besides, Lobo et al. (2005) considered the intensity values obtained from the integration of the D and G bands instead of using the ratio of the peak heights. In other words, the efect of line broadening is included in their calculation.
Special care should be taken to deine a baseline to compare one spectrum to another. It is very important to point out that the decomposition is very sensitive to the choice of baseline. A linear baseline was chosen for both spectra to be the most appropriate. Raman spectra of the CFF and ACFF samples were submitted to deconvolution to separate G and D1 peak in the irst order by itting as a sum of the Lorentzian-shaped G,
D1, D2 and D4 bands, as well as the Gaussian-shaped D3 band. he reason for the D3 band being Gaussian-shaped is because it presents better it with the experimental data (Sadezky et al. 2005) and this study is also in agreement with this result. he itting accounts the totality of the signal. It is noteworthy that both spectra G and D bands overlap each other to some extent. he overlapping is very important when we consider the integrated intensities. he spectra were recorded at diferent positions on the surface and looked very similar. he proportions in which the band participates are reported in Fig. 4 and the parameters used to calculus in Table 3. here is an appreciable diference in the absolute value of the 3 diferent forms to characterize carbonaceous materials. However, when we analyze each one individually, the ratio based on integrated intensities or peak
heights did not present signiicant diference. By comparing the 3 diferent forms presented (Fig. 5), it is possible to verify that
ID1/(IG + ID1)A,H and ID1/(IG + ID1+ ID2) are more dispersive than
ID1/IG. Several authors (Tuinstra and Koenig 1970; homsen
et al. 2004; Matthews et al. 1999; Beyssac et al. 2003) discuss the D and G band intensity ratios (ID1/IG) and full width at half maximum for G-band (FWHM-G) and for D-band (FWHM-D) decrease with the increasing degree of crystalline. By considering the integrated intensities of D and G,our results reveal that (ID1/IG) for both CFF and ACFF are very close. However, according to Table 3, the FWHM-D1 changes from 210.87 for CFF to 167.01 cm–1 for ACFF present a decrease of
approximately 21%. Besides, the FWHM-G decreased ater the activation processing by 17%. he decrease can be interpreted as some kind of transition related with the temperature during the activation process. Probably, it is related with the decrease in oxygen during the activation process as can be observed in XPS measurements. his indicates that defects were not introduced
A
re
a r
at
io
[a
.u
.]
In
te
ns
it
y r
at
io
[a
.u
.]
I
D1/(IG1 + ID1 + ID2)
I
D1/(IG1 + ID1)
I D1/IG1
0.5 1.0 1.5 2.0 2.5 3.0 3.5 4.0 4.5 5.0 1.8
1.6
1.4
1.2
1.0
0.8
0.6
0.4
Band Line shape CFF - Sample ACFF - Sample
Area Center FWHM Area Center FWHM
D4 Lorentz 25 1,173.71 401.34 16.29 1,173.14 257.66
D1 Lorentz 266.70 1,351.36 210.87 225.04 1,344.24 167.01
D3 Gaussian 48.27 1,536.53 146.32 37.88 1,530.21 139.14
G Lorentz 59.44 1,584.32 71.09 48.91 1,582.81 59.01
D2 Lorentz 22 1,610.46 51.38 31.43 1,606.48 49.01
Table 3. Fitting parameters of the G, D1, D2, D3 and D4 bands for the CFF and ACFF samples.
Figure 5. Calculation of the different ratio involving IG, ID1
Figure 7. (a) CFF and (b) ACFF SEM images (1: Dark zones; 2: Groove region).
1
2
(a) (b)
(1)
(2)
(a)
during the process of activation. In fact, this indicates a small organization of the ACFF. Recently, Mallet-Ladeira et al. (2014) and Hu et al. (2015) reported dif erent i tting procedures; the authors claim that their procedures are the most appropriate. h ere is a considerable controversy regarding i tting procedures. In this study, we consider that the most appropriated procedure for our results is to deconvolute the spectra utilizing multi-bands as reported in Sadezky et al. (2005). At er analyzing the 3 dif erent forms, we conclude that the variations of FWHM are no rel ected in the (ID1/IG) form. On the other hand, the relation ID1/(IG+ ID1)A,H and ID1/(IG + ID1+ ID2) indicates that the structure of the CFF was changed at er the activation process, which may be related to the production of surface defects at er the removal of surface radicals from the sample.
X-RAY PHOTOELECTRON SPECTROSCOPY ANALYSIS
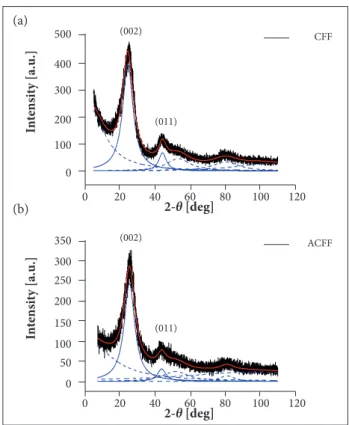
Figure 6 illustrates the XRD spectra for the CFF and ACFF samples. h e dif ratogram pattern of these samples exhibits 2 distinctive broad rel ections in the θ angles located approximately at 25 and 44°. The peak broadening is an indicative of an amorphous structural aspect. h e broad rel ection in the 20 at 25° and 44° are associated with (002) and (001) dif raction line, respectively.
350
300 250
200
150
100
(011) (002)
ACFF
50
0
0 20 40 60 80 100 120
2 -θ [deg]
In
te
ns
it
y [a.u
.]
500
400
300
200
100
( 0 11)
(002) CFF
0
0 20 40 60 80 100 120
2-θ [deg]
In
te
ns
it
y [a.u
.]
Figure 6. XRD spectra for (a) CFF and (b) ACFF samples.
From the X-ray dif raction (XRD) patterns of the CFF and ACFF, the lateral size (La) and stacking height (Lc) parameters were calculated using the Scherrer equation (Warren 1969) — Eqs.1 and 2, respectively. For calculation of La and Lc, we applied the Scherrer constant kc equal to 0.9 for (002) dif raction line and ka equal to 1.77 for (011) dif raction line, where λ (0.15 nm) is the wavelength of the X-ray used; β011and β002 are full width at half maximum of the dif raction line (002) and (011). h e results are summarized in Table 4.
It can be noticed a small change in La and Lc after the activation process. h is can be explained by the formation of pores on the CFF surface at er the activation process. Although the changes in Laand Lcare not considerable, there is a signii cant increase in the crystallite size (Table 4).
SCANNING ELECTRON MICROSCOPY ANALYSES
h e SEM images for the CFF and ACFF samples are presented in Fig. 7. From the SEM images obtained from the magnii cation of 1,000X, it is possible to observe the production of samples consisting of i bers of about 10 – 15µm in diameter. h e SEM images also revealed the presence of smooth i bers, without
Sample Lc (nm) La (nm)
CFF 4.52 12.88
ACFF 4.44 11.71
Table 4. Crystallite size of the CFF and ACFF.
(a)
damages, grooves and holes. The visualization of the fiber surface with more details was possible through SEM images obtained from magniication of 5,000X. Based on these images, a smooth, clean and damage-free surface can be visualized for the CFF sample. On the other hand, the ACFF sample presents a surface containing dark zones and grooves. Pores with nano-dimension are not identiied by SEM in Fig. 7. However, the presence of pores is conirmed according with Fig. 2. his morphological diference related to surface damages may be associated with the activation process. In fact, these types of damages were expected.
CONCLUSION
Activated carbon ibers produced from PAN ibers textile were successfully achieved. hese studies had an important contribution regarding the understanding of the activation process on the CFF samples. he activation process plays an important role for the production of ibers with high surface and pore distribution, which are determinant to increase the exposed area. hese characteristics were revealed through nitrogen adsorption isotherm analysis. XPS analysis reported the decrease in the heteroatoms quantity present in the sample, causing defects on the surface. he defects were observed by Raman spectroscopy analysis. he presence of surface imperfections was revealed through SEM images. he X-ray difractograms
showed the CFF sample had higher crystallites when compared to the ACFF one. his decrease in the crystallite size may be associated with the surface tension resulting from the activation process. Besides, the release of heteroatoms is responsible by the creation of defect, causing damage on the surface.
ACKNOWLEDGEMENTS
he authors would like to thank Fundação de Amparo à Pesquisa do Estado de São Paulo (FAPESP), Coordenação de Aperfeiçoamento de Pessoal de Nível Superior (CAPES) and Conselho Nacional de Desenvolvimento Cientíico e Tecnológico (CNPq) for inancial support.
AUTHOR’S CONTRIBUTION
Conceptualization, Amaral Junior MA, Marcuzzo JS, and Baldan MR; Characterization, Amaral Junior MA,Marcuzzo JS, Baldan MR, and Gonçalves ES; Materials Production, Marcuzzo JS and Baldan MR; Methodology, Amaral Junior MA, Matsushima JT, Gonçalves ES, and Rezende MC; Writing – Original Drat, Amaral Junior MA and Baldan MR; Writing – Review & Editing, Amaral Junior MA, Baldan MR, and Rezende MC; Funding Acquisition, Baldan MR; Resources, Baldan MR and Marcuzzo JS; Supervision, Amaral Junior MA, Rezende MC, and Baldan MR.
REFERENCES
Beyssac O, Goffé B, Petitet JP, Froigneux E, Moreau M, Rouzaud JN (2003) On the characterization of disordered and heterogeneous carbonaceous materials by Raman spectroscopy. Spectrochimica Acta Part A: Molecular and Biomolecular Spectroscopy 59(10):2267-2276. doi: 10.1016/S1386-1425(03)00070-2
Carrott PJM, Nabais JMV, Carrott MR, Pajares JA (2001). Preparation of activated carbon ibres from acrylic textile ibres. Carbon 39(10):1543-1555. doi: 10.1016/S0008-6223(00)00271-2
Chung DDL (2004) Review electrical applications of carbon materials. J Mater Sci 39:2645-2661. doi: 10.1023/B:JMSC.0000021439.18202. ea
Cuña A, Tancredi N, Bussi J, Deiana AC, Sardella MF, Barranco V, Rojo JME (2014) Grandis as a biocarbons precursos for supercapacitor electrode application. Wast and Biomass Valor 5(1):305-313.
Hu C, Sedghi S, Silvestre-Albero A, Andersson GG, Sharma A, Pendleton P, Biggs MJ (2015) Raman spectroscopy study of the transformation of the carbonaceous skeleton of a polymer-based nanoporous carbon along the thermal annealing pathway. Carbon
85:147-158. doi: 10.1016/j.carbon.2014.12.098
Kim YK, Park H (2011) Light-harvesting multi-walled carbon nanotubes and CdS hybrids: application to photocatalytic hydrogen production from water. Energy & Environmental Science 4(3):685-694. doi: 10.1039/C0EE00330A
Lobo AO, Martin AA, Antunes EF, Trava-Airoldi VJ, Corat EJ (2005) Caracterização de materiais carbonosos por espectroscopia Raman. Revista Brasileira de Aplicações de Vácuo 24(2):98-103. doi: 10.17563/rbav.v24i2.99
Ma X, Yuan C, Liu X. (2013) Mechanical, microstructure and surface characterizations of carbon ibers prepared from cellulose after liquefying and curing. Materials 7(1):75-84. doi: 10.3390/ ma7010075
Marcuzzo JS, Otani C, Polidoro HA, Otani S (2012) Inluence of thermal treatment on porosity formation on carbon iber from textile PAN. Mater Res 16(1):136-144.
Marsh H, Reinoso FR (2006) Activated carbon. Amsterdam: Elsevier. Chapter 4, Characterization of activated carbon; p. 143-242.
Matthews MJ, Pimenta MA, Dresselhaus G, Dresselhaus MS, Endo M. (1999) Origin of dispersive effects of the Raman D band in carbon materials. Phys Rev B 59(10):R6585. doi: 10.1103/PhysRevB.59. R6585
Nabais JV, Carrott PJM, Carrott MR (2005) From commercial textile ibres to activated carbon ibres: chemical transformations. Mater Chem Phys 93(1):100-108. doi: 10.1016/j.matchemphys.2005.02.031
Pierozynski B (2012) Electrodeposition of nickel onto 12K carbon ibre tow in a continuous manner. Croat Chem Acta 85(1):1-8. doi: 10.5562/cca1743
Sadezky A, Muckenhuber H, Grothe H, Niessner R, Pöschl U (2005) Raman microspectroscopy of soot and related carbonaceous
materials: spectral analysis and structural information. Carbon 43(8):1731-1742. doi: 10.1016/j.carbon.2005.02.018
Suzuki M (1994) Activated carbon iber: fundamentals and applications. Carbon 32(4):577-586. doi: 10.1016/0008-6223(94)90075-2
Thomsen C, Reich, S, Maultzsch J (2004) Resonant Raman spectroscopy of nanotubes. Philosophical Transactions of the Royal Society of London A: Mathematical, Physical and Engineering Sciences 362(1824):2337-2359. doi: 10.1098/rsta.2004.1444
Tuinstra F, Koenig, JL (1970). Raman spectrum of graphite. J Chem Phys 53(3):1126-1130. doi: 10.1063/1.1674108
Warren BE (1969) X-ray diffraction. North Chelmsford: Courier Corporation.