www.atmos-chem-phys.net/14/10721/2014/ doi:10.5194/acp-14-10721-2014
© Author(s) 2014. CC Attribution 3.0 License.
Surface gas pollutants in Lhasa, a highland city of Tibet – current
levels and pollution implications
L. Ran1, W. L. Lin2,*, Y. Z. Deji3, B. La3, P. M. Tsering4, X. B. Xu2, and W. Wang3
1Key Laboratory of Middle Atmosphere and Global Environment Observation, Institute of Atmospheric Physics, Chinese
Academy of Sciences, Beijing 100029, China
2Key Laboratory for Atmospheric Chemistry, Chinese Academy of Meteorological Sciences, Beijing 100081, China 3Tibet Institute of Plateau Atmospheric and Environmental Science, Lhasa 850000, China
4Lhasa Meteorological Service, Lhasa 850000, China
*now at: Meteorological Observation Centre, China Meteorological Administration, Beijing 100081, China
Correspondence to:W. L. Lin ([email protected])
Received: 24 March 2014 – Published in Atmos. Chem. Phys. Discuss.: 12 May 2014 Revised: 29 July 2014 – Accepted: 10 September 2014 – Published: 10 October 2014
Abstract. Through several years of development, the city of Lhasa has become one of the most populated and urban-ized areas on the highest plateau in the world. In the process of urbanization, current and potential air quality issues have been gradually concerned. To investigate the current status of air pollution in Lhasa, various gas pollutants including NOx, CO, SO2, and O3, were continuously measured from
June 2012 to May 2013 at an urban site (29.40◦N, 91.08◦E,
3650 m a.s.l.). The seasonal variations of primary gas pollu-tants exhibited a peak from November to January with a large variability. High mixing ratios of primary trace gases almost exclusively occurred under low wind speed and showed no distinct dependence on wind direction, implying local ur-ban emissions to be predominant. A comparison of NO2,
CO, and SO2 mixing ratios in summer between 1998 and
2012 indicated a significant increase in emissions of these gas pollutants and a change in their intercorrelations, as a result of a substantial growth in the demand of energy con-sumption using fossil fuels instead of previously widely used biomass. The pronounced diurnal double peaks of primary trace gases in all seasons suggested automobile exhaust to be a major emission source in Lhasa. The secondary gas pol-lutant O3 displayed an average diurnal cycle of a shallow
flat peak for about 4–5 h in the afternoon and a minimum in the early morning. Nighttime O3was sometimes completely
consumed by the high level of NOx. Seasonally, the
varia-tions of O3 mixing ratios displayed a low valley in winter
and a peak in spring. In autumn and winter, transport largely
contributed to the observed O3mixing ratios, given its
depen-dence on wind speed and wind direction, while in spring and summer photochemistry played an important role. A more efficient buildup of O3 mixing ratios in the morning and a
higher peak in the afternoon was found in summer 2012 than in 1998. An enhancement in O3mixing ratios would be
ex-pected in the future and more attention should be given to O3photochemistry in response to increasing precursor
emis-sions in this area.
1 Introduction
The Tibetan Plateau, with an average altitude of about 4000 m, is the highest plateau in the world. The capital city of Tibet, Lhasa, is one of the most populated and urbanized areas in this region. Lhasa lies on the northern bank of the Lhasa River in the Lhasa River valley, which runs west to east and is surrounded by mountains. There are currently 200 thousand inhabitants and a floating population of nearly 400 thousand within an urban area of about 63 km2. The number of automobiles in Lhasa was already over 150 thousand at the end of 2012.
In Lhasa, gas pollutants including nitrogen oxides (NOx= NO + NO2), carbon monoxide (CO), sulfur dioxide
(SO2) and volatile organic compounds (VOCs) are mainly
3650 m, the absolute content of oxygen in Lhasa is about 68 % of that at the sea level. Incomplete fuel combustion in the low oxygen-containing atmosphere (Chaffin and Ull-man, 1994; Bishop et al., 2001; Nagpure et al., 2011), as well as the rapidly increasing vehicles undoubtedly enhances at-mospheric pollutants of vehicular origin. These atat-mospheric pollutants impair the visibility and degrade the air quality. Moreover, the secondary gas pollutant ozone (O3) can be
generated by its precursors NOxand VOCs in the presence of
sunlight (e.g., Haagen-Smit, 1952; Haagen-Smit et al., 1953; Seinfeld and Pandis, 1998). Surface O3pollution is one of the
most stubborn and pervasive environmental problems in the world. At a high mixing ratio, O3is harmful to human health
and the ecosystem (Chameides et al., 1994; Jacobson, 2002). With a high production potential of OH radicals over the Ti-betan Plateau, where the solar radiation is strong due to the high altitude as well as the low latitude and the background mixing ratio of ozone is high, the atmosphere in Lhasa was expected to be very photochemically active (Lin et al., 2008). A concern should thereby be raised on the O3problem, given
the increasing emissions of O3precursors in the process of
urbanization.
Most efforts have previously been exerted on exploring the O3valley and O3vertical profiles over the Tibetan Plateau by
satellite observations (Guo et al., 2012), ozone sondes (Shi et al., 2000; Tobo et al., 2008; Bian et al., 2012) and model simulations (Liu et al., 2003; Tang and Prather, 2012). In-vestigations on surface trace gases have rarely been reported for Lhasa, the rapidly growing capital city of Tibet (Yu et al., 2001; Zhou et al., 2001; Tang et al., 2002; Dechen et al., 2008). In comparison with many other cities in China (He et al., 2002 and the references therein), air quality in Lhasa was quite fine. The level of air pollutants in Lhasa has never exceeded the national air quality standards according to the reports of the local environment protection bureau. However, with thriving tourism and economy in the process of urban-ization, more and more pollutants are expected to be accu-mulated within the city due to the valley topography. In this paper, an analysis of systematically collected data of surface O3, NOx, CO, and SO2during 1 year is presented and
dis-cussed. The observational site and instruments are described in Sect. 2. An overview of meteorology is given in Sect. 3.1. Seasonal and diurnal variations of the gas pollutants are pre-sented in Sect. 3.2, followed by a discussion on how mete-orology could influence the observed mixing ratios of gas pollutants in Sect. 3.3. A possible impact of urbanization on air quality in Lhasa in past decades is discussed in Sect. 4.
2 Observations 2.1 The site
Lhasa sits in a flat river valley in the Himalaya mountains (Fig. 1a). Located at the bottom of a small basin surrounded
Figure 1. (a)The topography and(b)the urban map of the site and its surrounding area (from Google Maps).
by the Himalaya mountains, Lhasa has an elevation of about 3650 m and lies in the center of the Tibetan Plateau with the surrounding mountains rising to 5500 m. The Lhasa River (or Kyi Chu), a tributary of the Yarlung Zangbo River, runs through the southern part of the city. The marshlands, mostly uninhabited, are to the north of the city. Ingress and egress roads run east and west.
The observational site (29.40◦N, 91.08◦E, 3650 m a.s.l.) for this study is at a meteorological and atmospheric compo-sition monitoring station, located in a residential and com-mercial area in urban Lhasa (Fig. 1b). The site is about 2 km east of the famous Potala Palace. There are also another two famous temples (Jokhang Temple and Ramoche Tem-ple) within the surrounding 1 km2 of the site. In addition, measurements of trace gases were also conducted in sum-mer 1998 at a suburban site to the east of the city center (29.65◦N, 91.16◦E, 3650 m a.s.l.). This suburban site was located in large areas of farms with sparsely interspersed res-idency 15 years ago, but now already within the populated areas of Lhasa after its continuous expansion and develop-ment.
2.2 Instruments and data
Surface trace gases were continuously monitored for 1 year from June 2012 to May 2013, using commercial instruments installed on top of a 20 m high building at the site. Observa-tions of CO and SO2started from August 2012. Missing CO
A UV photometric analyzer (Model 49C) from Thermo Electron Corporation (TE, USA) was used to determine the O3mixing ratios. CO was measured with a gas filter
correla-tion analyzer (TE 48CTL). SO2was measured with a pulsed
fluorescence analyzer (TE 43CTL). EC9841B/ECOTECH nitrogen oxides analyzer with a heated molybdenum NO2
to NO converter and the chemiluminescence technique was used to simultaneously quantify mixing ratios of NO and NOx. According to USEPA recommendations on quality
as-surance and quality control (USEPA, 2008), multipoint cal-ibrations were operated every month using a dynamic gas calibrator (Gascal 1100, Ecotech, Australia) and a zero air supplier (Eco Physics PAG003, Switzerland), together with the standard reference gas mixture (NO/CO/SO2in N2).
The O3 analyzer was calibrated using a TE 49CPS
calibra-tor, which is a reference for the WMO regional GAW stations in China and traceable to the WMO NIST standard. Partic-ularly, zero checks for the CO analyzer were automatically performed every 2 h to record zero drifts, using the SOFNO-CAT 514 oxidation catalyst (Molecular Products Asia Ltd, UK) and a 3-way solenoid valve. Ambient mixing ratios of trace gases were recorded as 1-min averages (ppb).
Meteorological data were obtained from an Automatic Weather Station at the site. Wind speed and wind direction were measured at 10 m height, reported as 10-min average wind speed and 10-min smoothing wind direction based on 1-s sampling data for each hour. Other parameters includ-ing temperature, relative humidity and precipitation were ob-served at 1.5 m height and reported in hourly averages. Cloud amount was recorded four times each day: 00:00, 06:00, 12:00 and 18:00 LT (local time).
At the suburban site, measurements of O3, NO2, CO, and
SO2mixing ratios were carried out from June to September
1998 on top of a 3-storey building (Tang et al., 2002). As for O3and CO, the same measurement principles and similar
quality control procedures were used in both 1998 and 2012, with a linear uncertainty of about 2 %. O3mixing ratios were
measured by a UV photometric analyzer (TE 49C), which was calibrated using a TE 49CPS calibrator. CO gas correla-tion filter (GFC, Advanced Pollucorrela-tion Instruments Inc, USA) with the non-dispersive infrared (NDIR) technique was used to monitor the low level of CO mixing ratios. Also due to the extremely low level of NO2and SO2mixing ratios in Lhasa
at that time, the air was sampled for 4170 min by filter-based samplers every 3 to 4 days. Mixing ratios of NO2and SO2
were quantified in the laboratory by the DX-500 ion chro-matography system (Dionex, USA) and reported in ppb (the lowest detect limits were 0.03 and 0.02 ppb for SO2and NO2,
respectively).
1 2 3 4 5 6 7 8 9 10 11 12 0
20 40 60 80 100 120
Lhasa
Precipitation (mm)
18:00−06:00 06:00−18:00
1 2 3 4 5 6 7 8 9 10 11 12 0 20 40 60 80 100 120
Frequency (%)
Month
Figure 2.Precipitation (bars) in the daytime (06:00–18:00 LT) and at night (18:00–06:00 LT) from June 2012 to May 2013 in Lhasa. The frequency of precipitation in each month is shown by dots.
3 Results and discussion 3.1 An overview of meteorology
Situated on the Tibetan Plateau, Lhasa has a very high level of ultraviolet radiation, especially in the summer, due to the high altitude, the low latitude and the tenuous atmosphere (Pu Bu et al., 1997; Ren et al., 1999; Norsang et al., 2009). With strong solar radiation in the daytime, the maximum air temperature could still reach as high as 15.8◦ even in
the coldest month January, when the average air temperature was below zero and the minimum was−11.4◦. The highest
monthly average of 18.1◦and daily maximum of 28.9◦were
found in June. The weather in the rainy season from May to September was generally warm, humid and cloudy. Monthly averages of the temperature and relative humidity ranged from 13.3±5.2 to 18.1±4.4◦ and from 41 to 60 %, re-spectively. In the rainy season, the precipitation amounted to 368 mm, about 94 % of the total amount in the year (Fig. 2). Despite the large amount of frequently observed precipita-tion in the rainy season, particularly in summer from June to August, most of the precipitation occurred at night (18:00– 06:00 LT), accounting for 84 % of the total amount during this period. In the rest of the year, it was usually dry and cloud-free. There was hardly any precipitation from Octo-ber to March. During this period, around 46 % of the days were clear in the daytime based on the cloud amount, while at night the fraction rose to about 74 %. Monthly averages of the temperature and relative humidity ranged from−0.1±5.8 to 10.6±5.5◦and from 14 to 27 %, respectively, in the dry pe-riod.
Figure 3.The frequency of wind direction plotted by wind rose for four seasons in Lhasa, (a)with all wind speed, the frequency of calm conditions is given in the center circle,(b)with wind speed above 2 m s−1.
mountains to the north and south of the city significantly inhibited winds in these directions, especially those with a wind speed above 2 m s−1. The frequency of northerly winds was though comparable with that of easterly or westerly winds, the wind speed of northerly winds was exclusively under 2 m s−1(Fig. 3b). The observed 10-min average wind speed was mostly smaller than 2 m s−1(close to 65 %), with the annual average occurrence of calm conditions to be about 10 % and the frequency of wind speed larger than 2 m s−1 around 25 %. High wind speed was usually observed in the afternoon in summer and autumn.
3.2 Seasonal and diurnal variations of gas pollutants Monthly averages of O3, Ox(O3+ NO2), NO, NOx, CO, and
SO2mixing ratios are displayed in Fig. 4. Ozone and total
oxidant Ox exhibited similar seasonal variations, with the
peak in spring and the low valley in winter. The maximum monthly mean mixing ratios of O3 and Ox were observed
in May as 56.8±10.1 ppb and 70.1±10.6 ppb, respectively. The highest monthly O3 average mixing ratio observed in
Lhasa was slightly higher than that of 54.8±18.1 ppb ob-served in June 2007 at a rural site Gucheng, which was thought to have good regional representativeness of the North China Plain, one of the most polluted regions in the world (Lin et al., 2009). The highest hourly O3 mixing
ra-tio of 90.6 ppb in Lhasa was also observed in May, while in another more industrialized high altitude urban area, the Mexico City, hourly ozone mixing ratios could easily ex-ceeded 120 ppbv (Molina and Molina, 2004; Lei et al., 2008). The lowest monthly mean mixing ratios of O3and Oxwere
22.9±4.0 ppb in December and 39.5±4.1 ppb in January. The air in Lhasa was mostly polluted from November to January with respect to the levels of SO2(2.72±2.05 ppb)
and O3 precursors NOx (29.58±16.16 ppb) and CO
(570±300 ppb), possibly as a result of slowed removal pro-cesses, increased emissions and accumulation within the boundary layer. The mixing ratios of SO2and O3precursors
during the most polluted season in Lhasa were at least less than half of that in urban Mexico City based on yearly
aver-ages (Molina and Molina, 2004; Stephens et al., 2008), since Lhasa is less populated and industrialized than the Mexico City. In the rest of the year, SO2, CO, and NOx averaged
0.77±0.61 ppb, 363±94 ppb, and 17.10±6.19 ppb, respec-tively. The highest daily mean mixing ratios of SO2, CO,
NO, and NOx were, respectively, 14.50, 2097, 74.12, and
97.2 ppb, occurring on 18 December 2012.
Diurnal variations of O3, Ox, NO, NOx, CO, and SO2
mix-ing ratios in sprmix-ing (March–May), summer (June–August), autumn (September–November) and winter (December– February) are plotted in Fig. 5. The diurnal cycle of O3
mix-ing ratios averagely exhibited a shallow flat peak for about 4–5 h in the afternoon and a minimum in the early morning throughout the year. O3mixing ratios reached about 57 ppb
in the afternoon (12:00–17:00 LT) in spring, when meteo-rological conditions favored O3 photochemical production.
In summer and autumn, the O3mixing ratios averaged over
the afternoon were close to 48 ppb, and the lowest average value was observed in winter as 37 ppb. Nighttime O3
mix-ing ratios were much higher in sprmix-ing and summer than in autumn and winter, which was mainly attributed to a large amount of NO emissions from heating and the more stable surface layer under relatively lower wind speed in the cold weather (see Fig. 3). As for other gas pollutants, pronounced double peaks in the diurnal variations could be clearly identi-fied in all seasons. The morning peaks (around 07:00 LT) and the evening peaks (around 20:00 LT) resulted from enhanced traffic emissions in the rush hours as well as the diurnal vari-ations of the boundary layer. Mixing ratios of O3precursors
and SO2 were found to be highly variable during the rush
hours and the night, especially in autumn and winter. The ceasing of photochemical reactions and the formation of the boundary layer should be responsible for a stronger evening peak compared to the morning peak.
3.3 Influences of meteorology on gas pollutants
As for the secondary gas pollutant O3, meteorology could
exert an influence on the ambient mixing ratios by transport and accelerating or decelerating the photochemical reactions. In spring and summer, the weather was generally warm and sunny in the daytime, favoring O3 photochemical
produc-tion. No distinct dependence of O3 mixing ratios on wind
speed and wind direction was found in spring and summer (figure not shown here), suggesting that O3photochemistry
might play an important role in the observed mixing ratios. Although ozone photochemical production should be higher in summer than in spring, the average O3mixing ratio was
lower in summer than in spring as mentioned in Sect. 3.2. This suggests that the large-scale background of O3in spring
(Monks, 2000) also plays a role in the observed surface O3
in Lhasa. Under the influence of the Asian summer mon-soon, more precipitation occurs and inhibits the formation and accumulation of O3, since precipitation could efficiently
2012/6 7 8 9 10 11 12 1 2 3 4 5 0
20 40 60 80
Lhasa,Tibet
O3
2012/6 7 8 9 10 11 12 1 2 3 4 5 20
40 60 80 100
Concentration (ppb)
Ox
2012/6 7 8 9 10 11 12 1 2 3 4 5 200
400 600 800 1000
CO
2012/6 7 8 9 10 11 12 1 2 3 4 5 0
2 4 6 8
SO2
2012/6 7 8 9 10 11 12 1 2 3 4 5 0
10 20 30
NO
2012/6 7 8 9 10 11 12 1 2 3 4 5 0
20 40 60
NOx
Figure 4.Monthly averages (markers) and standard deviation (black lines) of gas pollutants in Lhasa from June 2012 to May 2013.
50 100
O 3
(ppb) 50
100
Lhasa,Tibet
50 100
50 100
50 100
Ox (ppb)
50 100
50 100
50 100
0.5 1 1.5
CO (ppmv)
0.5 1 1.5
1 2 2.5
1 2 3 3.5
2 4
SO
2
(ppb) 2
4
10 20
10 20 30
0 10 20 30
NO (ppb)
0 5 10 15
50 100 150
50 100 150 200
0:000 6:00 12:00 18:00 50
100
NOx (ppb)
0:000 6:00 12:00 18:00 50
100
0:000 6:00 12:00 18:00 50
100 150 200
0:000 6:00 12:00 18:00 0:00 50
100 150 200
Spring(MAM) Summer(JJA) Autumn(SON) Winter(DJF)
Figure 5.Average diurnal variations of O3, Ox, CO, SO2, NO, and NOxmixing ratios in four seasons (during June 2012 and May 2013) in
Table 1.Hourly average mixing ratios of the trace gases under polluted conditions (defined in this paper) and non-polluted conditions. The exceedance frequency (%) based on hourly averages is given in the brackets.
O3(ppb) NOx(ppb) CO (ppb) SO2(ppb)
Polluted Non-P Polluted Non-P Polluted Non-P Polluted Non-P Spring 83.8(1.6) 48.3 67.42(2.0) 12.43 1187(0.8) 322 – 0.61 Summer 85.5(0.1) 37.8 62.72(1.7) 14.43 1273(1.3) 407 – 0.46 Autumn – 31.6 99.38(10.9) 14.85 1567(6.5) 332 15.34(1.9) 1.19 Winter – 27.6 101.21(10.8) 13.76 1968(10.4) 345 18.31(3.9) 1.53
al., 2014). Occasionally, O3 pollution events could be
ob-served at night in spring when easterly winds above 2 m s−1 prevailed for several hours and brought in O3-rich air. A
pol-lution event is defined here as the hourly average mixing ratio exceeding 80 ppb for O3, 50 ppb for NOx, 1000 ppb for CO
and 10 ppb for SO2. The average mixing ratios of the trace
gases under the thus-defined polluted conditions, and non-polluted conditions are accordingly given in Table 1. The ex-ceedance frequency (%) based on hourly averages is given in the brackets. The occurrence of O3pollution events were
only found in spring and summer, majorly in the afternoon in spring. In autumn and winter, the transport process instead of the photochemical process probably made a major con-tribution to the ambient O3 mixing ratios. On average, the
O3 mixing ratios were found to be nearly 10 ppb higher in
the SW–NW sector than in other directions. With increasing wind speed, the mixing ratios of O3also slightly increased.
The dependence of primary gas pollutants on wind fol-lowed a similar pattern throughout the year (figure not shown here). The ambient mixing ratios of NOx, CO, and SO2were
quite high under low wind speed (smaller than 2 m s−1) and
decreased sharply as the wind speed increased. There was a slight dependence of NOx, CO, and SO2 mixing ratios on
wind direction only under low wind speed, showing a higher level in the NW–N sector, indicating that local emissions of automobiles and heating as well as incense burning to be dominant in Lhasa. High mixing ratios of primary gas pollu-tants were mainly observed in autumn and winter (Table 1). Almost 90 % of the pollution episodes occurred at calm night in autumn and winter, when chemical transformation of pri-mary gases were slowed down and the accumulation was fa-vored. The highest hourly mixing ratios of SO2, CO, NO, and
NOx occurred near midnight in December or January, and
were 63.44, 8511, 412.36, and 468.43 ppb, respectively. The hourly maxima of CO mixing ratios in Lhasa were almost comparable with that at Gucheng and Wuqing, two sites well representative of the regional pollution in the North China Plain (Lin et al., 2009; Xu et al., 2011). The occurrence fre-quency of hourly CO mixing ratios above 3000 ppb, which could approximately be taken as the average level in winter in the North China Plain, ranged from 7 to 16 %. The hourly maxima of NO and NOx mixing ratios were much higher
than that of 202 and 300 ppb in the megacity of Beijing in
the heating season from November 2007 to March 2008, de-spite that the averages in Lhasa were about 30 ppb lower dur-ing that period (Lin et al., 2011). Hourly NOxmixing ratios
above the average level of 60 ppb observed during the heat-ing season in Beijheat-ing accounted for around 70 % of the period from October to February in Lhasa. The level of SO2mixing
ratios in Lhasa was much lower, compared to a mixing ratio of several ppb in summer to tens of ppb in winter in the North China Plain (Lin et al., 2012). The occurrence frequency of hourly SO2mixing ratios above the average level of 30 ppb
in the heating season in Beijing ranged from 3 to 6 %. Gener-ally, primary gas pollution has been quite noticeable in Lhasa in the cold season.
3.4 Impacts of urbanization on air pollution
Lhasa has undergone remarkable changes in the process of urbanization in the past decades. The area of the city has cur-rently been enlarged almost twice of that as 34 km2in 1998, when the measurements of trace gases at the suburban site took place. The permanent and floating population has been explosively expanding, as well as the number of automobiles. According to the municipal statistical data, the permanent population in Lhasa was only 43 thousand in 1998, about one quarter of that now. The number of tourists has dramatically increased from 200 thousand per year in 1998 to 6.5 mil-lion in 2012. Compared to over 150 thousand automobiles in 2012, the number was less than 10 thousand in 1998. The gross domestic product of Lhasa amounted to 2.9 and 26.2 billion RMB in 1998 and 2012, respectively. The fast devel-opment during urbanization has led to a substantial growth in the demand of energy consumption. As a result, the urban heat island intensity of Lhasa has increased from 1.8◦in 1998
to 2.2◦in 2012 based on the meteorological data (Tsering et
0 5 10 15 20
1998 2012
NO
2
(ppb)
0 0.2 0.4 0.6 0.8 1
1998 2012
SO
2
(ppb)
0 200 400 600
1998 2012
CO (ppb)
0 10 20 30 40 50
1998 2012 O3
(ppb)
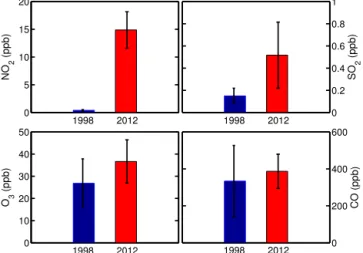
Figure 6.Comparisons of the average mixing ratios (bars) of NO2,
SO2, O3, and CO during June and September between 1998 and
2012. The black line gives the standard deviation.
Jun 6:00 12:0018:00 Jul 6:00 12:0018:00 Aug 6:00 12:0018:00 Sep 6:00 12:0018:00 0
50 100 (c)
Local Time
Hourly Maximum (ppb)
(c) (c)
(c) 19982012
0 20 40 (b) (b) (b) (b)
∆
Ozone
2012−1998
(ppb)
−1000 0 1000 2000 (a)
Lhasa,Tibet
∆
CO
2012−1998
(ppb)
Figure 7. (a)The differences in the average diurnal variations of CO mixing ratios between 1998 and 2012 in Lhasa, the dots repre-sent monthly mean values, the black lines denote the minimum and maximum of the differences;(b)for O3, the markers are the same
as that in(a);(c)the maximum O3mixing ratio for each hour in
each month, the darker color represents the values in 1998, whereas the lighter color represents the values in 2012.
pollutants has risen year by year. Undoubtedly, this would give rise to notable environment problems in Lhasa.
A comparison was made between the levels of NO2, SO2,
CO, and O3 measured during June and September,
respec-tively, in 1998 and 2012 (Fig. 6). Generally, it was found that the current average level of NO2in summertime was about
15 ppb, almost 40 times of NO2mixing ratios 15 years ago.
During the sampling period in 1998, measured NO2
mix-ing ratios never exceeded 1 ppb. In contrast, the lowest daily mean mixing ratio of NO2was around 9 ppb and the highest
value was close to 27 ppb in summer 2012, clearly indicating a marked increase in NOxemissions, which are largely from
vehicular exhaust in urban Lhasa. A comparatively smaller
change has been observed in SO2mixing ratios, with an
in-crease in the average level of SO2from about 0.15 to 0.5 ppb.
The highest hourly SO2average observed in summer 2012
was around 5 ppb. In Lhasa, SO2 is mostly from coal
burn-ing and less from vehicular exhaust and incense burnburn-ing. The demand of coal has taken a relatively slower pace than that of petroleum as fuel for automobiles. Incense burning, which gives off SO2, NOxand many other pollutants, is a tradition
for residents in Lhasa as well as ever increasing tourists who believe in Buddhism. Generally, the process of urbanization and commercialization in Lhasa has resulted in more severe NO2pollution than SO2pollution according to our
measure-ments.
CO remained almost constant between 1998 and 2012, in contrast to the dramatically increased NO2. The more
pos-sible reason for a high CO level together with a very low NO2 level in 1998 might be the difference in the emission
sources at the two sites in different years. Biomass burning was dominant in 1998, while fossil-fuel burning is domi-nant now. On average, there was no apparent diurnal cycle of CO in Lhasa in summer 1998. Nighttime CO mixing ratios were about 500 ppb, nearly 1.7 times of that during the day-time. However, distinct double peaks of CO mixing ratios in the morning and evening were observed in summer 2012 as shown in Fig. 5. The differences in the average diurnal vari-ations of CO mixing ratios between 1998 and 2012 revealed an average increase in the rush hours reaching up to about 180 ppb, while a decrease to the same extent at night where a large variability of CO mixing ratios in summer 2012 was also found (Fig. 7a). During the daytime, CO mixing ratios in summer 1998 were almost level with that in summer 2012. Such changes in the observed diurnal cycles of CO mixing ratios probably suggest increased CO emissions from auto-mobiles in the rush hours. Unfortunately, diurnal cycles of NOxmixing ratios in 1998 were not available to further
con-firm above conclusion.
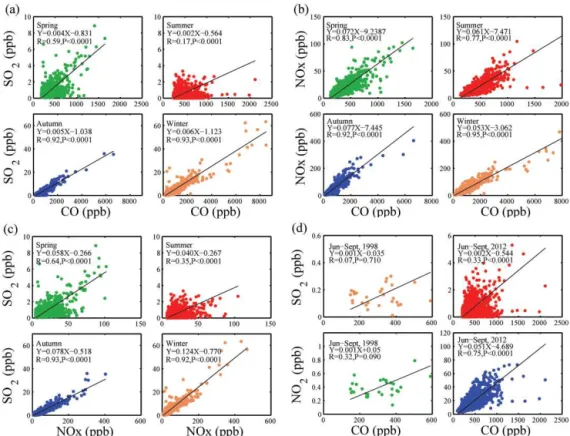
A further examination of the SO2/CO, NOx/CO, and
SO2/NOxratios was performed to cast more light on
emis-sion sources of the primary gases. Reduced major axis re-gression of the hourly average data was employed to account for measurement errors of each trace gas. It was found that the correlation coefficients (R) of SO2 with CO and SO2
with NOx were above 0.9 in a significant level (P < 0.001)
in autumn and winter 2012, while in spring less than 0.7 and in summer less than 0.4 (Fig. 8a and c). In contrast, NOxand CO mixing ratios were well correlated (Rwas 0.83,
0.77, 0.92, 0.95, respectively, in spring, summer, autumn and winter) throughout the year (Fig. 8b). The good correlations among primary gas pollutants in autumn and winter sug-gested common sources of SO2, NOxand CO in cold
sea-sons, when the emission from coal burning for heating was thought to be the major source of primary gas pollutants in Lhasa. The poor correlations of SO2with both NOxand CO
Figure 8.Reduced major axis regression of(a) SO2versus CO;(b)NOxversus CO;(c)SO2versus NOxin the four seasons during 2012
and 2013 in Lhasa using hourly average data.(d)Reduced major axis regression of SO2versus CO and NO2versus CO during June and
September, respectively, in 1998 and 2012 in Lhasa.
Jun/6 12:000 7 12:00 8 12:00 9 12:00 10 12:00 11 12:00 12 12:00 13
20 40 60 80 100 120 140
O 3
(ppb)
Figure 9.High ozone spikes around the noon during 6 and 13 June 2012 in Lhasa.
indicated that the major source of SO2 was different from
that of CO and NOx, which were mainly from gasoline and
biomass burning in warm seasons. Besides, the far more effi-cient wet deposition of SO2than CO and NOxin rainy spring
and summer could also partially explain lower correlation co-efficients of SO2with CO and SO2with NOxin spring and
summer than in autumn and winter. Figure 8d shows the scat-ter plots of SO2versus CO and NO2versus CO during June
and September in 1998 and 2012. As indicated by the lowR
value and the largeP value, no significant correlations were found between SO2, NO2and CO in 1998, which was
con-sistent with biomass to be the major source of the primary gas pollutants at that time. With the usage of fossil fuels and increasing consumptions, the mixing ratios of SO2, NO2and
CO increased dramatically and correlated more significantly with each other.
In response to increasing precursor emissions, the sec-ondary gas pollutant O3generally experienced an
enhance-ment in summer in Lhasa (Fig. 7b and c). The average increments of O3 mixing ratios from the June–September
1998 period to the June–September 2012 period were, re-spectively, about 10, 6, 23, 14 ppb in the afternoon (12:00– 17:00 LT), which is the most productive period for O3
pho-tochemical formation during a day. The buildup of O3before
the daily maximum in the afternoon (around 14:00 LT) was more efficient in summer 2012 than in summer 1998, accom-panied by a higher level of O3 peak in summer 2012. This
may imply a larger contribution is now made by O3
photo-chemical formation to the ambient O3 mixing ratios in the
daytime, especially around the noon, compared to the con-dition several years ago. With increasing O3precursor
emis-sions and sufficient ultraviolet radiation in this area, more attention should be given to O3 photochemistry in the
provided an evidence of elevated O3background in this
re-gion, implying strengthened atmospheric oxidizing capac-ity in Lhasa. However, significant local emissions of NO and NO2from vehicular exhaust and incense burning
occa-sionally resulted in almost complete consumption of surface nighttime O3.
It was also worth noting that high O3spikes in short
dura-tion (within 1 h) were observed around the noon in June 2012 as shown in Fig. 9, while none in summer 1998. After ex-cluding the possibility of an artifact being introduced by the instrument, it was believed that those high O3 spikes were
probably an indicator of highly spatial inhomogeneity in air pollution in Lhasa, and as a result of polluted air parcels ex-periencing active O3photochemical production and
happen-ing to pass by the site. This phenomenon can also be found in other seasons. High O3 basically came from the west,
occurred after a violent wind shift and the following small wind, calm wind stage. Sometimes, an increase in CO mix-ing ratios could also be observed when an O3spike appeared.
This suggested a strong photochemical origin of O3. To
thor-oughly investigate this issue, especially the cause of the large O3 difference, more measurements and analysis need to be
carried out in the future.
4 Summary
Various gas pollutants including O3, NOx, CO, and SO2were
continuously measured from June 2012 to May 2013 at an ur-ban site in Lhasa, Tibet. The seasonal variations of O3and Ox
displayed a low valley in winter and a peak in spring, when the meteorology favored O3photochemical production. The
maximum monthly mean mixing ratios of O3 and Oxwere
observed in May as 56.8±10.1 ppb and 70.1±10.6 ppb, re-spectively. The independence of O3 mixing ratios on wind
speed and wind direction in spring and summer suggested an important role of photochemistry in the observed mixing ra-tios of this secondary pollutant, while in autumn and winter, the transport process made a major contribution, showing in-creased O3mixing ratios under larger wind speed. Generally,
O3mixing ratios in the SW–NW sector were nearly 10 ppb
higher than that in other directions in autumn and winter. The diurnal cycle of O3mixing ratios averagely exhibited a
shal-low flat peak for about 4–5 h in the afternoon and a minimum in the early morning throughout the year.
Mixing ratios of primary gas pollutants peaked from November to January with a large variability as 2.72±2.05 ppb for SO2, 570±300 ppb for CO and
29.58±16.16 ppb for NOx. In the rest of the year, SO2,
CO, and NOx averaged 0.77±0.61 ppb, 363±94 ppb and
17.10±6.19 ppb, respectively. A sharp decrease in the mixing ratios of primary trace gases was observed when wind speed increased. A slight dependence of trace gas mixing ratios on wind direction was found only under low wind speed. This implied local emissions of primary gas
pol-lutants to be predominant in Lhasa. Diurnally, pronounced double peaks could be clearly identified in all seasons, as a result of enhanced traffic emissions in the rush hours as well as the diurnal variations of the boundary layer. Nighttime mixing ratios of primary gases were particularly high in autumn and winter when calm conditions usually happened. Under such circumstances, surface O3could sometimes be
totally consumed by the high level of NO.
A comparison has been made for measured NO2, SO2,
CO, and O3from June to September between 1998 and 2012,
in order to investigate the impact of rapid urbanization on air pollution in Lhasa. Mixing ratios of NO2 and SO2have
greatly increased in the past 15 years, due to a marked in-crease in their emissions. This was resulted from a substan-tial growth in the demand of energy consumption in the city and a change in using fossil fuels instead of biomass, which was also supported by the correlations among the primary gas pollutants. The distinct double-peak diurnal cycle of CO observed in summer 2012 reasonably indicated the major emission source for primary gas pollutants to be vehicular exhaust, given that there was no apparent diurnal cycle in summer 1998. In response to increased precursor emissions in the process of urbanization, there was a more efficient buildup of O3mixing ratios in the morning and a higher peak
in the afternoon in summer 2012 than in summer 1998. An enhancement in O3mixing ratios would be expected in the
photochemically active atmosphere with the ever increasing O3precursor emissions. Therefore, measures should be taken
to control emissions of primary gas pollutants in very near future in Lhasa, in order to reduce the occurrence of primary gas pollution events and mitigate the ozone problem.
Acknowledgements. This research was funded by the National
Natural Science Foundation of China (21177157), the China Special Fund for Meteorological Research in the Public Interest (GYHY201106023) and the Basic Research Fund of CAMS (2011Z003). We also thank Prof. Tang Jie for providing the observational data in summer 1998.
Edited by: H. Su
References
Bian, J. C., Pan, L. L., Paulik, L., Vömel, H., Chen, H. B., and Lu, D. R.: In situ water vapor and ozone measurements in Lhasa and Kunming during the Asian summer monsoon, Geophys. Res. Lett., 39, L19808, doi:10.1029/2012GL052996, 2012.
Bishop, G. A., Morris, J. A., Stedman, D. H., Cohen, L. H., Count-ess, R. J., CountCount-ess, S. J., Maly, P., and Scherer, S.: The effects of altitude on heavy-duty diesel truck on-road emissions, Environ. Sci. Technol., 35, 1574–1578, 2001.
Chameides, W. L., Kasibhatla, P. S., Yienger, J., and Levy II, H.: Growth of Continental-Scale Metro-Agro-Plexes, regional ozone pollution, and world food production, Science, 264, 74– 77, doi:10.1126/science.264.5155.74, 1994.
Dechen, D., Norbu, T., and Mima, P.: Correlative analysis on re-lationship between changes of several main contaminations and some meteorological elements in Lhasa urban area, J. Tibet Uni., 23, 7–11, 2008.
Guo, D., Wang, P. X., Zhou, X. J., Liu, Y., and Li, W. L.: Dynamic effects of the South Asian high on the ozone valley over the Ti-betan Plateau, Acta. Meteo. Sinica, 26, 216-228, 2012.
Haagen-Smit, A. J.: Chemistry and Physiology of Los Angeles Smog, Ind. Eng. Chem., 44, 1342–1346, 1952.
Haagen-Smit, A. J., Bradley, C. E., and Fox, M. M.: Ozone forma-tion in photochemical oxidaforma-tion of organic substances, Ind. Eng. Chem., 45, 2086-2089, doi:10.1021/ie50525a044, 1953. He, K., Huo, H., and Zhang, Q.: Urban air pollution in China:
cur-rent status, characteristics, and progress, Annual Rev. Energy En-viron., 27, 397–431, 2002.
Jacobson, M. Z.: Atmospheric pollution: history, science and regu-lation, Cambridge University Press, New York, 399 pp., 2002. Lei, W., Zavala, M., de Foy, B., Volkamer, R., and Molina, L. T.:
Characterizing ozone production and response under different meteorological conditions in Mexico City, Atmos. Chem. Phys., 8, 7571–7581, doi:10.5194/acp-8-7571-2008, 2008.
Lin, W., Zhu, T., Song, Y., Zou, H., Tang, M., Tang, X., and Hu, J.: Photolysis of surface O3and production potential of OH radicals
in the atmosphere over the Tibetan Plateau, J. Geophys. Res., 113, D02309, doi:10.1029/2007JD008831, 2008.
Lin, W., Xu, X., Ge, B., and Zhang, X.: Characteristics of gaseous pollutants at Gucheng, a rural site southwest of Beijing, J. Geo-phys. Res., 114, D00G14, doi:10.1029/2008JD010339, 2009. Lin, W., Xu, X., Ge, B., and Liu, X.: Gaseous pollutants in
Bei-jing urban area during the heating period 2007–2008: variability, sources, meteorological, and chemical impacts, Atmos. Chem. Phys., 11, 8157–8170, doi:10.5194/acp-11-8157-2011, 2011. Lin, W. L., X. B. Xu, Z. Q. Ma, Zhao, H. R., Liu, X. W., and Wang,
Y.,: Characteristics and recent trends of sulfur dioxide at urban, rural, and background sites in North China: Effectiveness of con-trol measures, J. Environ. Sci., 24, 34–49, doi:10.1016/S1001-0742(11)60727-4, 2012.
Liu, Y., Li, W. L., Zhou, X. J., and He, J. H.: Mechanism of forma-tion of the ozone valley over the Tibetan Plateau in summer — transport and chemical process of ozone, Adv. Atmos. Sci., 20, 103–109, 2003.
Ma, J., Lin, W. L., Zheng, X. D., Xu, X. B., Li, Z., and Yang, L. L: Influence of air mass downward transport on the variability of surface ozone at Xianggelila Regional Atmosphere Background Station, southwest China, Atmos. Chem. Phys., 14, 5311–5325, doi:10.5194/acp-14-5311-2014, 2014.
Molina, M. J. and Molina, L. T.: Megacities and Atmospheric Pol-lution, 1. Air & Waste Manage. Assoc., 54, 644–680, 2004. Monks, P. S.: A review of the observations and origins of the spring
ozone maximum, Atmos. Environ., 34, 3545–3561, 2000. Nagpure, A. S., Burjar, B. R., and Kumar, P.: Impact of altitude on
emission rates of ozone precursors from gasoline-driven light-duty commercial vehicles, Atmos. Environ., 45, 1413–1417, 2011.
Norsang, G., Kocbach, L., Tsoja, W., Stamnes, J. J., Dahlback, A., and Nema, P.: Ground-based measurements and modeling of so-lar UV-B radiation in Lhasa, Tibet, Atmos. Environ., 43, 1498– 1502, 2009.
Pu Bu, C. R., Sigernes, F., and Gjessing, Y.: Ground-based measure-ments of solar ultraviolet radiation in Tibet: Preliminary results, Geophys. Res. Lett., 24, 1359–1362, doi:10.1029/97GL01319, 1997.
Ren, P. B. C., Gjessing, Y., and Sigernes, F.: Measurements of solar ultraviolet radiation on the Tibetan Plateau and comparisons with discrete ordinate method simulations, J. Atmos. Sol. Terr. Phys., 61, 425–446, 1999.
Seinfeld, J. H. and Pandis, S. N.: Atmospheric Chemistry and Physics: from Air Pollution to Climate Change, Wiley Inter-science, New Jersey, 1225 pp., 2006.
Shi, G. Y., Bai, Y. B., Iwasaka, Y., and Ohashi, T.: A balloon measurement of the ozone vertical distribution over Lhasa, Adv. Earth Sci., 15, 522–524, 2000.
Stephens, S., Madronich, S., Wu, F., Olson, J. B., Ramos, R., Re-tama, A., and Munoz, R.: Weekly patterns of Mexico City’s sur-face mixing ratios of CO, NOx, PM10 and O3 during 1986–
2007, Atmos. Chem. Phys., 8, 5313–5325, doi:10.5194/acp-8-5313-2008, 2008.
Tang, J., Zhou, L. X., Zheng, X. D., Zhou, X. J., Shi, G. Y., and Suolang, D. J.: The observational study of surface ozone at Lhasa suburb in summer 1998, Act. Meteo. Sinica, 60, 221–229, 2002. Tang, Q. and Prather, M. J.: Tropospheric column ozone: match-ing individual profiles from Aura OMI and TES with a chemistry-transport model, Atmos. Chem. Phys., 12, 10441– 10452, doi:10.5194/acp-12-10441-2012, 2012.
Tsering, P., Nima, Y., and Lhak, P.: Analysis of urban heat island ef-fect in Lhasa city, Plat. Mount. Meteorol. Res., 34, 52–56, 2014. Tobo, Y. Iwasaka, Y., Shi, G. Y., Kim, Y. S., Tamura, K., and Ohashi, T.: Summertime “ozone valley” over the Tibetan Plateau derived from ozonesondes and EP/TOMS data, Geophys. Res. Lett., 35, L16801, doi:10.1029/2008GL034341, 2008.
USEPA: Quality Assurance Handbook for Air Pollution Measure-ment Systems, Volume II, Ambient Air Quality Monitoring Pro-gram, EPA-454/B-08-003, 2008.
Xu, W. Y., Zhao, C. S., Ran, L., Deng, Z. Z., Liu, P. F., Ma, N., Lin, W. L., Xu, X. B., Yan, P., He, X., Yu, J., Liang, W. D., and Chen, L. L.: Characteristics of pollutants and their correlation to meteorological conditions at a suburban site in the North China Plain, Atmos. Chem. Phys., 11, 4353–4369, doi:10.5194/acp-11-4353-2011, 2011.
Yu, X. L., Tang, J., Zhou, L. X., Xue, H. S., and Zhou, X. J.: Emis-sion characteristics and sources of non-methane hydrocarbons at Lhasa Area, Act. Sci. Circum., 21, 203–207, 2001.