ACPD
14, 9903–9950, 2014Regional-scale simulations of fungal
spore aerosols
M. Hummel et al.
Title Page
Abstract Introduction
Conclusions References
Tables Figures
◭ ◮
◭ ◮
Back Close
Full Screen / Esc
Printer-friendly Version Interactive Discussion
Discussion
P
a
per
|
D
iscussion
P
a
per
|
Discussion
P
a
per
|
Discuss
ion
P
a
per
|
Atmos. Chem. Phys. Discuss., 14, 9903–9950, 2014 www.atmos-chem-phys-discuss.net/14/9903/2014/ doi:10.5194/acpd-14-9903-2014
© Author(s) 2014. CC Attribution 3.0 License.
Atmospheric Chemistry and Physics
Open Access
Discussions
This discussion paper is/has been under review for the journal Atmospheric Chemistry and Physics (ACP). Please refer to the corresponding final paper in ACP if available.
Regional-scale simulations of fungal
spore aerosols using an emission
parameterization adapted to local
measurements of fluorescent biological
aerosol particles
M. Hummel1, C. Hoose1, M. Gallagher2, D. A. Healy3, J. A. Huffman4, D. O’Connor3, U. Pöschl5, C. Pöhlker5, N. H. Robinson2, M. Schnaiter1, J. R. Sodeau3, E. Toprak1, and H. Vogel1
1
Institute for Meteorology and Climate Research, Karlsruhe Institute of Technology, Karlsruhe, Germany
2
The Centre for Atmospheric Sciences, The University of Manchester, Manchester, UK
3
Centre for Research into Atmospheric Chemistry, Department of Chemistry, University College Cork, Cork, Ireland
4
Department of Chemistry & Biochemistry, University of Denver, Denver, Colorado, USA
5
ACPD
14, 9903–9950, 2014Regional-scale simulations of fungal
spore aerosols
M. Hummel et al.
Title Page
Abstract Introduction
Conclusions References
Tables Figures
◭ ◮
◭ ◮
Back Close
Full Screen / Esc
Printer-friendly Version Interactive Discussion
Discussion
P
a
per
|
D
iscussion
P
a
per
|
Discussion
P
a
per
|
Discuss
ion
P
a
per
|
Received: 18 February 2014 – Accepted: 4 April 2014 – Published: 16 April 2014
Correspondence to: M. Hummel ([email protected])
ACPD
14, 9903–9950, 2014Regional-scale simulations of fungal
spore aerosols
M. Hummel et al.
Title Page
Abstract Introduction
Conclusions References
Tables Figures
◭ ◮
◭ ◮
Back Close
Full Screen / Esc
Printer-friendly Version Interactive Discussion
Discussion
P
a
per
|
D
iscussion
P
a
per
|
Discussion
P
a
per
|
Discuss
ion
P
a
per
|
Abstract
Fungal spores as a prominent type of primary biological aerosol particles (PBAP) have been incorporated into the COSMO-ART regional atmospheric model, using and com-paring three different emission parameterizations. Two literature-based emission rates derived from fungal spore colony counts and chemical tracer measurements were used 5
as a parameterization baseline for this study. A third, new emission parameterization was adapted to field measurements of fluorescent biological aerosol particles (FBAP) from four locations across Northern Europe. FBAP concentrations can be regarded as a lower estimate of total PBAP concentrations. Size distributions of FBAP often show a distinct mode at approx. 3 µm, corresponding to a diameter range character-10
istic for many fungal spores. Previous studies have suggested the majority of FBAP in several locations are dominated by fungal spores. Thus, we suggest that simu-lated fungal spore concentrations obtained from the emission parameterizations can be compared to the sum of total FBAP concentrations. A comparison reveals that pa-rameterized estimates of fungal spore concentrations based on literature numbers un-15
derestimate measured FBAP concentrations. In agreement with measurement data, the model results show a diurnal cycle in simulated fungal spore concentrations, which may develop partially as a consequence of a varying boundary layer height between day and night. Measured FBAP and simulated fungal spore concentrations also corre-late similarly with simucorre-lated temperature and humidity. These meteorological variables, 20
together with leaf area index, were chosen to drive the new emission parameterization discussed here. Using the new emission parameterization on a model domain cover-ing Western Europe, fungal spores in the lowest model layer comprise a fraction of 15 % of the total aerosol mass over land and reach average number concentrations of 26 L−1. The results confirm that fungal spores and biological particles may account for 25
ACPD
14, 9903–9950, 2014Regional-scale simulations of fungal
spore aerosols
M. Hummel et al.
Title Page
Abstract Introduction
Conclusions References
Tables Figures
◭ ◮
◭ ◮
Back Close
Full Screen / Esc
Printer-friendly Version Interactive Discussion
Discussion
P
a
per
|
D
iscussion
P
a
per
|
Discussion
P
a
per
|
Discuss
ion
P
a
per
|
1 Introduction
Particles emitted from biological sources are a miscellaneous and omnipresent group of the Earth’s atmospheric aerosols (Elbert et al., 2007; Després et al., 2012). These primary biological aerosol particles (PBAP) can be transported over large distances and their impacts are studied by various fields of research, such as atmosphere sci-5
ence, agricultural research, biogeography and public health (Burrows et al., 2009). PBAP are solid airborne particles of biological origin and include microorganisms or reproductive units (e.g. bacteria, fungi, spores, pollen or viruses) as well as excre-tions and fragments of biological organisms (e.g. detritus, microbial fragments or leaf debris) (Després et al., 2012). Typical sizes range from<0.3 µm for viruses to diam-10
eters of single bacteria (0.25–3 µm), bacteria agglomerates (3–8 µm), fungal spores (1–30 µm), and up to 1–100 µm for airborne pollen (Jones and Harrison, 2004; Shaffer and Lighthart, 1997; Després et al., 2012).
The share of atmospheric aerosol composition belonging to PBAP is large and pos-sibly underestimated (Jaenicke et al., 2007), but is also very uncertain. Estimates of 15
relative PBAP fraction from global models and local measurements reveal large diff er-ences between reports. On one hand, the calculated global number concentration of PBAP (zonal annual mean surface concentrations of 10−2–10−1cm−3) is below min-eral dust (65 cm−3) or soot (1000 cm−3) concentrations by several orders of magnitude (Hoose et al., 2010b). Modeling studies yielded global source strengths of∼10 Tg yr−1 20
(plant debris and fungal spores, Winiwarter et al., 2009), 56 Tg yr−1 (Penner, 1995), 78 Tg yr−1 (bacteria, fungal spores and pollen, Hoose et al., 2010a), 164 Tg yr−1 (Ma-howald et al., 2008) and 312 Tg yr−1(bacteria, fungal spores and pollen, Jacobson and Streets, 2009) for different PBAP components. On the other hand, measurements of continental boundary layer air in remote vegetated regions indicate that the mass frac-25
ACPD
14, 9903–9950, 2014Regional-scale simulations of fungal
spore aerosols
M. Hummel et al.
Title Page
Abstract Introduction
Conclusions References
Tables Figures
◭ ◮
◭ ◮
Back Close
Full Screen / Esc
Printer-friendly Version Interactive Discussion
Discussion
P
a
per
|
D
iscussion
P
a
per
|
Discussion
P
a
per
|
Discuss
ion
P
a
per
|
Like all other aerosol particles, PBAP can influence the Earth’s climate by forcing the radiation budget directly (by absorbing or scattering radiation) and indirectly (by af-fecting cloud microphysics) (Forster et al., 2007). The direct PBAP effect on climate is difficult to estimate, because evaluations of the atmospheric PBAP concentration vary by several orders of magnitude when taking spatial and temporal divergences into ac-5
count. Describing the radiative properties of PBAP is complicated, because their size ranges from fine to coarse (up to 100 µm in diameter) and in many cases their shapes are non-spherical and not accurately known. Hence, the applicability of Mie scattering theory is limited (Després et al., 2012). However, the direct PBAP effect on global and regional climate is generally assumed to be small due to low average concentrations, 10
in contrast to the numbers of sub-micron absorbing and scattering aerosols. The indi-rect PBAP effect on climate is caused by PBAP that act as cloud condensation nuclei (CCN) and/or as ice nuclei (IN). Generally, changing aerosol populations by increas-ing nuclei concentrations or behavior can alter the microphysical properties of clouds, thus influencing the climate system (Forster et al., 2007). Most PBAP are assumed 15
to be good CCN, because their surface area is large compared to most other aerosol species (Petters and Kreidenweis, 2007; Ariya et al., 2009) and thus may act as so-called giant CCN (Pöschl et al., 2010). Here, the Kelvin effect can be neglected when describing water vapor condensation, and thus activation and growth proceeds quickly (Pope, 2010). Some particles of biological origin (e.g.P. syringae bacteria and some 20
fungal species) have been found to efficiently nucleate ice growth at relatively high tem-peratures (Després et al., 2012; Murray et al., 2012; Hoose and Möhler, 2012; Morris et al., 2004, 2013; Haga et al., 2013). Biological particles have been observed ubiqui-tously in precipitation, fog, and snowpack (e.g. Christner et al., 2008), in clouds from airborne measurements (e.g. DeLeon-Rodriguez et al., 2013) and have been shown 25
ACPD
14, 9903–9950, 2014Regional-scale simulations of fungal
spore aerosols
M. Hummel et al.
Title Page
Abstract Introduction
Conclusions References
Tables Figures
◭ ◮
◭ ◮
Back Close
Full Screen / Esc
Printer-friendly Version Interactive Discussion
Discussion
P
a
per
|
D
iscussion
P
a
per
|
Discussion
P
a
per
|
Discuss
ion
P
a
per
|
regimes colder than that, mineral dust particles and other ice nucleators are also active and the relative atmospheric abundance of PBAP is probably too small to contribute significantly to formation and evolution of these colder clouds.
The methods for identifying and detecting PBAP are challenging and many diff er-ent PBAP can introduce significant detection biases. Particle diameter often plays 5
heavily into PBAP detection and characterization, and it should be noted that large discrepancies can exist between physical and aerodynamic diameter measurements (Huffman et al., 2010; Reponen et al., 2001). PBAP concentrations can be obtained either by online techniques, in which samples are analyzed by advanced instrumenta-tion in real-time, or by offline measurement techniques. If measured offline, samples 10
of airborne biological particles are stored under refrigeration and common methods include analysis by microscopy (stained or unmodified), by cultivation of the sample on growth media, and by amplification and detection of genetic material by sequenc-ing or electrophoretic separation. Chemical and optical properties of PBAP samples or their tracers can be monitored in real time by: chromatography, mass spectrome-15
try, fluorescence spectrophotometry, LIDAR, and flow cytometry. Short overviews of PBAP analysis techniques have been given by Caruana et al. (2011) and Després et al. (2012).
This paper focuses on the mesoscale simulation of atmospheric concentrations of fungal spores. The COSMO-ART limited-area model is used for the simulations and 20
the setup includes a model domain covering most parts of Europe with a horizontal resolution of 14 km. Two different fungal spore emission parameterizations (Heald and Spracklen, 2009; Sesartic and Dallafior, 2011) are tested by comparing their number concentrations to online laser-induced fluorescence (LIF) measurements of airborne fluorescent biological particles. Additionally, a new emission parameterization adapted 25
ACPD
14, 9903–9950, 2014Regional-scale simulations of fungal
spore aerosols
M. Hummel et al.
Title Page
Abstract Introduction
Conclusions References
Tables Figures
◭ ◮
◭ ◮
Back Close
Full Screen / Esc
Printer-friendly Version Interactive Discussion
Discussion
P
a
per
|
D
iscussion
P
a
per
|
Discussion
P
a
per
|
Discuss
ion
P
a
per
|
which may broadly be considered a lower limit for the abundance of PBAP (Huffman et al., 2010; Pöhlker et al., 2012). FBAP were measured at four different locations (Ta-ble 1) concurrently during three focus periods in summer and fall 2010. The resulting FBAP size distribution is usually dominated by particles in the range from 2 µm to 4 µm, which is consistent with the size of fungal spores (Huffman et al., 2010, 2012, 2013; 5
Pöschl et al., 2010, Healy et al., 2012a; Toprak and Schnaiter, 2013). Further, the con-centration of FBAP in a given air-mass is generally considered to underestimate PBAP concentration due to biological particles that exhibit very low levels of fluorescent emis-sion (Huffman et al., 2012). To some extent, non-biological aerosol components can also be part of the fluorescence signal for fine particles (∼1 µm) (Huffman et al., 2010; 10
Toprak and Schnaiter, 2013). These factors contribute uncertainty to the parameteriza-tions discussed here, however the overall ability of LIF techniques to provide real-time FBAP measurements allows first approximation measurements that can be enlighten-ing.
2 Methodology 15
2.1 Model description
The COSMO-ART atmospheric model system is based on the forecast model of the German weather service, combined with an online coupled module for simulating the spatial and temporal distribution of reactive gaseous and particulate components (Vogel et al., 2009). Additionally, fungal spores are incorporated as an independent, 20
monodisperse particle class (dp=3 µm).
ACPD
14, 9903–9950, 2014Regional-scale simulations of fungal
spore aerosols
M. Hummel et al.
Title Page
Abstract Introduction
Conclusions References
Tables Figures
◭ ◮
◭ ◮
Back Close
Full Screen / Esc
Printer-friendly Version Interactive Discussion
Discussion
P
a
per
|
D
iscussion
P
a
per
|
Discussion
P
a
per
|
Discuss
ion
P
a
per
|
the fungal spore number concentration is calculated by:
ρdΨ
dt =−∇ ·FT− ∂
∂zFS−λΨ−
1
N ∂
∂zFE (1)
with the number mixing ratio of fungal spores being
Ψ =Nf
N, (2)
and the number concentration of fungal sporesNf, the total number of particles and air
5
moleculesN per m3, the air densityρ, the turbulent fluxFT, the sedimentation fluxFS,
a washout coefficientλand a vertical emission fluxFE(Vogel et al., 2008). The turbulent
flux is calculated byFT=ρv′Ψ′, incorporating the turbulent fluctuations of wind speed
v′and fungal spore number mixing ratioΨ′. Fungal spore sedimentation is calculated byFS=ρΨvs. The fungal spore settling velocityvsis calculated by applying the
volume-10
equivalent particle diameterde=2 3
p
a2b, witha=2 µm andb=5 µm (Yamamoto et al.,
2012) being the major and minor radius of a prolate spheroid. This results in:
v2 s =
4ρpdeg
3ρcd
(3)
whereρp=1 g cm
−3
is the spore density (Trail et al., 2005; Gregory, 1961) andcd the
drag coefficient (Aylor, 2002). The calculation of the washout coefficient is based on the 15
assumption of raindrops being much larger than aerosol particles and having a much higher terminal fall velocity. It yields:
λ(dp)=
∞ Z
0
π
4D
2
ACPD
14, 9903–9950, 2014Regional-scale simulations of fungal
spore aerosols
M. Hummel et al.
Title Page
Abstract Introduction
Conclusions References
Tables Figures
◭ ◮
◭ ◮
Back Close
Full Screen / Esc
Printer-friendly Version Interactive Discussion
Discussion
P
a
per
|
D
iscussion
P
a
per
|
Discussion
P
a
per
|
Discuss
ion
P
a
per
|
(Rinke, 2008). dp and DD are the diameters of particles and raindrops, respectively,
vt(DD) is the terminal fall velocity,E is a collision efficiency andn(DD) is the size
distri-bution of the raindrop number concentration. For fungal spores with a spherical diam-eter of 3 µm, the collision efficiencyE with 0.1 mm and 1 mm droplets is approximately 0.085 and 0.3, respectively.
5
Adapting the model for simulations of fungal spores requires inclusion of an emission fluxFEin the source term of Eq. (1) by means of an emission parameterization which will be described in the next section.
Together with fungal spore simulations COSMO-ART is used to compute the mass concentration of major atmospheric aerosol components. Hence, the proportion of fun-10
gal spores with respect to the dry aerosol mass can be estimated (Sect. 3.3). In ad-dition to primary aerosol emissions, further gaseous emissions given by the EMPA emission dataset (Sect. 2.3) are taken into account. Partitioning of inorganic aerosol components between the gases at particulate phase is simulated by the ISORROPIA II module (Fountoukis and Nenes, 2007). Condensation on fungal spore aerosols is 15
not included. The contribution of secondary organic aerosols (SOA) to the particles is handled by condensation of oxidized volatile organic compounds as described by Schell et al. (2001). When soot aerosols are not involved as a solid nuclei enabling condensation, clusters build by gas-to-particle conversion via binary nucleation of sul-furic acid and water. They are computed as an individual particle mode. All aerosol 20
particles including these chemical compounds are assumed to be internally mixed. A soot mode without mixing of other chemical compounds is included as particles that are emitted directly into the atmosphere. Anthropogenic primary aerosols (aPA) in the coarse size range (<10 µm) are treated as a separate mode. Detailed descriptions are given in Vogel et al. (2009). Furthermore, sea salt is included in the model simulation 25
ACPD
14, 9903–9950, 2014Regional-scale simulations of fungal
spore aerosols
M. Hummel et al.
Title Page
Abstract Introduction
Conclusions References
Tables Figures
◭ ◮
◭ ◮
Back Close
Full Screen / Esc
Printer-friendly Version Interactive Discussion
Discussion
P
a
per
|
D
iscussion
P
a
per
|
Discussion
P
a
per
|
Discuss
ion
P
a
per
|
2.2 Emission parameterization of fungal spores
In literature, a constant emission rate was used as input of a global chemical transport model to represent the magnitude and range of measured concentrations of manni-tol as a molecular tracer for basidiospores (Elbert et al., 2007; Heald and Spracklen, 2009). Broad geographical differences can be included in the emission flux by distin-5
guishing between ecosystems. While reviewing the measured data available on mea-sured fungal spore concentrations, Sesartic and Dallafior (2011) calculated number fluxes of fungal spore emissions for six different ecosystems (defined by Olson et al., 2001). Four of these emission fluxes were included into COSMO-ART, and coupled to ecosystem definitions by the GLC2000 (Global Landcover 2000 Database) (forest and 10
shrubs) and Ramankutty et al. (2008) (grassland and crops). The sum of these fluxes, as defined by Sesartic and Dallafior (2011), are emitted from the land area fractionEi
of each ecosystemi (Pni Ei =1 fornnumber of ecosystems), gives the total emission fluxFE=FS&Din m
−2
s−1of Eq. (1) for fungal spores:
FS&D= 214 m
−2s−1E
forest+1203 m
−2s−1E
shrub (5)
15
+165 m−2s−1Egrassland+2509 m
−2
s−1Ecrop
Additionally, a second emission parameterization was tested, which varies as a func-tion of meteorological and surface condifunc-tions. Jones and Harrison (2004) reviewed the relations determined when analyzing the observed fungal spore concentrations 20
and atmospheric factors. Seasonal variations can be explained by changes in the leaf area index (LAI). This was verified by correlation to the observed mannitol concen-trations. Among the drivers of day-to-day variations, specific humidity (qv) correlates
best with the mannitol concentrations (Heald and Spracklen, 2009). It was argued that though other atmospheric factors (e.g. temperature) may actually drive the correla-25
ACPD
14, 9903–9950, 2014Regional-scale simulations of fungal
spore aerosols
M. Hummel et al.
Title Page
Abstract Introduction
Conclusions References
Tables Figures
◭ ◮
◭ ◮
Back Close
Full Screen / Esc
Printer-friendly Version Interactive Discussion
Discussion
P
a
per
|
D
iscussion
P
a
per
|
Discussion
P
a
per
|
Discuss
ion
P
a
per
|
fungal spore concentrations matching the mean mannitol concentrations (Heald and Spracklen, 2009). In order to fit to the emission flux specified in Hoose et al. (2010a) for a spore diameter of 5 µm, a constantcis set toc=2315 m−2s−1to be appropriate for fungal spores with 3 µm in diameter. Based on the emission flux in Eq. (1), this gives an alternative sourceFE=FH&Sof fungal spores in m
−2
s−1: 5
FH&S=c
LAI LAImax
qv
qv, max
(6)
LAI is the leaf area index,qvis the specific humidity at the surface, and their scaling
fac-tors adapted from tropical rain forest conditions are assumed to be LAImax=5 m 2
m−2 andqv, max=1.5×10
−2
kg kg−1. In the COSMO-ART simulations LAI is horizontally dis-tributed according to GLC2000 containing monthly variation andqvis provided by the
10
model as a meteorological variable.
2.3 Model domain and input data
The COSMO-ART mesoscale model system is driven by initial and boundary data for meteorological and aerosol and chemistry conditions. The meteorological conditions are updated every six hours and result from interpolation of the coarse grid operational 15
atmospheric model analysis of the ECMWF (European Centre for Medium-Range Weather Forecasts). No initial and boundary concentrations are predefined for aerosols or gases. Therefore, all gaseous species are set to a climatological, homogeneously distributed initial concentration. The emission rates for chemical compounds included in the ART part are updated hourly. They are provided by EMPA (Swiss Federal Labo-20
ACPD
14, 9903–9950, 2014Regional-scale simulations of fungal
spore aerosols
M. Hummel et al.
Title Page
Abstract Introduction
Conclusions References
Tables Figures
◭ ◮
◭ ◮
Back Close
Full Screen / Esc
Printer-friendly Version Interactive Discussion
Discussion
P
a
per
|
D
iscussion
P
a
per
|
Discussion
P
a
per
|
Discuss
ion
P
a
per
|
as parameterizations based on meteorological and surface conditions. Land use data and constant surface properties are derived from the GLC2000 database (Bartholomé and Belward, 2005). All parameters are post-processed to the rotated spherical co-ordinate system of COSMO-ART (Doms and Schättler, 2002). For the purpose of this paper, the model domain covers most parts of Western Europe from mainland Portugal 5
to northern Finland, the longitudinal extension being 2849 km the latitudinal extension being 3803 km with a horizontal spacing of 0.125◦ (=b14 km) on a rotated grid. In ver-tical direction the model reaches up to an altitude of about 24 km distributed over 40 terrain-following levels. The time stepping of the Runge–Kutta dynamical core is set to 30 s.
10
2.4 Auto-fluorescence measurements
Ambient aerosols can be roughly classified as biological or not by interrogating parti-cles at characteristic wavelengths of excitation and measuring the resultant emission in a process called ultraviolet light-induced fluorescence (UV-LIF) (e.g. Hairston et al., 1997; Pan et al., 1999). In particular, the region of fluorescent excitation near 360 nm is 15
often used as characteristic of certain cell metabolites present in all living cells, includ-ing riboflavin and reduced pyridine nucleotides (e.g. NAD(P)H). The region of excitation near 270 nm includes certain amino acids (e.g. tryptophan) contained in all proteins. However, many other biological fluorophores exist and the relationship between the measured fluorescence of complex biological particles and fluorophore assignment is 20
very complex (Pöhlker et al., 2012, 2013).
Two instrument types were utilized at four locations for the comparison discussed in this paper. The ultraviolet aerodynamic particle sizer (UV-APS; TSI, Inc., Shore-view, MN, USA) measures particle size aerodynamically, excites individual particles using a single Nd:YAG laser pulse at 355 nm, and detects integrated fluorescent emis-25
ACPD
14, 9903–9950, 2014Regional-scale simulations of fungal
spore aerosols
M. Hummel et al.
Title Page
Abstract Introduction
Conclusions References
Tables Figures
◭ ◮
◭ ◮
Back Close
Full Screen / Esc
Printer-friendly Version Interactive Discussion
Discussion
P
a
per
|
D
iscussion
P
a
per
|
Discussion
P
a
per
|
Discuss
ion
P
a
per
|
particle size optically and excites individual particles via two sequential pulses from a Xe-flash lamp, at 280 and 370 nm, respectively (e.g. Kaye et al., 2005; Foot et al., 2008). Fluorescence for each particle is then measured in one of two wavelength regions, resulting in three measured fluorescence parameters for each WIBS instru-ment named FL1_280, FL2_280, and FL3_370. See Gabey et al. (2010) and Robinson 5
et al. (2013) for more details, including slight differences in WIBS-3 and WIBS-4 mod-els. The number concentration of FBAP can be written asNF,cwith subscripts referring to fluorescent and coarse particle size. The differences in the pairs of wavelengths used for fluorescence, as well as the possible differences in sensitivity between instruments, suggest that the term “FBAP” as determined by each instrument is not rigorously in-10
terchangeable, and it is critical to understand the method of analysis when comparing datasets. For example, the ambient FBAP number concentration as determined by UV-APS has been shown to be qualitatively consistent with the number concentration of particles that fluorescence in the WIBS FL3_370 channel, while theNF,c comparison
between UV-APS and WIBS FL1_280 channel is relatively poor (Healy et al., 2014). 15
Here we use the term FBAP from WIBS data to mean particles that exhibit fluorescence simultaneously in both channels FL1_280 and FL3_370.
Particle size can aide differentiation between biological particles classes observed, however the selectivity based on size alone is very uncertain. For example, and to a rough first approximation, it may be true that many FBAP∼1 µm are single bacterial 20
particles and that many FBAP 2–6 µm may be fungal spores or bacterial agglomerates (Shaffer and Lighthart, 1997). However, biological species can vary widely, and other FBAP classes (e.g. fragments of larger PBAP, internal components of burst pollen, the presence of other biological species) confound the simple assignment of FBAP based on size (Després et al., 2012).
25
ACPD
14, 9903–9950, 2014Regional-scale simulations of fungal
spore aerosols
M. Hummel et al.
Title Page
Abstract Introduction
Conclusions References
Tables Figures
◭ ◮
◭ ◮
Back Close
Full Screen / Esc
Printer-friendly Version Interactive Discussion
Discussion
P
a
per
|
D
iscussion
P
a
per
|
Discussion
P
a
per
|
Discuss
ion
P
a
per
|
(Huffman et al., 2010), select oxidized organic aerosol particles (e.g. absorbing brown carbon particles) (Bones et al., 2010; Lee et al., 2013), and some humic-like sub-stances (Gabey et al., 2013). For example, at the rural, elevated site of Puy de Dôme, France, WIBS-3 FBAP measurements were compared to results from fluorescence mi-croscopy paired with staining of fungal spores and bacteria. These results suggest that 5
the real-time UV-LIF measurements indeed track the diurnal cycle of the bacteria con-centration, but that non-biological particles still contributed significantly to fluorescent particle number (Gabey et al., 2013).
Virtually every ambient measurement study performed with the WIBS or UV-APS to date has shown a dominant FBAP mode peaking at 2–4 µm in size (Huffman et al., 10
2010, 2012, 2013; Gabey et al., 2010; Toprak and Schnaiter, 2013). For example, the FBAP size distributions measured at each of the four sampling locations discussed here is shown in Fig. 1, highlighting the common presence of the 2–4 µm peak. It has been proposed that fungal spores and bacteria agglomerates are the most dominant biological aerosols in this size range (Jones and Harrison, 2004; Després et al., 2012; 15
Fang et al., 2008) and that the FBAP signal in this size range is typically dominated by fungal spores. This was corroborated in more detail for a remote Amazonian site using FBAP analysis along with fluorescence microscopy of stained filter samples (Huffman et al., 2012), but has not yet been rigorously tested in other environments. Other mi-croscopy and DNA-based studies have suggested that fungal spores constitute the 20
ACPD
14, 9903–9950, 2014Regional-scale simulations of fungal
spore aerosols
M. Hummel et al.
Title Page
Abstract Introduction
Conclusions References
Tables Figures
◭ ◮
◭ ◮
Back Close
Full Screen / Esc
Printer-friendly Version Interactive Discussion
Discussion
P
a
per
|
D
iscussion
P
a
per
|
Discussion
P
a
per
|
Discuss
ion
P
a
per
|
3 Results
3.1 Comparison of time series of measured FBAP and simulated fungal spores
Fungal spore concentrations simulated using the emission flux given in Eqs. (5) and.(6) according to Heald and Spracklen (2009) and Sesartic and Dallafior (2011) were first compared to FBAP measurements without further adjustment. An overview of time 5
series for all measurements and simulations discussed here is shown in Fig. 2 by a box-and-whiskers plot. Time periods for each of three case studies (Table 1) were chosen as exemplary periods when UV-LIF instruments were operating simultaneously at a minimum of two locations, with no requirements applied with respect to environ-mental conditions. For the statistical analysis, FBAP measurements were averaged 10
over one hour periods in order to be consistent to the model output time steps. For most time periods at Karlsruhe and Hyytiälä the simulated fungal spore concentrations are smaller than the measured FBAP concentrations (Fig. 2). This difference is high-est at Hyytiälä in August 2010. At Hyytiälä in July and at Manchhigh-ester and Killarney in August, the Heald and Spracklen (2009) emission (FH&S) gives median concentration
15
values which agree reasonably well with the measurements. During October, the fun-gal spores number concentrations based on constant emission fluxes given by Sesartic and Dallafior (2011) (FS&D) agree best with the measured FBAP concentrations.
Long-term analysis of FBAP measurements, including periods at the Karlsruhe (Toprak and Schnaiter, 2013) and Hyytiälä site (Schumacher et al., 2013) discussed here, shows an 20
annual cycle of average FBAP number concentrations peaking in summer and lowest in winter. Thus, a simulation based on a constant emission flux may not be appropriate to reproduce the FBAP concentrations.
Figures 3 to 6 show a series of one-week long case studies, each representing two measurement sites. The plots show comparisons between simulation and measure-25
ACPD
14, 9903–9950, 2014Regional-scale simulations of fungal
spore aerosols
M. Hummel et al.
Title Page
Abstract Introduction
Conclusions References
Tables Figures
◭ ◮
◭ ◮
Back Close
Full Screen / Esc
Printer-friendly Version Interactive Discussion
Discussion
P
a
per
|
D
iscussion
P
a
per
|
Discussion
P
a
per
|
Discuss
ion
P
a
per
|
figures and are not included in the analysis. The total precipitation calculated by the model is shown by gray bars with the ordinate on the right hand side of the figure. The simulated boundary layer height is also included at the bottom of each panel in the figures.
Measured FBAP number concentrations often exhibit distinct diel (24 h) cycles with 5
a maximum in the morning hours or around midnight and a minimum around noon. These features have been consistently reported by most studies discussing tempo-ral behavior of FBAP (Gabey et al., 2010; Huffman et al., 2010, 2012; Toprak and Schnaiter, 2013). Here, a similar diel cycle is frequently obtained from simulations, and the simulated fungal spore concentrations often anti-correlate with the simulated 10
boundary layer height (hPBL) (Figs. 3 to 6). The measured FBAP concentrations
of-ten qualitatively track the general pattern of simulatedhPBL, however the magnitude of
concentration change and the timing is often not consistent. For example, on 24 and 25 July at the Karlsruhe site (Fig. 3a) a boundary layer compression during the night leads to an increase in the simulated fungal spore concentrations by a factor of ∼4, 15
and during day the concentrations decreases as the boundary layer rises again. In this case, the measured FBAP concentrations are in relatively good agreement with the simulated fungal spore numbers, with NF,c dropping slowly during the day on 24 and
27 July, and to a rate closer to the simulations on 25 July. This suggests that FBAP concentrations were likely influenced, at least partially, by the changing boundary layer 20
height, though diel changes in biological emission are also likely to influence diel FBAP patterns. A similar temporal pattern in simulated fungal spore concentrations is shown in Fig. 4a, where a maximum inhPBL at 12 and 13 October occurs approximately
co-incident with a minimum in the simulated number concentration. In this case, however, the measured FBAP concentrations do not reflect the diel pattern of the simulations. 25
ACPD
14, 9903–9950, 2014Regional-scale simulations of fungal
spore aerosols
M. Hummel et al.
Title Page
Abstract Introduction
Conclusions References
Tables Figures
◭ ◮
◭ ◮
Back Close
Full Screen / Esc
Printer-friendly Version Interactive Discussion
Discussion
P
a
per
|
D
iscussion
P
a
per
|
Discussion
P
a
per
|
Discuss
ion
P
a
per
|
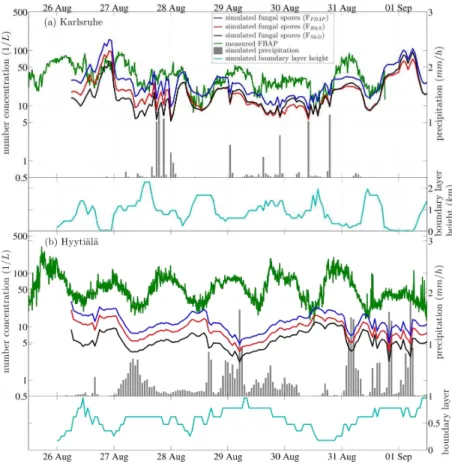
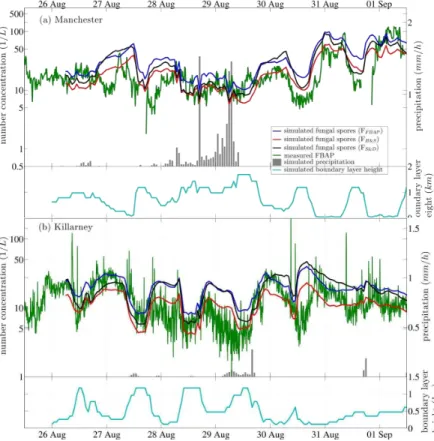
simulated concentrations are in good agreement. Distinct minima and maxima clearly anti-correlate with the minima and maxima of the boundary layer height. In contrast, during the same time period in Killarney (Fig. 6b), small changes in the boundary layer were simulated along with minor changes in fungal spore concentrations. In this case, measured FBAP concentrations qualitatively reflect the same temporal pattern of num-5
ber concentration, but show poor trend consistency withhPBL. The magnitude of diel
FBAP concentration change was similar throughout the week shown, whereas hPBL
showed large diel variations between 26 and 30 August and relatively no change in
hPBL from 30 August to 1 September. Figures 3b, 4b, and 5b also show diel FBAP
concentration changes that correlate poorly with simulatedhPBL. We conclude that (i)
10
simulated fungal spore concentrations are sensitive to changes in the simulated bound-ary layer height, by extension, that (ii) diel cycles of FBAP concentrations are likely to be partially influenced by diel cycles of boundary layer height, but that (iii) the devel-opment of the FBAP concentration is in addition influenced by daily cycles in biological emission processes, including those of fungal spores and other PBAP classes. These 15
competing effects are impossible to separate by this analysis.
A comparison of measured FBAP and simulated fungal spore number concentra-tions for July 2010 is shown in Fig. 3. At the measurement site of Karlsruhe, diel cycles were found in the simulated and measured time series, with constantly lower concen-trations being obtained from simulations based on emission parameterizations given 20
in literature. When precipitation occurs in the simulation, the simulated fungal spore concentrations decrease due to washout and the diel development of the concentra-tion is interrupted. Afterwards, the simulated concentraconcentra-tions quickly return to the pre-vious baseline. At Hyytiälä a strong decrease in simulated fungal spore concentration on 24 July precisely overlaps with the simulation of precipitation. After hitting a min-25
ACPD
14, 9903–9950, 2014Regional-scale simulations of fungal
spore aerosols
M. Hummel et al.
Title Page
Abstract Introduction
Conclusions References
Tables Figures
◭ ◮
◭ ◮
Back Close
Full Screen / Esc
Printer-friendly Version Interactive Discussion
Discussion
P
a
per
|
D
iscussion
P
a
per
|
Discussion
P
a
per
|
Discuss
ion
P
a
per
|
precipitation at the site, as was the case in this instance. As a result of no rain falling at the site on 24 July, the measured FBAP concentration was not affected by the simu-lated rain. While this example shows that uncertainty in local meteorology contributes uncertainty to the aerosol output of the model, washout from precipitation remains an important modeled process for estimating FBAP concentrations. Additionally, other dy-5
namic processes are known to affect FBAP concentrations. For example, FBAP has been shown to increase dramatically during rainfall, a process reported recently for both a site in Colorado (Huffman et al., 2013) and also at the Hyytiälä site (Schu-macher et al., 2013). The reasons for this FBAP increase are unclear, but are thought to be related to mechanical ejection from terrestrial surfaces as a result of rain droplet 10
splash (Huffman et al., 2013). These effects are known to be dependent on the local geography and ecology, however, and are outside the scope of the presented emission parameterizations.
During the simulation period of October 2010, the simulated fungal spore number concentrationsFH&Sare consistently below the measured FBAP concentrations at the
15
sites of Karlsruhe and Hyytiälä, whereasFS&Dmatches the relative magnitude of the
measurements more closely in both cases (Fig. 4). At Karlsruhe, concentrations simu-lated by each emission parameterization follow a distinct diel cycle and increase slightly through the week, reaching concentration maxima on 15 October. The measured FBAP concentration develops differently, with only very weak diel cycle present from 11 to 14 20
October, and showing little relationship to the simulatedhPBL, as discussed above.
At the end of August 2010, four different measurement series were available for a comparison to fungal spore simulations (Figs. 5 and 6). The measured time series of FBAP number concentrations generally exhibit diel cycles, as discussed. The absolute FBAP concentration at Hyytiälä was consistently highest, when comparing all four sites. 25
ACPD
14, 9903–9950, 2014Regional-scale simulations of fungal
spore aerosols
M. Hummel et al.
Title Page
Abstract Introduction
Conclusions References
Tables Figures
◭ ◮
◭ ◮
Back Close
Full Screen / Esc
Printer-friendly Version Interactive Discussion
Discussion
P
a
per
|
D
iscussion
P
a
per
|
Discussion
P
a
per
|
Discuss
ion
P
a
per
|
and is an indication that precipitation has a stronger influence on the simulated concen-trations than changes in the boundary layer height. Measured rainfall during this period at Hyytiälä was less consistent than the model predicts, but occurred with episodic peaks. In all other August case studies, simulated fungal spore concentrations show relatively good agreement with FBAP measurements.
5
3.2 Development of a fungal spore emission parameterization by adaptation to FBAP measurements
Direct comparison between simulated fungal spores and measured FBAP reveals that in general the simulated concentrations systematically underestimate the measured concentrations (Fig. 7a). This difference is most distinct at Hyytiälä during the August 10
case study and at Karlsruhe in the July and October case study. Here we suggest an improved parameterization, including meteorological and surface parameters identified earlier as drivers of fungal spore emissions. Additionally, new parameters driving fungal spore emissions have been investigated. The emission flux depends on these param-eters and their fitting coefficients obtained from a regression analysis of the FBAP 15
measurements. The new parameterization for fungal spore emissions has been incor-porated into COSMO-ART and the resulting concentrations are included in Figs. 3 to 6.
The emission flux from the regression analysis is adjusted to an emission flux FF,c
estimated from the FBAP number concentration. For this, it is assumed that particles 20
are evenly distributed throughout the planetary boundary layer and that the simulated fungal spore concentration negatively correlates withhPBL. Together with a steady-state
condition and neglecting horizontal exchanges with the surrounding air, the balance holds between the number concentration (Nf) and the emission rate (FF,c) together with
the atmospheric lifetime of fungal spores (τ): 25
Nf=
FF,cτ
hPBL
ACPD
14, 9903–9950, 2014Regional-scale simulations of fungal
spore aerosols
M. Hummel et al.
Title Page
Abstract Introduction
Conclusions References
Tables Figures
◭ ◮
◭ ◮
Back Close
Full Screen / Esc
Printer-friendly Version Interactive Discussion
Discussion
P
a
per
|
D
iscussion
P
a
per
|
Discussion
P
a
per
|
Discuss
ion
P
a
per
|
(Seinfeld and Pandis, 2006). The boundary layer height at the measurement site needs to be taken from the model simulation as it is not measured consistently. The fungal spore lifetime is assumed to be constant and is estimated with an initial value of one day, as given in literature for aerosol particles with 3 µm in diameter (Jaenicke, 1978). A new simulation of the fungal spore concentrations with the initial value of atmospheric 5
spore lifetime reveals an underestimation compared to the FBAP measurements. As a remedy, the fungal spore lifetime is corrected toτ=4 3/4 h. The deviation from a life-time of 3 µm particles given in literature may be attributed to the assumption of a con-stant vertical distribution of fungal spores with increasing altitude until boundary layer height. However, a ratio of approximately 1.75 between surface-level concentrations 10
and mean concentrations within the boundary layer is too small to explain the discrep-ancy in lifetime.
Two types of instruments operating with different numbers of channels and detecting fluorescence at different wavelengths are used here for deriving an emission param-eterization appropriate for fungal spores. The technical difference may lead to slightly 15
deviating FBAP concentrations (Healy et al., 2014), because the WIBS instrument only counts particles as FBAP when a signal exceeds a threshold in both channels (Pöhlker et al., 2012; Gabey et al., 2010). Some fungal spores most abundant in the Earth’s atmosphere and very common for fungal spores of 2–4 µm (Cladosporium sp., As-pergillus versicolor, Penicillium solitum) (Fröhlich-Nowoisky et al., 2012; Hameed and 20
Khodr, 2001) only show a weak signal in the emission wavelength of 310 nm to 400 nm (Saari et al., 2013; Healy et al., 2014). This difference needs to be taken into account when comparing absolute concentrations of fungal spores and FBAP. During the time periods shown here, the WIBS indicate slightly lower FBAP concentrations than the UV-APS when comparing to the model results. In general, this feature is not always 25
ACPD
14, 9903–9950, 2014Regional-scale simulations of fungal
spore aerosols
M. Hummel et al.
Title Page
Abstract Introduction
Conclusions References
Tables Figures
◭ ◮
◭ ◮
Back Close
Full Screen / Esc
Printer-friendly Version Interactive Discussion
Discussion
P
a
per
|
D
iscussion
P
a
per
|
Discussion
P
a
per
|
Discuss
ion
P
a
per
|
for the concentration values to match each other. The amount of FBAP given by the UV-APS may be represented best by WIBS channel FL3_370 (Sect. 2.4). The FBAP concentration given by the UV-APS is therefore reduced by a factor derived from the WIBS instrument as the mean ratio between channel FL3_370 and the total FBAP con-centrationNF,c(channels FL1_280 and FL3_370). The factor is estimated to be 2.2 and
5
identical for WIBS data at Karlsruhe and Manchester. The difference is not taken into account in the comparison of the time series in Sect. 3.1, but corrected before applying Eq. (7).
Analyzing the meteorological and surface parameters of the model output, it was found that a better correlation with the measured FBAP concentrations is achieved 10
for specific humidity rather than relative humidity, as it was reported for previous field measurements (Gabey et al., 2010; Toprak and Schnaiter, 2013; Di Filippo et al., 2013). During the time period in July 2010, the measured FBAP concentrations vary in a nar-row range of specific humidity, which is not reproduced by the literature-based simula-tion. For this reason, the July case study was removed from the regression analysis. 15
A dependence on the LAI is required in order to take the seasonal change into account and to distinguish among various regions. A combination of LAI and specific humid-ity in the regression has the advantage of reducing the fitting parameters. The same relation was chosen by Heald and Spracklen (2009) for the previously discussed emis-sion parameterization. Additionally, surface temperature dependence as suggested by 20
Di Filippo et al. (2013) is indicated by the time series and factored in a regression analysis. The parameters (b1=20.426 and b2=3.93×10
4
) are estimated to be the smallest sum of all squared residuals and result in a multiple linear regression giving an emission fluxFE=FFBAPin m
−2
s−1for fungal spores fitted to FBAP measurements: 25
FFBAP=b1(T−275.82 K)+b2qvLAI (8)
whereT is the surface temperature in K, qv the specific humidity in kg kg
−1
ACPD
14, 9903–9950, 2014Regional-scale simulations of fungal
spore aerosols
M. Hummel et al.
Title Page
Abstract Introduction
Conclusions References
Tables Figures
◭ ◮
◭ ◮
Back Close
Full Screen / Esc
Printer-friendly Version Interactive Discussion
Discussion
P
a
per
|
D
iscussion
P
a
per
|
Discussion
P
a
per
|
Discuss
ion
P
a
per
|
emission offset of the regression and covers unknown influences. The coefficientb2is
approximately the same as the constants in the Heald and Spracklen (2009) emission for a particle diameter of 3 µm given in Eq. (6). The additional temperature dependence in Eq. (8) increases the fungal spore emission for temperatures above 275.8 K and lowers the emission for temperatures below this value.
5
The multiple linear regression yields a coefficient of determination of R2=0.4. By comparing the simulated concentrations (based onFFBAP) to the measured FBAP con-centrations, it is found that they distribute more evenly along the 1 : 1 line (Fig. 7b). The statistical overview (Fig. 2) shows a better agreement between the median concentra-tions of simulation and measurement for the new emission parameterization than for 10
the literature-based emissions, which is most obvious at Karlsruhe in August and at Hyytiälä in July. The new emission parameterization only slightly reduces the underes-timations found for Hyytiälä during August.
Figure 8 shows the emission flux for late August 2010, following the new parameter-ization, horizontally distributed over a model domain covering Europe. Here, averaged 15
over land areas of the domain,FFBAP gives 1.03×10 3
m−2s−1. During July and Octo-ber, the average flux is shifted to 1.4×10³m−2s−1and 0.4×10³m−2s−1, respectively, mainly as a result of seasonal changes of LAI andT.
When analyzing the temporal development of the simulated fungal spore concen-trations for each time series, FFBAP mostly results in a slightly higher number
con-20
centration than FH&S or FS&D (Figs. 3 to 6). This is not the case for October 2010,
where theFFBAP-concentrations are in the range of the literature-based concentrations.
A sharp decrease on 15 October at Hyytiälä, which is not reflected by the literature-based simulation, is caused by a rapid temperature change. Comparison for the Au-gust case study show that simulated FFBAP-concentrations agree well with measured
25
ACPD
14, 9903–9950, 2014Regional-scale simulations of fungal
spore aerosols
M. Hummel et al.
Title Page
Abstract Introduction
Conclusions References
Tables Figures
◭ ◮
◭ ◮
Back Close
Full Screen / Esc
Printer-friendly Version Interactive Discussion
Discussion
P
a
per
|
D
iscussion
P
a
per
|
Discussion
P
a
per
|
Discuss
ion
P
a
per
|
due to an urban measuring site that is not represented accurately by the model setup with its broad resolution.
3.3 Contribution of fungal spore to near-surface aerosol composition
For a comparison of simulated fungal spores to the dry aerosol chemical composition, the fungal spore mass concentration is calculated from the number concentration as-5
suming monodisperse and spherical particles (ρp=1 g cm
−3
; Sect. 2.1). The horizon-tally distributed near-surface (approximately 10 m above ground) fungal spore number concentration using FFBAP is shown in Fig. 9. Concentrations simulated at the
mea-surement locations are considerably lower than the high surface concentrations in the southern part of the model domain.
10
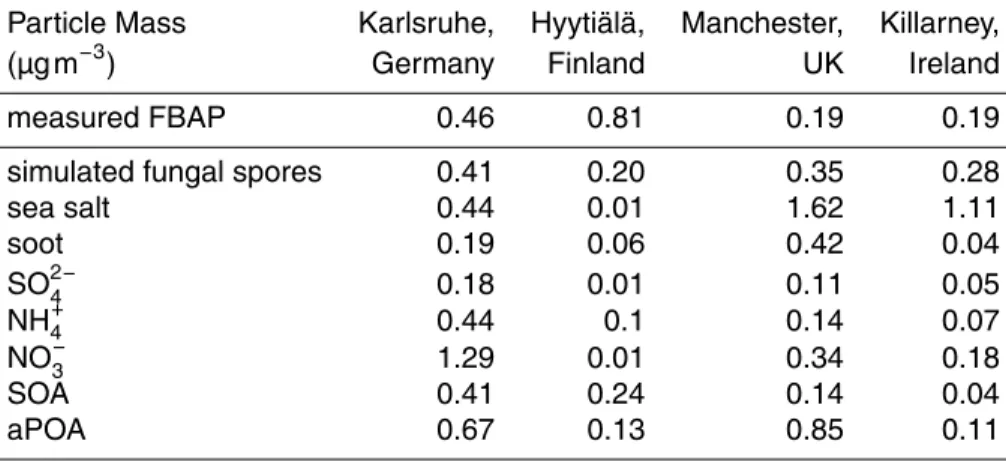
The simulated mass concentrations of each chemical aerosol compound are aver-aged over the land areas of the model domain and the time period of late August 2010 (Fig. 10). The total aerosol mass concentration is approximately 2.5 µg m−3. Fun-gal spores distribute in the domain with an average number concentration of 26 L−1 over land. This corresponds to an average mass concentration of fungal spores of 15
0.37 µg m−3 which accounts for 15.4 % of the total simulated aerosol mass. The total aerosol mass excludes mineral dust as one of the main contributors to the chemical aerosol composition, which might lower the fraction of fungal spore mass considerably. A list of mass concentrations of the simulated chemical aerosol compounds, including fungal spores occurring at the measurement site, is given in Table 2. The fraction of 20
fungal spores simulated for these sites varies between 9 and 2 %. FBAP mass con-centrations calculated from the measured FBAP number concon-centrations are also listed in Table 2. Here, the same spherical particle diameter and particle density as for the fungal spore simulation is assumed. The FBAP number concentrations are averaged over the same time period as covered by the aerosol simulation. Their share of the 25
ACPD
14, 9903–9950, 2014Regional-scale simulations of fungal
spore aerosols
M. Hummel et al.
Title Page
Abstract Introduction
Conclusions References
Tables Figures
◭ ◮
◭ ◮
Back Close
Full Screen / Esc
Printer-friendly Version Interactive Discussion
Discussion
P
a
per
|
D
iscussion
P
a
per
|
Discussion
P
a
per
|
Discuss
ion
P
a
per
|
4 Discussion and conclusions
FBAP measurements from four locations in Northern Europe were compared with sim-ulated fungal spore concentrations. Fluorescent particles in the diameter range of 2– 4 µm are highest in number concentration of FBAP measurements at the rural site near Karlsruhe, Germany (Huffman et al., 2010, 2012, 2013; Pöschl et al., 2010; Healy 5
et al., 2012a; Toprak and Schnaiter, 2013). The diameter range for peak FBAP concen-tration matches closely with the modal size of many species of fungal spores known to be present in airborne concentrations. Simulated fungal spores have been adjusted to match this diameter. Contrary to that, an increase in number concentration towards small particles has been reported for some FBAP measurement series, but only a small 10
fraction of particles could be counted as bacteria cells (Gabey et al., 2011; Huffman et al., 2010).
Comparison of simulations and measurements at four locations and the correlation of FBAP concentrations to meteorological and surface conditions are expected to be most robust when applying identical methods and conditions at all locations. These condi-15
tions were not fulfilled in our study. On one hand, site characteristics vary between the stations, which may influence the sensitivity of PBAP emission to surrounding condi-tions. On the other hand, the measurements are made with different instruments. The measurement series at Karlsruhe, Germany, are done with a WIBS-4 instrument which includes technical improvements compared to the WIBS-3 used at Manchester, UK and 20
Cork, Ireland (Gabey et al., 2010; Healy et al., 2012b). At Hyytiälä, Finland, and Killar-ney, Ireland, the UV-APS is used to determine the FBAP concentration. This variation may lead to different estimation of the FBAP concentration and within this case study WIBS may report FBAP at lower concentrations than UV-APS at different locations but similar meteorological conditions.
25
ACPD
14, 9903–9950, 2014Regional-scale simulations of fungal
spore aerosols
M. Hummel et al.
Title Page
Abstract Introduction
Conclusions References
Tables Figures
◭ ◮
◭ ◮
Back Close
Full Screen / Esc
Printer-friendly Version Interactive Discussion
Discussion
P
a
per
|
D
iscussion
P
a
per
|
Discussion
P
a
per
|
Discuss
ion
P
a
per
|
counts (Heald and Spracklen, 2009; Sesartic and Dallafior, 2011). The temporal de-velopment of the simulated concentrations calculated by COSMO-ART approximately reproduces the measured FBAP concentrations. A diurnal cycle in the simulated fungal spore concentrations with a maximum between midnight and sunrise is probably influ-enced by boundary layer compression at night. Measured FBAP concentrations are 5
often not consistent to simulatedhPBLwhich suggest thatNF,cis additionally influenced
by increases in biological emission at night.
The purpose of the work reported here was to develop a new emission parameter-ization for fungal spores, because literature-based emissions for fungal spores have been found to significantly underestimate measured FBAP concentrations. The param-10
eterization is therefore adjusted to the FBAP concentrations (Sect. 3.2). As was formu-lated by Heald and Spracklen (2009), it depends on the specific humidity and the leaf area index, but is extended by temperature. The resulting concentrations are in better agreement to the measured FBAP concentrations on the average, but variations in the measurements are not always captured by the simulation. Another long-term analysis 15
of FBAP concentrations and surrounding conditions may result in a further adjustment of the parameters or reveal another parameter driving the emission.
Using the new emission parameterization on a model domain for Europe, fungal spore emission fluxes are extrapolated from northern parts of the domain, where UV-LIF measurements were located, also to Southern Europe. There, much higher emis-20
sion fluxes occur in the simulation, partially caused by higher specific humidity, which is also the case for FH&S, as well by temperature dependence in FFBAP. This
extrap-olation is without local Southern European measurements, however, and thus further UV-LIF measurements are recommended for this region in Southern Europe where fungal spore emission fluxes are potentially greater.
25
ACPD
14, 9903–9950, 2014Regional-scale simulations of fungal
spore aerosols
M. Hummel et al.
Title Page
Abstract Introduction
Conclusions References
Tables Figures
◭ ◮
◭ ◮
Back Close
Full Screen / Esc
Printer-friendly Version Interactive Discussion
Discussion
P
a
per
|
D
iscussion
P
a
per
|
Discussion
P
a
per
|
Discuss
ion
P
a
per
|
uncertainties may result from an insufficient relation to the presence of fungi or addi-tional surrounding factors favoring fungi growth. Furthermore, variations in precipitation may not be captured by the model, which then may lead to improper fungal spore con-centrations. The same holds for small wind gusts and convective cells which may have a strong influence on spore dispersion, but are not captured well in the model. An in-5
crease in fungal spore concentration during or shortly after rain events (Huffman et al., 2013) could not be reproduced by the simulations, as this effect is not included in the emission parameterization to an adequate extent.
The module calculating the dispersion of fungal spores does not include all pro-cesses of aerosol dynamics and cloud physics. Of the propro-cesses not included, only 10
breaking up of spores can enhance their number concentration. Coagulation is ne-glected, as in most cases the fungal spore number concentration is low and, hence, their collision is highly improbable. A coagulation of spores with other aerosol particles is more likely to happen, but not included in the simulations. Not much is known about the role of fungal spores in clouds and their ability to act as cloud condensation nuclei. 15
The simulations presented in this paper highlight the importance of PBAP to the composition of atmospheric aerosol. Fungal spores, the focus of this paper, are among the main contributors to PBAP and therefore exert significant influence on aerosol load-ing. In this study, COSMO-ART is used up to simulate all major chemical aerosol com-pounds except for mineral dust in a domain covering Western Europe. When averaging 20
the mass concentration horizontally across the land-covered part of the model domain and over all time steps of the simulation, fungal spores are among the major mass components (Fig. 10). However, the fraction of fungal spores might be overestimated here, as another major aerosol component, mineral dust, is not included, because the domain does not include any desert dust source areas. An additional difference in the 25
treatment of aerosol dynamics implies that spores in the simulation are assumed to be monodisperse with a diameter of 3 µm without being subjected to sedimentation.
A FBAP mass concentration, estimated from measured FBAP number concentra-tions (dp=3 µm; ρp=1 g cm
−3
ACPD
14, 9903–9950, 2014Regional-scale simulations of fungal
spore aerosols
M. Hummel et al.
Title Page
Abstract Introduction
Conclusions References
Tables Figures
◭ ◮
◭ ◮
Back Close
Full Screen / Esc
Printer-friendly Version Interactive Discussion
Discussion
P
a
per
|
D
iscussion
P
a
per
|
Discussion
P
a
per
|
Discuss
ion
P
a
per
|
chemical aerosol mass components in rural areas of Finland (Table 2). In compari-son to relations of PBAP to total aerosol concentrations given in literature, their volume fraction of particles larger than 0.2 µm during one year of measurements at a remote site in Siberia reaches 28 % on the average and at Mainz, Germany the volume fraction amounts to 22 % (Matthias-Maser et al., 2000). Both of these fractions agree well with 5
simulated mass fractions of this study for comparable locations, but simulated concen-trations given in this study are much lower than total number concenconcen-trations given in Matthias-Maser et al. (2000). In contrast, the number and mass fractions in the Ama-zonian basin are above 80 % and therefore much higher than in the highlighted urban and remote areas (Pöschl et al., 2010), but here the absolute concentrations are less 10
and therefore in the order of magnitude given by the simulation of this study.
PBAP and especially fungal spores might account for a major part of the aerosol loading. Locally, a correlation between increasing FBAP and ice nuclei number con-centration (Tobo et al., 2013) shows that future model studies of PBAP impacts on clouds are needed to determine their relevance to atmospheric ice nucleation.
15
Acknowledgements. We wish to thank A. Schnur for preliminary studies in connection with this paper and M. Bangert for technical support. We would like to thank the EMPA members, par-ticularly C. Knote and D. Brunner, for providing the emission data of the chemical compounds. We also wish to acknowledge P. Aalto, V. Hiltunen, T. Petäjä, C. Schumacher, and M. Kulmala for assistance gathering and analyzing data. We acknowledge support by the Deutsche
20
Forschungsgemeinschaft and the Open Access Publishing Fund of the Karlsruhe Institute of Technology. This research was funded by the Helmholtz Association through the Helmholtz Climate Initiative REKLIM, the President’s Initiative and Networking Fund and by DFG through project HO 4612/1-1 (FOR 1525 INUIT). J. A. Huffman acknowledges internal faculty funding from the University of Denver. J. A. Huffman, C. Pöhlker, and U. Pöschl acknowledge financial
25
ACPD
14, 9903–9950, 2014Regional-scale simulations of fungal
spore aerosols
M. Hummel et al.
Title Page
Abstract Introduction
Conclusions References
Tables Figures
◭ ◮
◭ ◮
Back Close
Full Screen / Esc
Printer-friendly Version Interactive Discussion
Discussion
P
a
per
|
D
iscussion
P
a
per
|
Discussion
P
a
per
|
Discuss
ion
P
a
per
|
The service charges for this open access publication have been covered by a Research Centre of the Helmholtz Association.
References
Ariya, P. A., Sun, J., Eltouny, N. A., Hudson, E. D., Hayes, C. T., and Kos, G.: Physical and
5
chemical characterization of bioaerosols – Implications for nucleation processes, Int. Rev. Phys. Chem., 28, 1–32, 2009.
Aylor, D. E.: Settling speed of corn (Zea mays) pollen, J. Aerosol Sci., 33, 1601–1607, doi:10.1016/S0021-8502(02)00105-2, 2002.
Bartholomé, E. and Belward, A. S.: GLC2000: a new approach to global land
10
cover mapping from Earth observation data, Int. J. Remote Sens., 26, 1959–1977, doi:10.1080/01431160412331291297, 2005.
Bauer, H., Schueller, E., Weinke, G., Berger, A., Hitzenberger, R., Marr, I. L., and Puxbaum, H.: Significant contributions of fungal spores to the organic carbon and to the aerosol mass balance of the urban atmospheric aerosol, Atmos. Environ., 42, 5542–5549,
15
doi:10.1016/j.atmosenv.2008.03.019, 2008.
Bones, D. L., Henricksen, D. K., Mang, S. A., Gonsior, M., Bateman, A. P., Nguyen, T. B., Cooper, W. J., and Nizkorodov, S. A.: Appearance of strong absorbers and fluorophores in limonene-O3secondary organic aerosol due to NH+4-mediated chemical aging over long time scales, J. Geophys. Res.-Atmos., 115, D05203, doi:10.1029/2009jd012864, 2010.
20
Brosseau, L. M., Vesley, D., Rice, N., Goodell, K., Nellis, M., and Hairston, P.: Diff er-ences in detected fluorescence among several bacterial species measured with a direct-reading particle sizer and fluorescence detector, Aerosol Sci. Tech., 32, 545–558, doi:10.1080/027868200303461, 2000.
Burch, M. and Levetin, E.: Effects of meteorological conditions on spore plumes, Int. J.
Biome-25
teorol., 46, 107–117, doi:10.1007/s00484-002-0127-1, 2002.