www.jped.com.br
ORIGINAL
ARTICLE
Socio-economic
and
demographic
determinants
of
childhood
anemia
夽
Sankar
Goswmai
a,∗,
Kishore
K.
Das
baDepartmentofStatistics,GurucharanCollege,Silchar,India
bDepartmentofStatistics,GauhatiUniversity,Guwahati,India
Received17February2014;accepted2December2014 Availableonline10June2015
KEYWORDS
India; Child; Anemia; Riskfactors
Abstract
Objective: Toevaluatesocio-economicanddemographicdeterminantsofanemiaamongIndian childrenaged6---59months.
Methods: Statisticalanalysiswasperformedonthecross-sectionalweightedsampleof40,885 childrenfrom2005to2006NationalFamilyHealthSurveybyusingmultinomiallogistic regres-siontoassessthesignificanceofsomeriskfactorsindifferentdegreesofchildanemia.Anemia wasdiagnosedbyWorldHealthOrganization(WHO)cut-offpointsonhemoglobinlevel. Pear-son’schi-squaredtestwasappliedtojustifytheassociationsofanemiawithdifferentcategories ofthestudypopulation.
Results: Theprevalenceofanemiawas69.5%;26.2%mild,40.4%moderate,and2.9%severe anemia.Overallprevalencerate,alongwithmildandmoderatecases,showedanincreasing trendupto2yearsofageandthendecreased.Ruralchildrenhadahigherprevalencerate.Of 28Indianstatesinthestudy,10statesshowedveryhighprevalence,thehighestbeingBihar (77.9%).Higherbirthorder,highindexofpoverty,lowlevelofmaternaleducation,mother’s anemia,non-intakeofironsupplementsduringpregnancy,andvegetarianmotherincreasedthe risksofalltypesofanemiaamongchildren(p<0.05).Christianpopulationwasatlowerrisk; andScheduledCaste,ScheduledTribe,andOtherBackwardClasscategorieswereathigherrisk ofanemia.
Conclusion: Theresultssuggestaneedforproperplanningandimplementationofpreventive measures tocombat childanemia.Economicallyunder-privilegedgroups,maternalnutrition andeducation,andbirthcontrolmeasuresshouldbeprioritiesintheprograms.
©2015SociedadeBrasileiradePediatria.PublishedbyElsevierEditoraLtda.Allrightsreserved.
夽
Pleasecitethisarticleas:GoswmaiS,DasKK.Socio-economicanddemographicdeterminantsofchildhoodanemia.JPediatr(RioJ). 2015;91:471---77.
∗Correspondingauthor.
E-mail:[email protected](S.Goswmai).
http://dx.doi.org/10.1016/j.jped.2014.09.009
PALAVRAS-CHAVE
Índia; Crianc¸a; Anemia; Fatoresderisco
Fatoressocioeconômicosedemográficosdeterminantesdeanemiainfantil
Resumo
Objetivo: Avaliar os fatores socioeconômicos e demográficos determinantes de anemia em crianc¸asindianascomidadede6a59meses.
Métodos: Aanáliseestatísticafoirealizadanaamostratransversalponderadade40885crianc¸as daPesquisaNacionaldeSaúdedaFamíliade2005---2006,GovernodaÍndia, utilizandoa téc-nicade regressão logística multimodalpara avaliara relevânciade alguns fatoresde risco emdiferentesgrausdeanemiainfantil.Aanemiafoidiagnosticadapelospontosdecortede níveldehemoglobinasdaOMS.OtesteQui-quadradodePearsonfoiutilizadoparajustificaras associac¸õesdaanemiacomdiferentescategoriasdepopulac¸ãoestudada.
Resultados: Aprevalênciadeanemiafoide69,5%,sendo26,2%deanemialeve,40,4%deanemia moderadae2,9%deanemiagrave.Ataxadeprevalênciageral,juntamentecomadeanemia leveemoderada,mostrouumatendênciadeaumentoatéosdoisanosdeidadee,depoisdisso, dequeda.Ascrianc¸asdazonaruraltêmmaiortaxadeprevalência.Dos28Estadosindianosdo estudo,10apresentaramprevalênciamuitoalta,sendoBiharomaiordeles(77,9%).Aordem denascimentoelevada,altoíndicedepobreza,baixoníveldeescolaridadematerna,anemia materna,nãoingestãodesuplementosdeferroduranteagravidezevegetarianismomaterno aumentaramosriscosdetodosostiposdeanemiaentrecrianc¸as(p<0,05).Apopulac¸ãocristã tinhaomenorrisco; eascategoriasCastaReconhecida,Tribo ReconhecidaeOutras Classes Atrasadastinhamomaiorriscodeanemia.
Conclusão: Osresultadossugeremanecessidadedeplanejamentoeimplementac¸ãoadequados demedidaspreventivascontraaanemiainfantil.Gruposeconomicamentecarentes,anutric¸ão eescolaridadematernaseocontroledanatalidadedevemserprioridadesnosprogramas. ©2015SociedadeBrasileiradePediatria.PublicadoporElsevierEditoraLtda.Todososdireitos reservados.
Introduction
Childhood anemia is one of the main deficiency diseases in the world and is associated withfunctional abnormal-ities of lymphocytes and neutrophils, including increased mortality.1,2 The condition leads to thelack of oxygen in
organsandtissues,andpeoplewithanemiaoftenfeeltired,
weak,cold,andshortofbreath.Worldwide,47.4%of
chil-drenunder5yearsofageareanemic,withtheburdenbeing
greatestinlow-andmiddle-incomecountries.3,4
According to the United Nations Children’s Fund, 90%
of all types of anemia in the world aredue to iron
defi-ciency. Iron deficiency is a problem that contributes to
low birth weight, lowered resistance to infection, and
decreased work capacity. Young children are more
vul-nerable to this disease because of their rapid growth
and high need for iron. Sickle cell anemia, associated
withepisodesofacuteillness andprogressive organ
dam-age,is alsobecomingacommon inheriteddisorder inthe
world.5 The risk factors of anemia most often cited in
the literature are low family income and low maternal
level of education,lack of accessto healthcareservices,
inadequatesanitaryconditions,andadietwithpoor
quan-tities of iron.6,7 The disease is also becoming common
amongtheScheduledTribe(ST),ScheduledCaste(SC),and
Other Backward Class (OBC) population in some parts of
India.8,9
Inviewofmagnitudeandsevereconsequencesofanemia,
inordertobetterplanpreventivemeasures,thisstudyaims
toidentifythesignificantsocio-economicanddemographic
riskfactorsofanemiainIndianchildrenof6---59monthsby
meansofstatisticalmodeling.
Methods
The relevant data fromchildren aged 6---59 months, who weretested forhemoglobinlevels,fromthe 2005to2006 National Family Health Survey (NFHS), Ministry of Health andFamilyWelfare,Govt.of India,10 wereanalyzedusing
SPSS15.0software(SPSSInc.Released2007.SPSSfor
Win-dows,Version15.0.Chicago,USA).Thestudywasapproved
by the Ethics Committee of the Gauhati University in
India. The reference number of the approval letter is
GU/ACA/Ethics/2014/4044,datedNovember25,2014.
TheNFHSarenationwidesurveysconductedwitha
rep-resentative sample of households throughout the India.
SamplesfromurbanandruralareaswithineachStatewere
drawn separately. The rural sample was selected in two
stages,withtheselectionofvillages,usingprobability
pro-portionaltopopulationsize(PPS)atthefirststage,followed
bytherandomselectionofhouseholdswithineachvillagein
thesecond stage.In urbanareas,athree-stageprocedure
wasfollowed.Inthefirststage,wards wereselectedwith
PPS sampling. In the next stage,one censusenumeration
block(CEB)wasrandomlyselectedfromeachsampleward.
Inthefinalstage,householdswererandomlyselectedwithin
eachselectedCEB.
Women of age 15---49 years from the selected
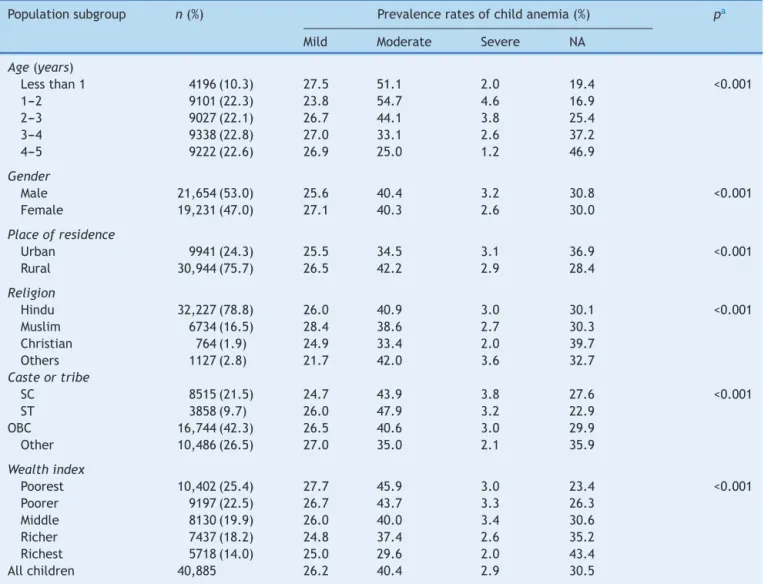
Table1 Basiccharacteristicsofthestudypopulation.
Populationsubgroup n(%) Prevalenceratesofchildanemia(%) pa
Mild Moderate Severe NA
Age(years)
Lessthan1 4196(10.3) 27.5 51.1 2.0 19.4 <0.001
1---2 9101(22.3) 23.8 54.7 4.6 16.9
2---3 9027(22.1) 26.7 44.1 3.8 25.4
3---4 9338(22.8) 27.0 33.1 2.6 37.2
4---5 9222(22.6) 26.9 25.0 1.2 46.9
Gender
Male 21,654(53.0) 25.6 40.4 3.2 30.8 <0.001
Female 19,231(47.0) 27.1 40.3 2.6 30.0
Placeofresidence
Urban 9941(24.3) 25.5 34.5 3.1 36.9 <0.001
Rural 30,944(75.7) 26.5 42.2 2.9 28.4
Religion
Hindu 32,227(78.8) 26.0 40.9 3.0 30.1 <0.001
Muslim 6734(16.5) 28.4 38.6 2.7 30.3
Christian 764(1.9) 24.9 33.4 2.0 39.7
Others 1127(2.8) 21.7 42.0 3.6 32.7
Casteortribe
SC 8515(21.5) 24.7 43.9 3.8 27.6 <0.001
ST 3858(9.7) 26.0 47.9 3.2 22.9
OBC 16,744(42.3) 26.5 40.6 3.0 29.9
Other 10,486(26.5) 27.0 35.0 2.1 35.9
Wealthindex
Poorest 10,402(25.4) 27.7 45.9 3.0 23.4 <0.001
Poorer 9197(22.5) 26.7 43.7 3.3 26.3
Middle 8130(19.9) 26.0 40.0 3.4 30.6
Richer 7437(18.2) 24.8 37.4 2.6 35.2
Richest 5718(14.0) 25.0 29.6 2.0 43.4
Allchildren 40,885 26.2 40.4 2.9 30.5
NA,non-anemic;SC,ScheduledCaste;ST,ScheduledTribe;OBC,OtherBackwardClass.
a p-valuesrepresenttheassociationofanemiawithdifferentsubgroups.
Hemoglobin concentration for mother and children was measuredbyfinger-prickbloodspecimensusingaportable Hemocue® Hb201+ analyzer (B-Hemoglobin Photometer
HemocueAB;Angelholm,Sweden).WHOclassification crite-ria were used todiagnose child anemia as concentration level:10.0---10.9g/dL---mildanemia;7.0---9.9g/dL--- mod-erateanemia;<7g/dL---severeanemia.11 Maternalanemia
wasdiagnosedasfollows:fornon-pregnantwomen
concen-tration <12.0g/dL, and for pregnant women <11.0g/dL.
The data were weighted toaccount for the differencein
samplingproportions amongthestates,andwere
normal-ized across the entire sample. Pearson’s chi-squared test
wasusedtoassessthesignificanceofassociationofanemia
withdifferentcategoriesofstudypopulation.Amultinomial
logistic regressionmodel12 wasfitted toexplore potential
risk factors associated with different degrees of anemia.
Theresponsevariablewasdesignedasapolytomous‘anemia
level’(non-anemic,mildlyanemic,moderatelyanemic,and
severelyanemic);andthepredictorsas:ageofchildinyears
(lessthan1,1---2,2---3,3---4,and4---5),birthorderofchild
(numeric),placeofresidence(urban,rural),religion(Hindu,
Muslim,Christian,andothers),casteortribe(SC,ST,OBC,
andothers),wealthindex(poorest,poorer,middle,richer,
andrichest),mother’sanemialevel(non-anemic,anemic),
mother’seducation(noeducation,primary,secondary,and
higher), father’s education (no education, primary,
sec-ondary,andhigher),mother’sageat firstbirth(numeric),
iron supplements for mother during pregnancy (no, yes)
anddietaryhabit ofmother(vegetarian, non-vegetarian).
Wealthindexwasusedasan indicatorof economicstatus
of households and was developed in relation to
inequali-tiesinhouseholdincome,useofhealthservices,andhealth
outcomes.13 Independence of the predictors was justified
byvarianceinflationfactors(VIF)underamulticolinearity
test.
Results
Inthestudiedpopulation,75.7%wereruraland24.3%were urban children (Table 1). The male:female sex ratio was
29.0
27.0
25.0 25.6 24.1 24.2
29.4 23.2 29.0 24.9 28.4 21.7 29.4 32.0 26.8 22.2
27.7 28.9 29.5
25.9 26.3 28.8 25.5 25.9
23.5 23.3 25.8
19.4
47.3
43.6
45.4 42.8 46.0
43.1 38.4 40.8 39.5 41.4 38.5 38.1 34.5 32.0 34.0 39.3
34.6 30.6 30.0
30.7 31.6
28.8
30.9
26.5
20.5 20.9 15.7
16.7 1.6 3.4 3.6 4.1 2.0 3.6 3.0 6.7 2.0 3.7 2.2 6.4 1.5 0.8 2.7 1.9 0.8 2.3 1.5 2.4
0.0 0.0 0.8
2.1 0.5 0.0 0.0 2.8 0 10 20 30 40 50 60 70 80 Bihar Madhya Prades h Uttar Prades h Haryana Chhattisgar h
Andhra Pr Karnatak
a Rajasthan Jharkhand Gujara t Assa m Punjab Orissa Meghalay a
Tamil Nadu Maharastra
Tripur
a
Uttaranchal
West Bengal
Jammu & Kashmir
Sikkim Arunachal Prades h Delh i Himachal Prades h Kerela Mizora m Manipur Go a
% of anemia
Indian states
Mild anemia Moderate anemia Severe anemia
Fig.1 Prevalenceofmild,moderate,severe,andoverallanemiastatusinIndianstates.
(26.2%mild, 40.4%moderate,and2.9%severe)withmean hemoglobinconcentration10.097±1.565g/dL.Nationwide, 25.4%werefromhouseholdsofpoorestwealthindex,22.5% poorer,19.9%middle,18.2%richer,and14.0%fromrichest. Ruralchildrenweremoreanemicthanurbanchildren;males andfemaleswerealmostequallyanemic.Theoverall preva-lence rate showed an increasing tendency up to 2 years ofage (83.1% for 1---2 years)and then decreased linearly. Mildanemia was commonest amongchildren of less than 1year(27.5%);whereasmoderateandsevere anemiawas mostprevalentamong1---2years(54.7%and4.6%);andthen followeda decliningtrend. PopulationofSC, ST,and OBC categoriesshowedhigherprevalenceascomparedtoother categories.Inthereligiousparameter,Christianchildrenhad alowerprevalenceofmoderate,severe,andoverallanemia thanHinduandMuslimchildren.Further,alltypesofanemia werehighlydominantamongthepoorestandpoorergroups. The p-valuesshowed the significant association of differ-entlevels of anemiawith the variouscategories of study population.
It was observed that, as shown in Fig. 1, 10 states
exceeded the national prevalence rate (69.5%); with the
highest being Bihar (77.9%), followed by Madhya Pradesh
andUttarPradesh,Haryana,Chhattisgarh,AndhraPradesh
andKarnataka,Rajasthan,Jharkhand,andGujarat,
respec-tively.Moreover,thesestatesshowedhighprevalenceofall
typesofanemia,viz.mild,moderateandsevere.
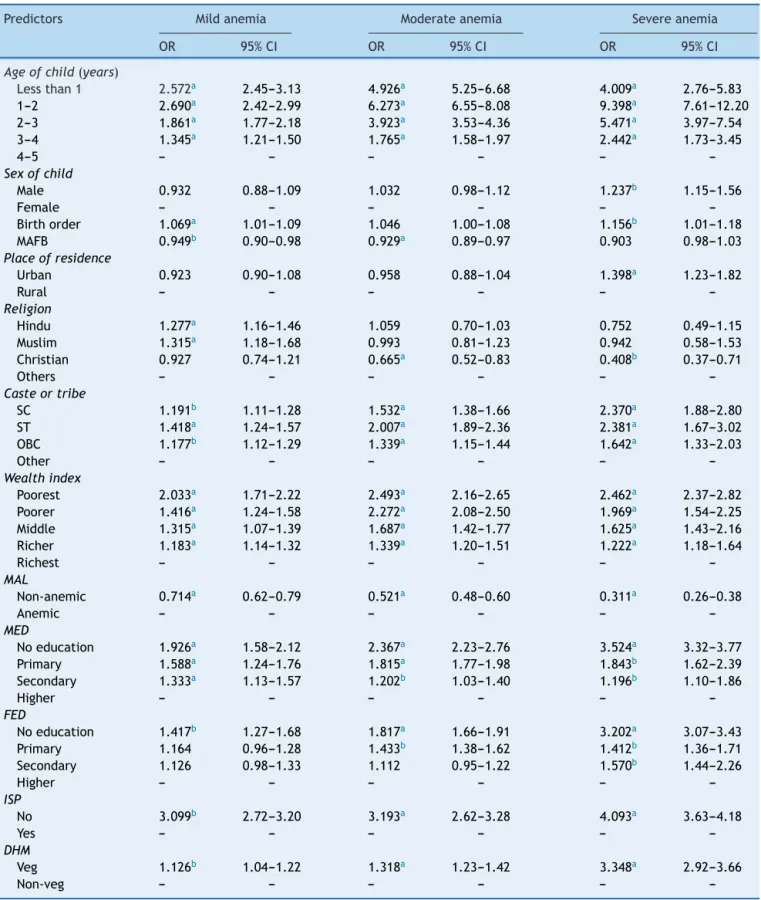
Table2presentstheresults ofmultinomiallogistic risk
factors of different categories of anemia. Children aged
1---2 years had 9.398-fold higher (95% CI 7.61---12.20) risk
of severe anemia as comparedto those of 4---5 years.As
age increased, the risk decreased. Similar declining
ten-dency was noticed for mild and moderate anemia. Male
childrenweremorelikelytobesevereanemicthanfemales,
thoughnosignificantoddswereobservedformildand
mod-erateanemia.Findingsrevealedthatasbirthorderofchild
increasedbyoneunit,theriskofsevereanemiaincreased
byafactorof1.156.Further,asageofmotheratfirstbirth
increased by 1 year, the risk of mild and moderate
Table2 Riskfactorsofmild,moderateandsevereanemia.
Predictors Mildanemia Moderateanemia Severeanemia
OR 95%CI OR 95%CI OR 95%CI
Ageofchild(years)
Lessthan1 2.572a 2.45---3.13 4.926a 5.25---6.68 4.009a 2.76---5.83
1---2 2.690a 2.42---2.99 6.273a 6.55---8.08 9.398a 7.61---12.20
2---3 1.861a 1.77---2.18 3.923a 3.53---4.36 5.471a 3.97---7.54
3---4 1.345a 1.21---1.50 1.765a 1.58---1.97 2.442a 1.73---3.45
4---5 --- --- --- --- ---
---Sexofchild
Male 0.932 0.88---1.09 1.032 0.98---1.12 1.237b 1.15---1.56
Female --- --- --- --- ---
---Birthorder 1.069a 1.01---1.09 1.046 1.00---1.08 1.156b 1.01---1.18
MAFB 0.949b 0.90---0.98 0.929a 0.89---0.97 0.903 0.98---1.03 Placeofresidence
Urban 0.923 0.90---1.08 0.958 0.88---1.04 1.398a 1.23---1.82
Rural --- --- --- --- ---
---Religion
Hindu 1.277a 1.16---1.46 1.059 0.70---1.03 0.752 0.49---1.15
Muslim 1.315a 1.18---1.68 0.993 0.81---1.23 0.942 0.58---1.53
Christian 0.927 0.74---1.21 0.665a 0.52---0.83 0.408b 0.37---0.71
Others --- --- --- --- ---
---Casteortribe
SC 1.191b 1.11---1.28 1.532a 1.38---1.66 2.370a 1.88---2.80
ST 1.418a 1.24---1.57 2.007a 1.89---2.36 2.381a 1.67---3.02
OBC 1.177b 1.12---1.29 1.339a 1.15---1.44 1.642a 1.33---2.03
Other --- --- --- --- ---
---Wealthindex
Poorest 2.033a 1.71---2.22 2.493a 2.16---2.65 2.462a 2.37---2.82
Poorer 1.416a 1.24---1.58 2.272a 2.08---2.50 1.969a 1.54---2.25
Middle 1.315a 1.07---1.39 1.687a 1.42---1.77 1.625a 1.43---2.16
Richer 1.183a 1.14---1.32 1.339a 1.20---1.51 1.222a 1.18---1.64
Richest --- --- --- --- ---
---MAL
Non-anemic 0.714a 0.62---0.79 0.521a 0.48---0.60 0.311a 0.26---0.38
Anemic --- --- --- --- ---
---MED
Noeducation 1.926a 1.58---2.12 2.367a 2.23---2.76 3.524a 3.32---3.77
Primary 1.588a 1.24---1.76 1.815a 1.77---1.98 1.843b 1.62---2.39
Secondary 1.333a 1.13---1.57 1.202b 1.03---1.40 1.196b 1.10---1.86
Higher --- --- --- --- ---
---FED
Noeducation 1.417b 1.27---1.68 1.817a 1.66---1.91 3.202a 3.07---3.43
Primary 1.164 0.96---1.28 1.433b 1.38---1.62 1.412b 1.36---1.71
Secondary 1.126 0.98---1.33 1.112 0.95---1.22 1.570b 1.44---2.26
Higher --- --- --- --- ---
---ISP
No 3.099b 2.72---3.20 3.193a 2.62---3.28 4.093a 3.63---4.18
Yes --- --- --- --- ---
---DHM
Veg 1.126b 1.04---1.22 1.318a 1.23---1.42 3.348a 2.92---3.66
Non-veg --- --- --- --- ---
---OR,oddsratio;CI,confidenceinterval;MAFB,mother’sageatfirstbirth;SC,ScheduledCaste;ST,ScheduledTribe;OBC,OtherBackward Class;MAL, mother’sanemialevel; MED,mother’s education;FED, father’s education; ISP,ironsupplementation tomotherduring pregnancy;DHM,dietaryhabitofmother.
Urbanchildrenhad1.398-foldgreaterchanceofsevere ane-miathan rural children; Christian children had 0.665-fold and0.408-foldlowerchance ofmoderateandsevere ane-miarespectively.Risksofalltypesofanemiaweregreater amongtheSC,ST,andOBCpopulationascomparedtoother groups.Aspresented,thepoorestchildrenweremore vul-nerable toward all types of anemia as compared to the richest;aswealthindexincreased,therisksdecreased. Chil-drenofnon-anemicmothershadlesslikelihoodofalltypes ofanemia.Parents’educationhadsignificantinfluence on childanemia;the risksdecreased aseducationincreased. Ironsupplementationforthemotherduringpregnancy low-eredtherisksofalltypesofanemiafortheirchildren.The findingsalsoshowedthattherisksofmild,moderate,and severeanemiaweregreateramongthechildrenof vegetar-ianmothers.
Discussion
Detection of the risk factors is fundamental for planning and implementation of programs to eradicate child ane-mia, especially in those groups where prevalence is very high.Inthestudiedpopulation,almost7outof10children wereanemic.Thoughoverallanemiastatusdidnotpresent anysignificant variationin terms of sex, boys weremore affectedwithsevereanemiathangirls.Thisisprobablydue tofactthatthehighergrowthrateamongboysduringgrowth stagesresultsinhigheranemiaprevalence,astheirbodies demandahigheramountofiron,whichcannotbesupplied bythediet.14 Theage ofchild andmother’sanemialevel
predictedchildhoodanemia,similartothefindingsofsome
otherstudies conductedin Burma, Benin,and Mali.15,16 In
thepresentstudy,adecliningtendencyinrisksand
preva-lenceofanemiawasnoticedafter2yearsofage.Apossible
explanationfor the fall ofanemia prevalence withage is
thatthe ironintakes arelikelytoimprovewithage, asa
resultof amorevarieddiet,includingtheintroductionof
meatand other hemoglobin-containing diets.17 Household
wealth index and parents’ level of education was found
importantsocio-economicfactorsforchildanemia;thismay
be because of association of higher level with increased
chancesofhavingajobandincome,andconsequently,
eas-ieraccesstoiron-richfood.Mother’slevelofeducation,in
itsturn,influencesthepracticesrelatedtothechild’shealth
care.18
Vegetarianmothershadgreateroddstohaveanemic
chil-dren,probablyduetothefactthatvegetariandietsleadto
pooruseofbiologicalironinthebodyascomparedto
non-vegetarian diets; consequently, deficiency in the mother
leadstopoorphysiologicalreservesofironinthefetus.Itis
alsofoundthat,inseveralinstances,childrenofvegetarian
mothersarealsovegetarian,whichmaybeanotherreason
forhigherchancesofanemia.
In thestudied sample, 98.6% of Christian womenwere
non-vegetarian;thefindingsrevealedlesslikelihoodof
ane-mia for their children. Iron supplementation to pregnant
mothersalsoreducedthelikelihoodofchildanemia.
Unfor-tunately, most women start pregnancy without sufficient
storesofirontomeettheirbody’sincreaseddemands,
par-ticularly in the second and third trimesters; as a result,
irondeficiency anemiaamong youngchildren has become
amajorproblemworldwide.
A limitation of the study was that the effect of iron
supplementation and dietary habit of children on anemia
was not analyzed, because of a concerning lack of data.
Also,hemoglobinconcentrationforoneoftheIndianStates,
Nagaland, was not measured. Though the population of
Nagalandisverysmallascomparedtothetotalpopulation
ofthecountry,theincompletedatamayhaveledtosome
biasedestimates.Further,asthepopulationofthecountryis
verylarge,cross-sectionalstudydesignwasadopted;there
wasapossibilityofconfoundedeffects.However,
indepen-denceofpredictorswasjustifiedbymulticolinearitytest.
It can be concluded that the prevalence rate of child
anemiaisveryhighinIndia;pooreconomicstatusof
house-hold,lowlevelofparents’education,higherbirthorderof
child,vegetarianmother,mother’sanemia,andnon-intake
of ironsupplementsduringpregnancy increasethe risk of
childanemia.
Conflicts
of
interest
Theauthorsdeclarenoconflictsofinterest.
References
1.Ayoya MA, Ngnie-Teta I, Séraphin MN, Mamadoultaibou A, Boldon E, Saint-Fleur JE, et al. Prevalence and risk factors ofanemiaamongchildren6---59monthsoldinHaiti.Anemia. 2013;2013:502968.
2.SaraivaBC,SoaresMC,dosSantosLC,PereiraSC,HortaPM.Iron deficiencyandanemiaareassociatedwithlowretinollevelsin childrenaged1to5years.JPediatr(RioJ).2014;90:593---9. 3.JainN,JainVM.Prevalenceofanemiainschoolchildren.Med
PractRev.2012;3:1---4.
4.McLean E, Cogswell M, Egli I, Wojdyla D, de Benoist B. Worldwideprevalenceofanaemia,WHOvitamin andmineral nutritioninformationsystem, 1993---2005.PublicHealthNutr. 2009;12:444---54.
5.El-GhamrawyMK,HannaWM,Abdel-SalamA,El-SonbatyMM, YounessER,AdelA.Oxidant-antioxidantstatusinEgyptian chil-dren withsickle cell anemia: asingle centerbased study.J Pediatr(RioJ).2014;90:286---92.
6.OliveiraMA,OsórioMM,RaposoMC.Socioeconomicanddietary riskfactorsforanemiainchildrenaged6to59months.JPediatr (RioJ).2007;83:39---46.
7.OsórioMM, Lira PI, Ashworth A. Factors associated withHb concentrationin childrenaged 6---59 months in theState of Pernambuco,Brazil.BrJNutr.2004;91:307---15.
8.SidhuS,KumariK,UppalM.PrevalenceofanaemiainBazigar (ex-nomadictribe)preschoolchildrenofPunjab.JHumEcol. 2007;21:265---7.
9.Jai Prabhakar SC, Gangadhar MR. Prevalence of anaemia in Jenukuruba primitivetribal children ofMysore district, Kar-nataka.Anthropologist.2009;11:49---51.
10.MinistryofHealthandFamilyWelfare(MoHFW),Governmentof India.Nationalfamilyhealthsurvey-III(NFHS-III),2005---2006: India,vol.1.NewDelhi:MoHFW;2007.
11.WorldHealthOrganization(WHO).Haemoglobinconcentrations forthediagnosisofanaemiaandassessmentofseverity.Vitamin andmineralnutritioninformationsystem.Geneva:WHO;2011. 12.KleinbaumDG,KleinM.Logisticregression:aself-learningtext.
13.Gwatkin DR, Rutstein S, Johnson K, Pande RP, Wagstaff A. Socio-economic differences in health, nutrition and poverty. HNP/povertythematicgroupoftheWorldBank.Washington, DC:TheWorldBank;2000.
14.GaoW,YanH,WangD,DangS,PeiL.Severityofanemiaamong childrenunder36monthsoldinruralwesternChina.PLOSONE. 2013;8:e62883.
15.ZhaoA,ZhangY,PengY,LiJ,YangT,LiuZ,etal.Prevalenceof anemiaanditsriskfactorsamongchildren6---36monthsoldin Burma.AmJTropMedHyg.2012;87:306---11.
16.Ngnie-TetaI,ReceveurO,Kuate-DefoB.Riskfactorsfor mod-erate to severe anemia among children in Benin and Mali: insights from a multilevelanalysis. FoodNutrBull. 2007;28: 76---89.
17.OsórioMM,LiraPI,Batista-FilhoM,AshworthA.Prevalenceof anemiainchildren6---59monthsoldinthestateofPernambuco, Brazil.RevPanamSaludPublica.2001;10:101---7.