ISSN 0104-6632 Printed in Brazil
www.abeq.org.br/bjche
Vol. 22, No. 02, pp. 165 - 172, April - June, 2005
Brazilian Journal
of Chemical
Engineering
INVESTIGATION OF COALESCENCE KINETICS OF
MICROCRISTALLINE CELLULOSE IN FLUIDISED
BED SPRAY AGGLOMERATION – EXPERIMENTAL
STUDIES AND MODELLING APPROACH
M. Peglow
1*, J. Kumar
1and L. Mörl
11
Otto-von-Guericke-University of Magdeburg, Institute of Process Equipment and Environmental Technology, D - 39106 Magdeburg,
E-mail: [email protected]
(Received: October 20, 2004 ; Accepted: November 20, 2004)
Abstract - In this paper a model for fluidized bed spray agglomeration is presented. To describe the processes of heat and mass transfer, a physical based model is derived. The model takes evaporation process from the wetted particles as well as the effects of transfer phenomena between suspension gas and bypass gas into account. The change of particle size distribution during agglomeration, modeled by population balances, is linked to the heat and mass transfer model. A new technique is derived to extract agglomeration and nucleation rates from experimental data. Comparisons of experiments and simulations are presented.
Keywords: Fluidized bed; Agglomeration; Drying.
INTRODUCTION
The fluidized bed spray agglomeration has prevailed as a continuous thermal treatment method for granular solid matter due to its high mass and heat transfer ratios, as well as due to the coupling of the wetting, drying, particle enlarging, shaping, homogenization and separation processes. Products which are initially liquids, such as solid matter solutions, suspensions, emulsions or melts, are transformed into high-quality, free-flowing, low-dust granular solid matters. This is achieved (a) by converting the solids suspended in liquids into granules, (b) by transforming the powder-like accumulating solids into granulates or (c) by coating the solid granulates.
Beside material composition, the particle size distribution (PSD) can have a significant impact on
quality of agglomerates. The PSD influences different material properties like bulk density, flow characteristics etc. In order to control the quality of agglomerates, processes which influence their properties have to be understood. The aim of this study is to describe the process of fluidized bed spray agglomeration using population balances and to derive agglomeration rate model in particular.
MODELLING APPROACH
Model for Fluid Bed Drying
The drying model based on a simple two-phase-approach with an active bypass is shown in Figure 1 (see Groenewold et al., 1997). The assumptions for the model are given below.
§ The bypass fraction is free of solids and it is in plug flow.
§ All solids are in the suspension phase. The
suspension is in plug flow. No back mixing occurs.
§ The particles are ideal mixed.
§ Vapor and heat transfer take place between suspension and bypass phase.
§ Vapor and heat transfer take place between surface of particles and gas in suspension phase. Water spayed in is deposited on particles.
§ Wall may exchange heat with environment, particles, suspension gas and bypass gas.
Figure 1: Scheme of the fluid bed model
(a) Balance Equations
According to Figure 1, the following mass and heat balances for all phases can be derived.
Suspension gas
(
)
(
)
(
)
s s
g g
ps sb
Y Y
1 dM 1 M d
t
dM dM
∂ ∂
− ν = − − ν ξ +
∂ ∂ξ
+ −
&
& &
(1)
(
)
(
)
(
)
s s
g g
ps sb ps bs sw
h h
1 dM 1 M d
t
dH dH dQ dQ dQ
∂ ∂
− ν = − − ν ξ +
∂ ∂ξ
+ − − + −
&
& & &
& &
(2)
Bypass gas
b b
g g sb
Y Y
dM M d dM
t
∂ ∂
ν = −ν ξ +
∂ & ∂ξ & (3)
(
)
b b
g g
sb bs bw
h h
dM M d
t
dH dQ dQ
∂ ∂
ν = −ν ξ +
∂ ∂ξ
+ − −
&
& &
&
(4)
Particles
p
ps np
X M
M M
t
∂
= − +
∂ & & (5)
p
ps np sp pw
H
H H Q Q
t
∂
= − + + −
∂ & & & & (6)
Wall:
w
w bw sw pw
h
dM dQ dQ dQ
t
∂ = + +
The parameter ν is the ratio of gas flowing through the bypass to total gas flow rate. This value is calculated using a relationship by HILLIGARDT and WERTHER (1986)
0 mf
r
0
Re Re Re
−
ν = ν (8)
This parameter depends on GELDART classification of particles and bed height. For presented experiments, particles of GELDART classification B were used. For the investigated range Hilligardt and Werther (1986) proposed the following equation:
[
]
bed 0.5
bed bed
bed
0.67 z d 1.7
0.51 z d 1.7 z d 4
1 4 z d
<
ν = ≤ ≤
<
(9)
Equations proposed by Martin et al., (1994) are used to calculate hydrodynamic parameters of fluidized bed. Heat and mass transfer coefficients are determined by correlation of Gnielinksi et al., (1980).
(b) Kinetics
To close the balance equation system the dependencies of mass and heat flow rates have to be known:
(
)
( ) ( )
ps ps g p eq P s
M& = β ρ A Y X,T −Y ξ ν η& (10)
(
)
ps ps w,g ps v
H& =M& c T + ∆h (11)
( )
sp ps ps p s
Q& = α A T −T ξ (12)
pw pw w p w
Q& = α A T −T (13)
(
)
( )
sw gw w s w
Q& = α 1− ν A T ξ −T (14)
( )
bw gw w b w
Q& = α νA T ξ −T (15)
[
]
we we w w e
Q& = α A T −T (16)
( )
( )
sb sb g s b
M& =NTU M& Y ξ −Y ξ (17)
( )
( )
sb sb g s b
M& =NTU M& Y ξ −Y ξ (18)
(
)
sb sb w,g sb v
H& =M& c T + ∆h (19)
( )
( )
sb sb g g b s
Q& =NTU M c& T ξ −T ξ (20)
Model for Agglomeration and Nucleation
(a) Balance Equations
The agglomeration and nucleation process for batch vessels is described by means of population balance (PBE)
( )
v(
) ( ) (
)
( ) (
) ( )
( )
0
0 0
n v, t 1
t,u,v u n u, t n v u, t du n v, t t,u,v n u,t du B t, v
t 2
∞
∂
= β − − − β +
∂
∫
∫
(21)which describes the time dependent particle size distribution (PSD). The two parameters which have a large impact on the shape of PSD are the agglomeration rate β, defined by
(
t,u,v u)
0( ) (
t u,v u)
β − = β β − (22)
and the time-size dependent nucleation rate B0.
(b) Kinetics
In literature nucleation is often considered as
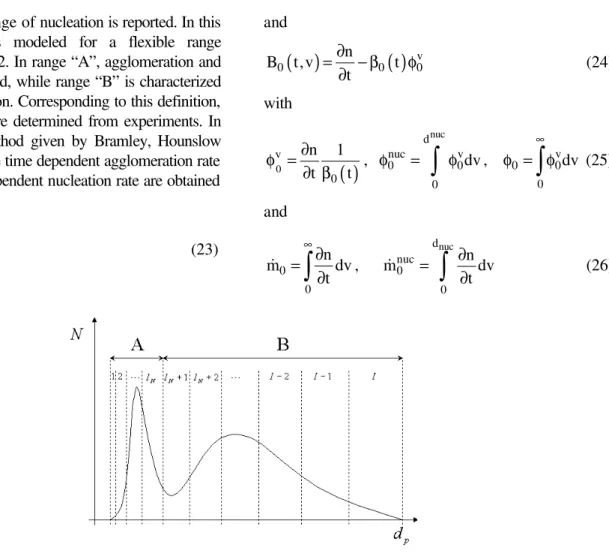
2000µm, a wide range of nucleation is reported. In this paper nucleation is modeled for a flexible range according to Figure 2. In range “A”, agglomeration and nucleation is expected, while range “B” is characterized by pure agglomeration. Corresponding to this definition, kinetic parameters are determined from experiments. In dilatation of the method given by Bramley, Hounslow and Ryall (1996), the time dependent agglomeration rate constant and size dependent nucleation rate are obtained from
( )
0 nuc00 nuc
0 0
m m
t −
β =
φ − φ
& &
(23)
and
( )
( )
v0 0 0
n
B t,v t
t ∂
= − β φ
∂ (24)
with
( )
0 v 0 n 1 t t ∂ φ =∂ β ,
nuc d nuc v 0 0 0 dv
φ =
∫
φ , 0 v00
dv
∞
φ = φ
∫
(25) and 0 0 n m dv t ∞ ∂ = ∂∫
& , nuc d nuc 0 0 n m dv t ∂ = ∂∫
& (26)
Figure 2: Scheme of the agglomeration and nucleation model
To extract kinetic constants, the continuous PBE has to be transformed into a discrete form. Therefore a adjustable discretisation method of Litster, Smith and Hounslow (1995) is applied. Using a parameter q, the volume coordinate is divided into a number of intervals
1 q
i 1 i
v+ =2 v (27)
For this discretisation method, Litster, Smith and Hounslow (1995) derived the following discrete formulation of PBE:
i S(q) 1 ( j i 1) / q q i S(q k 1) k ( j i 1) / q (k 1) / q
i
i 1, j i 1 j 1 / q i k,j i k j 1 / q
j 1 k 2 j i S(q k 2) k 1
i S(q k 1) k 1 1/ q ( j i ) / q (k 1) / q
i k 1, j i k 1 j 1 / q
k j i S(q k 2) k 2
dN 2 2 1 2
N N N N
dt 2 1 2 1
2 2 2
N N 2 1 − − − + − − + − − + − − − − − − = = = − − + − + − − + − + − − − − + − + = = − − + − + − +
= β + β
− − − − + β −
∑
∑
∑
∑
q 2 i q,i q i q 2i S(q) ( j i) / q I
i,j i j 1 / q i,j i j 0,i
j 1 j i S(q) 1
1
N 2
2
N N N N B
2 1
− − −
− −
= = − +
+ β
− β − β +
−
∑
∑
∑
with
( )
qj 1
S q j
=
=
∑
(29)Using equations (23), (24)and (28) kinetic parameters can be determined. For the presented experiments, the best agreement between experiment and simulation results were obtained for the following size dependent agglomeration rate
(
u,v u)
u v uβ − = + − (30)
EXPERIMENTS
Experimental Setup
The agglomeration processes were carried out in a commercial fluidized bed apparatus of GLATT
company Type GPCG 1.1 (Figure 3). For experiments microcrystalline cellulose (MCC), which is widely used in pharmaceutical industry as a carrier material for active agents, was chosen. As binder PHARMACOAT 606 was used. For experiments, the apparatus was heated up until constant temperatures (outlet gas, wall) were achieved. Then a sieved fraction (65µm-125µ m) of MCC was fed into the agglomeration vessel. After a short drying period of 10min, the binder solution was sprayed in by a two-component jet (Type 970/S4 SCHLICK company). During agglomeration process samples were taken continuously. Beside particle moisture content (Halogen Moisture Content Analyzer), PSD was measured of these samples. The CAMSIZER system (RETSCH TECHNOLOGIES), which bases on digital picture processing, was used for particle size and particle shape characterization. Some chosen parameters are summarized in Table 1
Figure 3: GPCG 1.1 GLATT
Table 1: Process Parameters
bed
m
0.15 kgg
M
&
0.013 kg/s g,inϑ 55°C
g,in
Y 9.5 g/kg
np
M
&
8 g/min binderExperimental Results
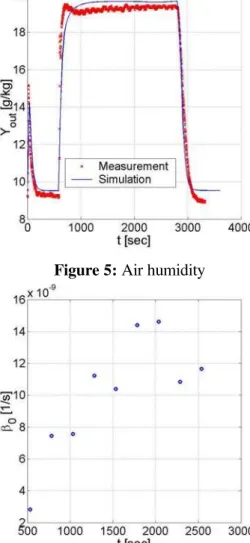
Figure 4 to Figure 8 show the comparison of experimental and simulation results. The decay of outlet gas temperature and outlet air humidity exemplifies the drying process up to 600sec. As soon as the binder is sprayed in, outlet humidity increases rapidly, while temperature decreases much slower due to heat capacity of particles and apparatus wall. The wetting and drying processes can also be observed in particle moisture content plot. During drying no samples were taken, but the slight increase of particle moisture during agglomeration predicted by simulation was also certified in experiment. This slight changes are caused by the decrease of particle temperature (Figure 4). According to following equation
(
)
(
)
eq p
w eq
g eq p
p X, M
Y
M p p X, ϑ =
− ϑ
%
% (31)
where the equilibrium vapor pressure is obtained from adsorption isotherm
(
)
( ) (
)
eq p sat p eq p
p X,ϑ =p ϑ ϕ X,ϑ (32)
a lower particle temperature causes a lower equilibrium humidity. The PSD’s obtained from experiments and from simulations shows good conformity. Starting with a narrow one-modal distribution at t = 530sec, particle enlargement up to 1mm can be observed. Due to nuclei formation the shape of PSD changes to bimodal distribution.
Figure 4: Gas and particle temperature Figure 5: Air humidity
CONCLUSIONS
In this paper a model for fluidized bed spray agglomeration is presented. The new technique derived to extract agglomeration and nucleation rates from experimental data shows his high capability to describe poly-disperse nuclei formation. With this approach, bimodal distributions observed in experiments were predicted by simulations. Further investigations are related to find dependencies of agglomeration rate constant on parameters described by heat – mass transfer model, e.g. particle moisture content.
NOMECLATURE
A Surface area m2
Ar Archimedes number (-)
B0 Birth rate 1/s
d Diameter m
0
m& Change of total number 1/s
M Mass kg
h& Specific enthalpy flux J/kg/s
H& Enthalpy flux J/s
M& Mass flux kg/s
n Number density 1/m
N Number (-)
P Pressure Pa
q Parameter (-)
Q& Heat flux J/s
Re Reynolds number (-)
t Time S
T Temperature °C
u Volume coordinate m3
3
X Particle moisture content kg/kg
Y Air humidity kg/kg
z Length coordinate m
Greek Symbols
α Heat transfer coefficient W/m2/K
β Mass transfer coefficient m/s
0
β Agglomeration Rate 1/s
0
φ Coefficient defined by equation (25)
1/s
ν Bubble fraction (-)
η Normalized particle moisture content
(-) υ& Normalized drying rate of
single particle
(-)
ξ Dimensionless bed height (-)
Subscripts
b Bypass phase (-)
bed Bed (-)
e Environment (-)
mf Minimal fluidization (-)
n Nozzle (-)
p Particle (-)
s Suspension phase (-)
eq Equilibrium (-)
Sb Suspension-Bypass (-)
0 Superficial (-)
Superscripts
in inlet (-)
nuc nuclei (-)
out outlet (-)
v Volume v (-)
REFERENCES
Bramley, S., Hounslow, J., Ryall, L. 1996. Aggregation during precipitation from solution: A method for extracting rates from experimental data. Journal of colloid and interface science, Vol. 183, pp. 155-165.
Groenewold, H., Tsotsas, E. 1997. A new model for fluid bed drying, Drying Technology, Vol. 15, pp. 1687-1698.
Gnielinski, V. 1980. Wärme- und Stoffübergang in Festbetten, Chemie-Ingenieur-Technik, no. 52, pp. 228-236.
Litster, J., Smith, J., Hounslow, J. 1995. Adjustable discredited population balance for growth and aggregation. AIChe Journal, Vol. 41. No. 3, pp. 591-603.
Madelung, O. 1992. Landolt-Börnstein, Zahlenwerte und Funktionen aus Naturwissenschaften und Technik, Band 2a von II, pp. 32-61.