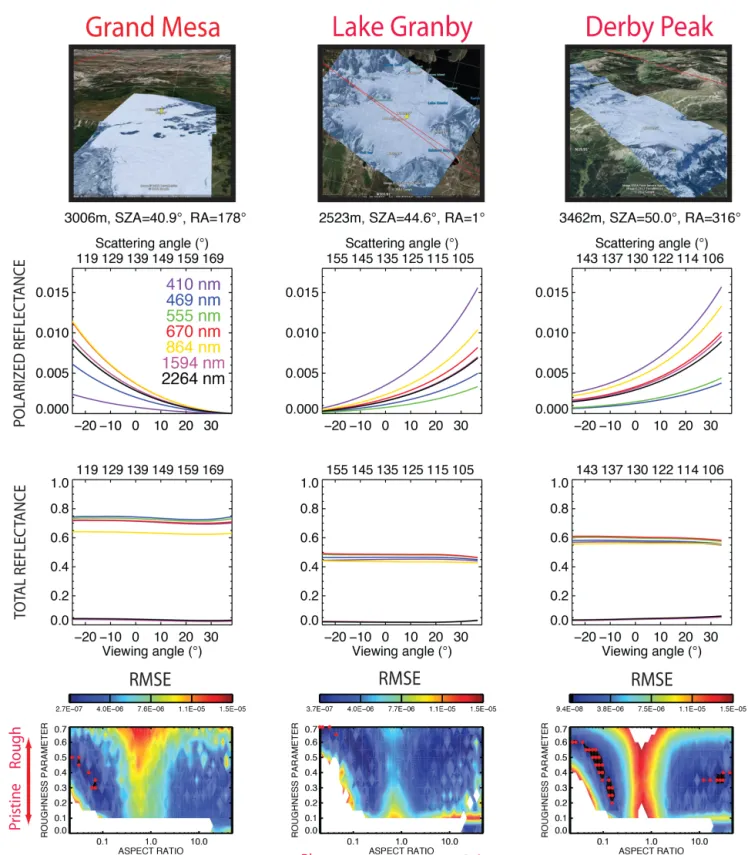
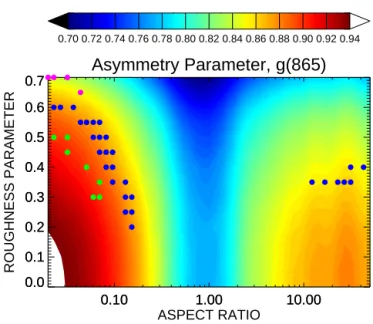
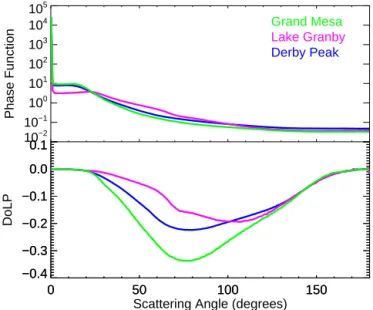
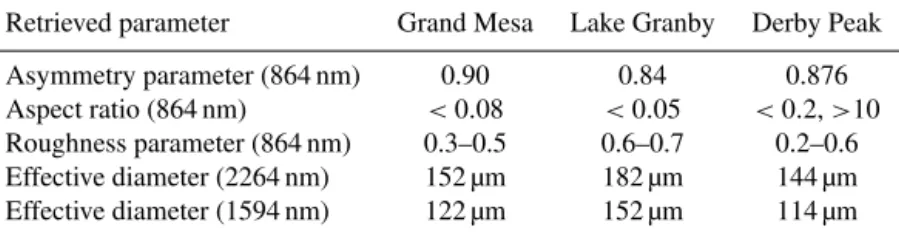
Photopolarimetric retrievals of snow properties
Texto
Imagem
Documentos relacionados
The algorithm finds the model of smallest order that fits the data, within a precision; besides it is an effective method for analysis of structures with close
The function I (z) ˜ is found by measuring light reflectance from snow walls and can be used to retrieve the optical and microphysical properties of the snow layers at any depth..
In addition, the melt percentage of the annual accumula- tion at Lomonosovfonna is obtained by using a positive degree day and a snow-energy model approach, and used together with
Spectral reflectance of (a) the natural snow surface and (b) bare ice with manually removed snow cover in the study lakes: 1, Lovojärvi; 2, Pääjärvi; 3, Iso Valkjärvi; 4, Peipsi;
ter of snow for a given scene by matching the measured reflectance with a simulated value assuming an ice crystal model with an asymmetry parameter consistent with the
To investigate the influence of snow depth, sea ice density, and area on sea ice thick- ness and volume estimates we use freeboard retrievals from ICESat, together with dif-
Left panel is the false colour composite (red is 11 µm BT, green is 550 nm reflectance, blue is 1.6 µm reflectance) of initial AATSR scene; second left panel is the clear snow mask
Results are qualitatively consistent with the fluid model: the effective plasma frequency decreases, and the frequency range of the Alfvén branch is reduced when the temperature
