1734 Brazilian Journal of Physics, vol. 34, no. 4B, December, 2004
Glow Discharge Plasma Properties of Gases
of Environmental Interest
R. Castell, E. J. Iglesias, and J. Ruiz-Camacho
Universidad Sim´on Bol´ıvar, Departamento de F´ısica, Caracas, VenezuelaReceived on 2 February, 2004
Experiments in a low pressure glow discharge on gases of environmental relevance: CO2,CO y O2are
repor-ted. We studied the various atomic processes: ionization, excitation and molecular dissociation with typical discharge parameters of p∼0.6 mbar, I≤0.1 A and V∼1100 Volts. We used visible and near UV spectroscopy to observe the emitted radiation on both electrodes on pure gases and hydrogen seeded mixtures. We also set up Langmuir probes in both electrodes.
1
Introduction
Low pressure linear discharges are a well known plasma producing device although highly anisotropic, non-homogeneous, non-equilibrium systems. The electron pro-duction and gas ionization at the cathode region, are com-plex mechanisms that make the balance of particles and cur-rent continuity still subjects of research [1-4]. The detailed understanding of those mechanisms are fundamental for in-dustrial applications where large plasma volumes are requi-red [4].
In this work we centered our attention in gases of envi-ronmental interest which oftenly show up in a plasma state in different physical scenarios such as: fusion research, in the presence of wall originated impurities in the after glow of the discharge, industrial processes where plasma etching is required and astrophysical plasmas present in comet tails, among others.
In this work we have concentrated in a comparative study of the discharge parameters namely, the various tem-peratures and the electron density. In particular, we dis-cuss comparisons between Langmuir probe and spectrosco-pic measurements. We also propose a simple method to de-termine the molecular temperature of CO+2 using the
Dop-pler width of an isolated line in theΛ2Σ+ → X2Π
double band of this molecular ion.
2
Experimental procedure
We used a low pressure glow discharge, with two 5 cm di-ameter brass electrodes separated 50 cm. Typical discharge parameters were, p∼0.6 mbar, I≤0.1 A and V∼1100 Volts. A pyrex tube was equipped with viewing ports with lines of sight along the axis of the discharge and at 45◦ to both
anode and cathode front surfaces. To switch our line of sight between electrodes we toggle a mirror in an out of the sys-tem (Fig. 1). The same ports were used to slide and hold the Langmuir probes. Pure and mixed gases were available using an external manifold.
Figure 1. Experimental setup showing the Langmuir probe and spectroscopy collecting optics.
2.1
Spectroscopy
We have performed visible and near UV spectroscopy on ra-diation originated along the discharge axis and on both elec-trodes at 45◦off axis. A f/10 quartz or glass lens focuses the
R. Castellet al. 1735
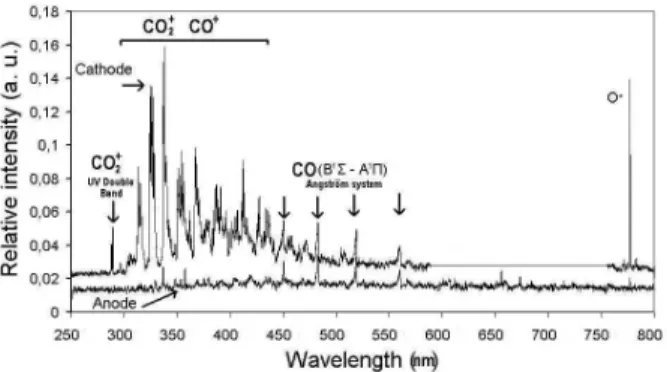
Figure 2. CO2discharge, spectral emission at anode and cathode.
Comparison of the spectra of a CO2gas discharge measured at the
cathode and anode electrodes in the region from 250 nm to 800 nm. Gas pressure: 0.6 mbar. Discharge current: 40 mA, 100µm slit width. Second order lines were suppressed from the cathode trace for simplicity.
Optical emission spectroscopy (OES) shows a remar-kable difference between cathode and anode emission for CO2under the same pressure (0.6 mbar) and discharge
cur-rent(40 mA) conditions, see Fig. 2. From the central part of the cathode the spectrum exhibits the typical CO+2 near UV
bands. There is also evidence of the presence of the so called Angstr¨om system (B1Σ
- A1Π
) for CO [6] and the characte-ristic OI (777 nm) multiplet (5S - 5P) emission. The typical ionization channel from CO2 to CO+2 requires of an
ioni-zation energy≈14 eV. Starting with CO+2 there are several
channels that produce all the species present in the discharge and require between 5.8 and 8 eV for activation [7].
Near the anode only the Angstr¨om system from CO was observed but nor the molecular emission from CO2 -that
mostly falls in the infrared-, neither the strong OI (777 nm) emission were present. All the positive ions were also ab-sent since they stay in the most favorable region at the ne-gative cathode. The presence of CO but weak OI lines near the anode may respond to CO molecules generated near the cathode that due to its higher ionization and excitation ener-gies have a high probability to diffuse along the discharge. However, the presence of very weak bands in the region between 350-450 nm, that belong to CO+
system, lead us to believe that CO and OI could also be produced along the discharge column.
Figure 3 shows a comparison for the emission spectra at the cathode from pure CO+2, CO and O2 gas discharges,
all at 0,6 mbar and 40 mA. Calibration lines from a He-Ne laser and from a Hg Lamp were taken simultaneously. The cathode emission from the CO gas discharge exhibits a typi-cal molecular spectrum from CO [10] and again, no appreci-able emission from OI was present (as in the anode emission from pure CO2). The O2gas cathode emission presents
se-veral weak bands and the strong OI line at 777 nm.
Figure 3. Comparative emission spectra from CO2, CO and O2
gas discharges measured in the center of the cathode. All measu-rements taken at 0.6 mbar and 40 mA . These spectra were taken with a glass lens that suppresses all radiation below≈300 nm.
2.2
Langmuir probe measurements
We measured the Langmuir probe I vs. V characteristic curve in both electrodes and for different gases. From those curves we inferred values for the electron temperature and density. It is important to mention that probe behavior dif-fers significantly between situations where collisions can be ignored and those where they cannot. The effect of collisi-ons is mainly to reduce the current collected by the probe due to diffusion of particles in the plasma region around it [8]. The condition to ignore collisions in the plasma is that
l ≫ a, wherea is the probe radius and l is the electron mean free path. Thus, in our case, we are working with plasmas whose parameters are: electron temperatures (Te) from 0.3 to 1 eV, and electron densities (Ne) from 3×10⁹
cm−3
to 2×10¹⁰
cm−3
approximately. For these values the mean free path goes from 7 to 30 cm. Fora= 5 mm we the conditionl ≫ ais fulfill and collision effects can be ignored.
The Langmuir probe, was positioned at 1 cm from the cathode surface along the axis. For classical low-pressure glow discharges, it is known that electrons in the usually sub-cm cathode fall region are not in equilibrium with the local electric field [9]. This fact was corroborated in our case by measuring the relatively constant DC potential between the anode and the Langmuir probe along several points of the discharge axis, up to a distance 3 to 4 mm away from both electrodes. As the gas pressure is elevated closer to the atmospheric pressure, the much increased collision between electrons and neutral particles significantly reduces the thickness of the cathode fall region to around 300µm ( 5×λD) [3,4]. Over this narrow width, secondary electrons released from the cathode are unlikely to gain sufficient ac-celeration and reach equilibrium with the local electric field.
2.2.1 Electron temperature
Electron temperatures vs. current measured on the cathode (N) and anode (△) region of a pure CO2 discharge, see
1736 Brazilian Journal of Physics, vol. 34, no. 4B, December, 2004
be due to the unstructured (no striations) configuration ob-served during the discharge, which is dominated by the ne-gative glow. When the discharge current was varied from 10 mA to 50 mA, for CO2, the electron temperature was
found to increase from 0.3 eV to 0.8 eV respectively. For a CO+2+H mixture with a breakdown parameter pd
equi-valent to the CO2 case, the electron temperatures obtained
were within the experimental uncertainty to the correspon-ding ones with CO2only. This result suggest that the
mole-cular excitation process does occur along the whole plasma length.
Figure 4. Measured electron temperatures inferred from Langmuir probe: N: pure CO2 cathode;△: pure CO2 anode;¨: CO2+H
mixture anode.¥: inferred from H-Balmer wavelength integrated intensities CO2+H, cathode. The size of the symbols is
proportio-nal to the experimental uncertainties.
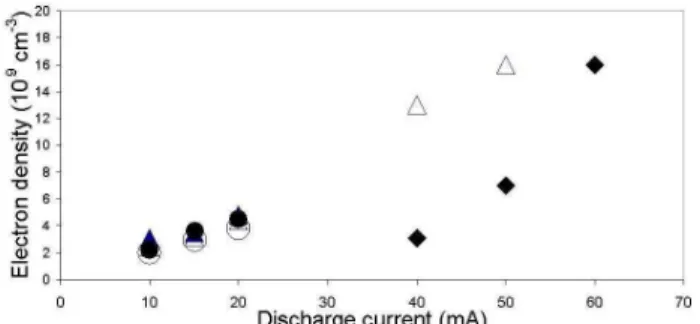
Figure 5. Electronic densities inferred from Langmuir probe mea-surements as a function of the current. CO2discharge,N: cathode; △: anode. CO2-H mixture,¨: anode. CO discharge,
•
: cathode;◦
: anode. Gas pressure: 0,6 mbar in all cases. The size of the symbols is proportional to the experimental uncertainties.2.2.2 Electron density
The electron density was determined using the electron tem-perature value and the electron current saturation measured from the Langmuir probe I vs V curves. Electron current saturation values from 2.4×10⁻⁶
A to 16×10−6
A where measured for discharge currents between 10 to 50 mA res-pectively. For CO2+H mixture, we observe that the
elec-tron temperature changed around 6%, compared with CO2
experiment. On the other hand, the electron density (see Fig. 5), decreased by a factor of 4.2 for 40 mA, and 2.3 for 50 mA. That means, hydrogen gas increases the electron mobility in the mixture, reducing the electron density along
the discharge column. For low current discharge, most of the power deposited in the ions is transferred to kinetic energy of the neutral gas. It is important to point out that we work with a stable glow discharge to avoid the onset of instabi-lities in the region near the electrodes, particularly in the cathode region, because this is the region of higher power density.
2.3
Cathode temperatures using light
emis-sion
2.3.1 Electron temperature using H Balmer lines
The measured electron density values∼109
cm−3
indicate that for the expected electron temperatures in a low pressure DC discharge, the system should be in a steady-state corona model (SSC) [11]. In such model the equilibrium is achie-ved by collisional excitation and spontaneous emission. The measured integrated intensity ratio between two lines of the same ionization stage in SSC depends only on the electron temperature, and is given by the following expression [12]:
I(λji)
I(λkl)
= X(Te,0, j)Bji
X(Te,0, k)Bkl
(1)
X(Te,0, j) =
6.45×10⁻⁴ f(0, j)
χ(0, j)T12 e
exp
µ
−χ(0, j)
Te
.
(2) Wherej(k)andi(l)are the upper and lower states of the transitions. Bji is the branching ratio for a specific transi-tion from leveljto leveli, to the total transition probability from levelj.X(Te,0, j)is the excitation rate coefficient for the electron impact excitation from the ground state to level
j.
In a mixture CO2+H ( 80%CO2and 20%H) the
elec-tron temperature inferred from the different ratios of the wa-velength integrated intensity for the Balmer series Hα, Hβ y Hγ was 0.35±20% eV. The lower value, obtained by this method, in comparison to the Langmuir probe measure-ments is due to the radial gradient that is sample along the 45◦line of sight.
2.3.2 CO+2 temperature
Determination of molecular or molecular ion temperatures in a linear discharge using the radiated emission, is typically done by measuring [3] the relative intensities distribution of the line components in the molecular band and then match it to a model where there is only one fitting parameter, the temperature. An alternative method is to find an isolated line within the molecular band, which are rarely found in molecular spectra, and measure its Doppler width, which is a very demanding measurement resolution-wise.
Even with very small amounts of CO2the double band
of CO+2 centered atλ= 288.3andλ= 289.6nm is always
R. Castellet al. 1737
various negative (R branch) and positive (P branch) com-ponents (Fig. 6). Although the origin of these two central components is not certain [7], they seem to belong to the Q branch (∆J=0).
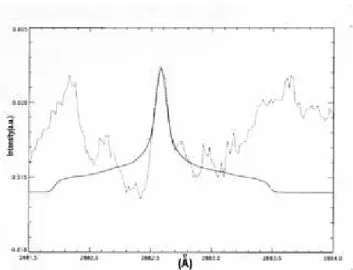
We measured the profile of the central component at 288.3 nm with a narrow slit 10 µm(0.01 nm instrumental full width at half maximum), and found that the full width of the line was above the instrumental width. We then fitted a synthetic profile resulting from the convolution of the ins-trument function (0.01nm) and a gaussian that takes into ac-count the Doppler contribution. We obtained a Doppler full width of 0.005 nm from the best match between the synthe-tic and experimental profile (Fig. 6), and inferred an upper limit of 2.5 eV for the CO+2 temperature.
Figure 6. The relative intensity spectrum (dotted line) of one of the CO+
2 (Λ 2
Σ+
→X2
Π) bands centered atλ288,3 nm. The figure shows an expanded view of the center portion of the band with the well differentiated and isolated central component (Q-branch head). The best synthetic profile fit (solid line) to the central com-ponent indicates an upper limit of 2.5 eV for the CO+2 temperature.
˚
A units were used for convenience.
3
Conclusions
OES measurements have confirmed that this type of gas dis-charge is optically very active near the cathode (negative column) due to the high energy electrons produced there. For the discharge in CO2, the presence of CO
+
2, CO and
OI emissions shows that there is enough energy for the ac-tivation in the cathode of the respective ionization and dis-sociation processes. Observations at the anode indicate the possibility that CO could be produced along the plasma co-lumn as well. We have measured the electron temperatu-res and densities using a Langmuir probe for different gases and discharge regions (anode and cathode). These results are consistent with the probe sampling the main column of the discharge at about 1 cm from each electrode. We have derived electron temperatures CO2+H mixture, near
the cathode, using a SSC equilibrium atomic model and the measured wavelength integrated intensity ratios of the Bal-mer lines of Hydrogen. We also inferred an upper limit for the temperature of CO+2 at the cathode from the Doppler
width of the Q branch of the 288.3 nm CO+2 band. A better
determination of this temperature, using this method, will require a more systematic investigation.
References
[1] J. J. Shi and M. G. Kong, J. Applied. Phys.94, 5505 (2003).
[2] T. Rieper, J. Neumann, and V. Helbig, Spectral Line Shapes
11, 82 (2001).
[3] V. I. Arkhipenko, S, M, Zgirouski, A. A. Kirillov, and L. V. Simonchik, Plasma Physics Reports,28, 930 (2002).
[4] V. I. Arkhipenko, A. A. Kirillov, and L. V. Simonchik, XXVI, International Conference on Phenomena in Ionized Gases, Contributed paper, Greifsswald, Germany 2003.
[5] M. Nagulapally, G. V. Candler, C. O Laux, D. Packan, C. H. Kruger, R. Stark, and K. H Schoenback, American Institute Aeronautics and Astronautics, 2000, 2417.
[6] R. C. Johnson and R. K Asundi. Proceedings of the Royal Society.123, 560 (1929).
[7] F Bueso-Sanhelli, Physical Review,60, 556, 1941.
[8] I. H. Hutchinson, Principles of Plasma Diagnostics (Cam-bridge Press, 1987).
[9] P. Yu P. Raizer, Gas Discharge Physics (Springer, Berlin, 1991).
[10] A. Gaydon and R. Pearse.The identification of Molecular Spectra(Chapman and Hall, London. 1976)
[11] H. R. Griem,Principles of Plasma Spectroscopy, Cambridge, 1996.