ABSTRACT: This study examines the development of a system that assists in planning light activities of the Academia da Força Aérea (AFA) so that meteorological data can be used to predict the occurrence of fog. This system was developed in MATLAB 8.0 by applying multilayer perceptron-type artiicial neural networks and using an error correction algorithm called backpropagation. The methodology used to implement the network comprises eight input variables, ive neurons in the intermediary layer, and one neuron in the output layer, which corresponds to the presence or absence of fog. The fog phenomenon is very important for the study and deinition of light strategic planning. Data taken from 1989 to 2008 and related to the input variables were used for the training and validation of the proposed network. Consequently, the multilayer perceptron network has a 95% reliability compared with the data collected. This high level of reliability is an exceptional result for the management, planning, and decision making team of the AFA strategic group. Thus, it can be concluded that the proposed system is eficient and will subsidize, with good safety margin, AFA’s light activity planning and could also be applied to other air activities in Brazil.
KEYWORDS: Strategic planning, Operational management, Intelligent systems, Decision support systems.
Application of Artiicial Neural Networks
for Fog Forecast
Rosângela de Oliveira Colabone1, Antonio Luiz Ferrari1, Francisco Arthur da Silva Vecchia2,
Adriano Rogério Bruno Tech3
INTRODUCTION
One of the concerns of the scientiic community and certain sectors of society in recent years with respect to meteorological factors and their consequences in relation to all the social, environmental and economic implications. his leads companies and institutions to develop strategies in order to predict future situations to mitigate possible adverse situations.
Low visibility in bad weather conditions (even in fog) may adversely afect society. Fog afects air, sea, railway, and road transport systems, requiring speciic safety measures to prevent accidents, delays, and even cancellation in transport operations (Gultepe et al., 2007).
Fog is formed due to condensation of water vapor into liquid droplets or ice crystals as a result of air cooling, humidiication, and/or by mixing contrasting air portions. A most common form of fog occurs when its formation on land involves nocturnal radiative cooling under low wind conditions (Roach, 1995) when dissipation usually occurs a few hours ater sunrise because of the heat lux on a surface heated by solar radiation.
Fog has signiicant importance in the airport sector, taking into account the considerable restriction of landing and takeof, afecting aircrat and passengers’ safety. he forecast of weather events is becoming increasingly vital in various sectors of society, such as in agriculture, construction, economics, public health, transportation, especially in aviation, as it is susceptible to weather conditions, which may cause delays and light cancellations or even air accidents or incidents due to the adverse conditions, indicating the need for confronting possible problems. Although the occurrence of fog is inevitable, airport and road authorities speciically require a more reliable
1.Academia da Força Aérea – Pirassununga/SP – Brazil. 2.Universidade de São Paulo – Escola de Engenharia de São Carlos – São Carlos/SP – Brazil. 3.Universidade de São Paulo – Faculdade de Zootecnia e Engenharia de Alimentos – Pirassununga/SP – Brazil.
Photos: Rosângela de Oliveira Colabone.
Figure 1. Illustrative photos of reduction visibility due to fog occurrence on the AFA airield – Pirassununga/SP.
forecast. he interest in studying the meteorological variables in airields, especially the fog phenomenon, is in the need to obtain, in advance, information on weather conditions at the local scale, for changes in the planning of light activities if necessary.
he concepts of the meteorological variables presented herein can be found in the Manual of Surface Weather Station (MCA 105-2; Brasil, 2013). For the Departamento de Controle do Espaço Aéreo, fog formation is characterized when the prevailing visibility is reduced to below 1,000 m.
he restriction of visibility due to fog formation occurs sharply at Academia da Força Aérea (AFA) aerodrome, in the municipality of Pirassununga, São Paulo State, as shown in Fig. 1.he occurrence of fog causes cancellations of lights, leading to delays and changes in the training schedule.
Several studies have been conducted to establish a pattern of the phenomena occurrence, with the objective of short-term forecasting, which, theoretically, will allow the reduction of operating costs and time (Rezende, 2005).
Tarmeňo and Altamirano (2004) performed a climate study of fog events in Jorge Chavez Callao International Airport
in Lima, Peru. The analysis of a time series of 30 years of climatological data (1968 – 1997) recorded 329 events, with the highest monthly frequency of fog between March and June, and the lowest frequency in November, which allows managers to optimize and perform, in short and medium terms, contingency plans that will enable restructuring and, consequently, a significant reduction of budget funds, as well as a greater respect to target audience or users of services offered by institutions.
Tardif and Rasmussen (2007) investigated fog events in New York City, United States of America, using a 20-year time series data. Surface hourly data were used to identify fog events in 17 locations under the inluence of various physiographic characteristics such as the type of land cover (urban, suburban, and rural) and contrasts between water and land.
The events in each site were ranked according to an algorithm based on the fog formation process. he results showed that the probability of fog occurrence is negatively inluenced by the presence of New York City urban heat islands, reinforced in places on direct inluence of sea air.
In Brazil, França (2008), using the numerical weather forecast model Eta in 4-km resolution, evaluated the fog forecasting methodology and horizontal visibility from the National Centers for Environmental Prediction analysis and Centro de Previsão de Tempo e Estudos Climáticos/Eta model predictions of 40 km. Two methods for estimating horizontal proile were evaluated: Kunkel (1984) and Gultepe et al. (2006) methods. Test cases were chosen for the evaluation depending on the season when fog occurs.
Integrated experiments on Afonso Pena airport, in Curitiba, Paraná State; Guarulhos International airport, in Guarulhos, São Paulo State; and Salgado Filho airport, in Porto Alegre, Rio Grande do Sul State, suggested that the 4-km Eta model may be used as a tool in predicting fog occurrences and horizontal visibility or even in regions with probability of fog within 36 to 48 h in advance.
Currently, artiicial neural networks (ANNs) have increasing applications as a tool for prediction of events owing to its competence to simulate the human brain’s ability to recognize, associate, and generalize patterns (Russel and Norvig, 2013).
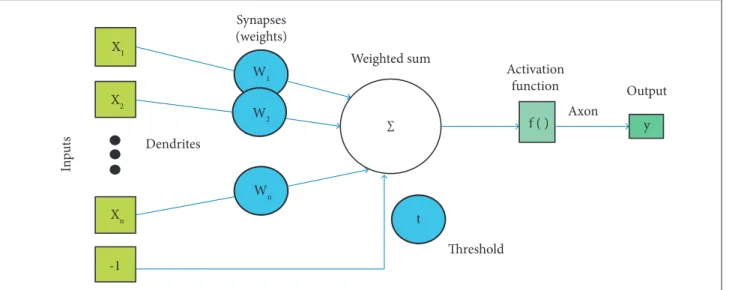
Figure 2. Model of an artiicial neuron.
Weighted sum
Dendrites X1
X2
Xn
W1
W2
Wn
t
f ( ) y
∑
-1
Inp
u
ts
Threshold
Output Axon
Activation function Synapses
(weights)
The ANNs have, as a main point, the interaction and manipulation of input data in order to find a satisfactory response within a reliability limit for an expected result. The ANNs are networks trained through entries obtained from external or internal scenarios in the system, and these entries are multiplied by randomly assigned weights. The process takes place throughout the network until an expected error within the proposed limit is reached; otherwise, the process continues to perform new calculations through an error correction of input data called backpropagation (Fig. 2) (Tafner et al., 1996).
After the required value is obtained, it is tested with known data; it is common to use 2/3 of data for training and 1/3 for network validation, with reliability verification, which may provide parameters for managers so they are able to make decisions about future information (Tafner et al., 1996). This allows executives and their teams to analyze future data and propose actions to minimize errors and increase the chances of success, as input data are based on historical data, which served as network training so that one can even perform simulations of future events (Rezende, 2005).
Time series are nothing more than a sequence of measurements for a given event, chronologically organized, which, apparently, does not follow any law or trend. However, in time series related to natural phenomena, one may note certain characteristics that are repeated after a certain period of time (seasonality) and others that maintain itself during the considered range (trends), even without obeying linear patterns.
According to Fabbian et al. (2007), the occurrence of fog in aerodromes may negatively impact the air transport operations, thus influencing significantly the overhead activities during this period, with respect to flight safety.
he authors also used ANNs to provide predictions about future events that could occur in Canberra International Airport (YSCB) and observed that, contrary to conventional statistical techniques, ANNs are better suited to solve problems that involve nonlinear complex interactions and thus have a great potential for the fog forecast, which characterizes the importance of developing models that can help those responsible for planning the flight instruction activities to be undertaken by learners in the learning phase and training. According to Chaudhuri et al. (2015), the reduced visibility during fog significantly influences the surface and air transport operations. The fog forecast at aerodromes is a complex and difficult task, despite constant improvements in numerical weather prediction models and, to improve the model, the authors used the neural networks of the type Multilayer Perceptron (MLP) and observed that the forecasting error decreases, thereby improving the learning model in predicting possible fog, which corroborates the use of RNAs for future prediction airfields.
σ = ω0 X0 + ω1 X1 + ω2 X2 + ω3 X3 + ... + ωi Xi
(1+ e-σ) 1 Y = 1
(1)
(2) In the AFA,the students of the airmen oicial board receive,
in addition to academic training, flight instruction in two aircrats, T-25 “Universal”, in the basic light education phase, and T-27 “Tucano”, a turboprop type, during the advanced phase to improve and prepare the future oicial airmen in their end mission. AFA has an airield called Campo Fontenelle (SBYS encoding) for the operation of its mission. his airield has two lane sectors, with an average of 160 landings and takeofs each day.
he process of training or light instruction, as it is called in AFA, depends on the weather conditions. hus, severe weather conditions, such as heavy rainfall and incidence of winds and fog formation, are limiting factors, since they may cause human and material risks to the institution.
MATERIAL AND METHODS
The AFA located in the town of Pirassununga, São Paulo State, within the coordinates 21°56’04’’ to 22°00’29’’ south latitude and 47°17’16’’ to 47°22’07’’ west longitude, is a higher education institution subordinated to the Departamento de Ensino da Aeronáutica, whose mission is to train air force officers.
AFA has a surface weather station on its premises that is responsible for monitoring the (local) weather condition. It is classiied as Centro Meteorológico Militar to provide speciic meteorological support to military aviation according to the Instituto de Controle do Espaço Aéreo (ICEA 105-2; Brasil, 2013).
he military light instructions take place, preferably, during the day, starting at 5 a.m. and ending at 11 p.m. By the fact that light activities are carried out in this period, weather data, including cloud cover, fog, and wind direction, are important variables for the strategic management of the missions (planning).
The data for training and testing of the ANNs were provided by the ICEA, located in São José dos Campos, São Paulo State. Regarding precipitation, there was a need for data collection directly through the forms available at ICEA, in São José dos Campos.
A total of 7,305 forms were assessed to obtain the cumu-lative sum (24 h) of rainfall, corresponding to what was veriied in the AFA airield. Fog data were similarly evaluated, as records contained only codes that had to be decoded using a table reference.
he fog records were obtained by visual estimates through meteorological observations made by the military, executed at fixed intervals (every hour) and complemented with intermediate observations. In case of signiicant changes to aviation, depending on the activity, the collection of other variables is considered, such as wind, visibility, visual range, cloud cover, air and dew point temperature, sea level pressure, and weather in the light track.
Data related to fog, encoded in the range 40 – 49, provided information on fog conditions. he data or codes, as provided in Table 4655 of MCA 105-10 (Brasil, 2011), provided information regarding the fog. he data were also provided by the ICEA and had to be decoded for interpretation.
MATLAB 8.0 was used to develop the system, where the data were processed and the network was built for training, validation, and testing of the proposed model.
he following control variables were chosen as inputs for network training: year, month, day, time, temperature, relative humidity, pressure, and wind speed. hese inputs are identiied as Xi, and the network output was stipulated as 0 or 1 for fog, where 0 means absence and 1 means presence of fog.
In the network training, the sigmoid function was used, with five neurons in the intermediary layer and one neu-ron in the output layer, indicating the presence or absence of fog at the AFA airfield. To correct the network error as a function of Xi input and Yi output, the backpropagation algorithm was used.
According to Russel and Norvig (2013), Eq. 1 represents the input characteristics that will be processed by the net-work for its training, where ω is the synaptic weights and Xi represents the network entries.
he sigmoid function is represented by Eq. 2:
ej= Oj (1 - Oj)(Y - Oj)
Oj = f(Xj) = 1+ e-Xj
1
Oj= Xj (3)
(4)
(5)
(6)
(8)
(9) (7) Xj= ΣwijOi + θj
i
ej= Oj (1 - Oj)Σwjkek k
θ (k)j = θ j(k-1) + ne(k)j w (k) = w (k-1) + ne(k) O(k)
j j ij
ij
If the results are not the same, it will be reprocessed by error backpropagation depending on Eqs. 3 to 9.
RESULTS AND DISCUSSION
Ater the training and the determination of the results, the proposed network achieved a reliability of 95.949% with 2/3 of the data. In other words, the network with input data Xi and output Yi achieved a satisfactory result by undergoing the network validation test. Using the remaining 1/3 of the data, the network achieved a reliability of 98.107%.
These results demonstrate that the network was capable of learning and the test results were satisfactory, which provides for the executive managers, in this case, the military responsible for the planning of flight activities, an effective tool, enabling them to develop a strategic plan for the following years, with significant and reliable projections on the basis of historical data of approximately 95% reliability. It significantly decreases future changes in plans related to operational cost and time as well as human resources.
Nevertheless, the information provided by the network has the greater purpose of improving planning and designing of campaign activities of cadet airmen, since they also conduct educational activities with other areas of expertise. So there is no loss to the learning process but an advantage to flight and other academic activities.
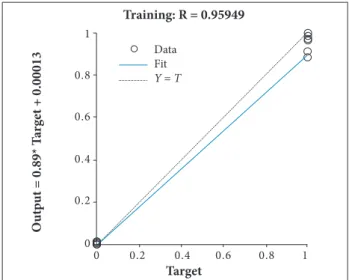
The result of training can be seen in Fig. 3. The dotted line represents the expected outcome Yi and the blue line, the results obtained by the network in training, indicating an equation in relation to the obtained results.
Figure 4 shows the network validation ater the training was conducted and inalized, with error matrices and synaptic where O and X represent the network entries.
Equation 4 represents the calculation of X:
where w denotes the synaptic weights and θ represents the bias.
Equation 5 represents the sigmoid function:
where e represents the natural logarithm.
Equation 6 corresponds to error correction of the last or output layer:
where Y denotes the network output.
Equation 7 corresponds to correction of the hidden or intermediate layers:
Figure 3. Training of multilayer perceptron network with error correction backpropagation algorithm.
Target Training: R = 0.95949
O
u
tp
u
t = 0.89* T
arge
t + 0.00013
0 0 0.2 0.4 0.6 0.8 1
0.2 0.4 0.6 0.8 1
Data Fit
Y = T
Equations 8 and 9, respectively, denote adjustments of synaptic weights and bias:
Figure 5. Relative and absolute frequencies of fog occurrence at the AFA airield in the 1989 – 2008 period.
Figure 4. Network validation with 1/3 of the remaining data for the 1989 – 2008 period.
Target Validation: R = 0.98107
O
u
tp
u
t = 1* T
arge
t + 0.0024
0 0 0.2 0.4 0.6 0.8 1
0.2 0.4 0.6 0.8 1
Data Fit
Y = T
Month
F
re
q
u
enc
y (%)
Jan 0 5
10 50 58
23
96
40 44
24 10 21 168 176
111 15
20 25
Feb Mar Apr May Jun Jul Aug Sep Out Nov Dec
weights adjusted and ready to infer possible future projections. his will help managers (senior military) to develop a more structured and proper planning. Adjustments could be possible if based on recent data, i.e. from the last two or three years.
he data obtained by the network were compared with the statistical data of the same period for comparison and analysis of network performance. he tests performed with the network show values very close to the statistical ones, with the great advantage of agility and speed of the network, since it had already been trained and prepared for this analysis.
The statistical data can be seen in Fig. 5, which are similar to the values obtained by the proposed network. The figure shows the relative and absolute frequencies with respect to fog occurrence at the AFA airfield in the period 1989 – 2008. From a total of 821 cases of fog occurrence in the whole period, 67% occurred from April to July, with a predominance in May and June. he lower frequencies were observed from October to January, with a total occurrence of 9.5%; and in February, March, August, and September, the occurrence was around 23.4%.
CONCLUSION
The results showed that the use of multilayer perceptron-type ANNs with error correction using the backpropagation algorithm was efficient and fast, providing data to executive managers for better planning, with a reduced error margin, considering that the system was fed with data of 20 years. This favored the network learning process with a 95% percentage of success, which is considered suitable for the use of ANNs.
hus, the system proposed for the planning and assistance to military oicers tends to enhance planning, allowing a more eicient decision-making process, which will greatly beneit the Academia da Força Aérea, in regard to reduction of operational work, reduction of costs in terms of time dedicated to the personnel and possible light adjustments as well as academic activities related to cadet airmen.
he model was based on past meteorological data. If the data continues in the same pattern, the degree of reliability will remain the same. If there are sharp changes in the input variables, the network provides a new level of reliability, since the previous state has changed.
REFERENCES
Brasil, 2011, Comando da Aeronáutica. Departamento de Controle do Espaço Aéreo, “Classiicação dos Órgãos Operacionais de Meteorologia Aeronáutica – ICA 105-2”, Comando da Aeronáutica, Rio de Janeiro, Brazil.
Brasil, 2013, Comando da Aeronáutica. Departamento de Controle do Espaço Aéreo, “Manual de Estações Meteorológicas de Superfície – MCA 105-2”, Comando da Aeronáutica, Rio de Janeiro, Brazil.
Fabbian, D., de Dear, R. and Lellyett, S., 2007, “Application of Artiicial Neural Network Forecasts to Predict Fog at Canberra International Airport”, Weather and Forecasting, Vol. 22, No. 2, pp. 372-381. doi: 10.1175/WAF980.1
França, V.D.J., 2008, “Avaliação da Metodologia de Previsão de Nevoeiro e Visibilidade Horizontal do Modelo Eta”, Master Thesis, Instituto Nacional de Pesquisas Espaciais, São José dos Campos, Brazil.
Gultepe, I., Milbrandt, J. and Belair, S., 2006, “Visibility Parameterization from Microphysical Observations for Warm Fog Conditions and its Application to the Canadian MC2 Model”, Proceedings of the Conference on Aviation, Range and Aerospace Meteorology, Atlanta, USA.
Gultepe, I., Tardif, R., Michaelides, S.C., Cermak, J., Bott, A., Bendix, J., Müller, M.D., Pagowski, M., Hansen, B., Ellrod, G., Jacobs, W., Toth, G. and Cober, S.G., 2007, “Fog Research: a Review of Past Achievements and Future Perspectives”, Pure and Applied Geophysics, Vol. 164, pp. 1121-1159. doi: 10.1007/s00024-007-0211-x
Kunkel, B., 1984, “Parameterization of Droplet Terminal Velocity and Extinction Coeficient in Fog Models”, Journal of Applied Meteorology, Vol. 23, No. 1, pp. 34-41. doi: 10.1175/1520-0450(1984)023<0034:PODTVA>2.0.CO;2
Rezende, D.A., 2005, “Sistemas de Informações Organizacionais: Guia Prático para Projetos em Cursos de Administração, Contabilidade e Informática”, Atlas, São Paulo, Brazil.
Roach, W.T., 1995, “Back to Basics: Fog: Part 2 – The Formation and Dissipation of Land Fog”, Weather, Vol. 50, No. 1, pp. 7-11. doi: 10.1002/j.1477-8696.1995.tb06053.x
Russel, S. and Norvig, P., 2013, “Inteligência Artiicial”, Third Edition, Campus, Rio de Janeiro, Brazil. .
Tafner, M.A., Xerez, M. and Rodrigues Filho, W., 1996, “Redes Neurais: Introdução e Princípios de Neurocomputação”, FURB, Blumenau, Brazil.
Tardif, R. and Rasmussen, R.M., 2007, “Event-Based Climatology and Typology of Fog in the New York City Region”, Journal of Applied Meteorology and Climatology, Vol. 46, No. 8, p. 1141-1168. doi: 10.1175/JAM2516.1
Tarmeňo, E.C. and Altamirano, R.A., 2004, “Estudio Climático de