ABSTRACT: The development of polyaniline and graphene oxide composites aims to join the unique properties of each material for aerospace applications. The present paper demonstrates an easy and quick method, compared to the ones found in the literature, to obtain a composite made with polyaniline doped with dodecylbenzenesulfonic acid, a combination commonly called polyaniline, and graphene oxide. Nowadays, the most common studied methods are electrochemistry and in situ chemical polymerization. Differently from these methods, the ilms were obtained by a physical mixture of equimolar suspension of graphene oxide (4 mg/mL) with 3 concentrations of polyaniline powder: 25; 50 and 75%, being compared to pure graphene oxide and polyaniline. The morphology and structure behavior of all the ilms were studied, besides the bonding nature between both materials. The ilms were analyzed by scanning electron microscopy, X-ray diffraction, Fourier transform infrared spectroscopy, and differential scanning calorimetry. The apparent interaction between graphene oxide corrugated sheets and polyaniline grains was veriied by scanning electron microscopy images. It can be noticed, as the concentration of polyaniline increases, that more polymer was entrapped. To prove the formation of polyaniline/graphene oxide composite, X-ray diffraction and Fourier transform infrared spectroscopy techniques demonstrated the changes on graphene oxide crystallographic plans and on the chemical bonding between polyaniline and graphene oxide, suggesting an interaction between polyaniline and graphene oxide, especially in the composite with 50% polyaniline/50% graphene oxide. Differential scanning calorimetry was used to highlight this effect through the increase in thermal stability. The method of physical mixture was eficient to obtain the polyaniline/ graphene oxide composites.
KEYWORDS: Graphene oxide, Polyaniline, Structure, Morphology, FT-IR, DSC.
Formation of Composite Polyaniline and
Graphene Oxide by Physical Mixture Method
Ludmila Resende Vargas1, Anne Karoline Poli1, Rita de Cássia Lazzarini Dutra1, Camila Brito deSouza2,3, Maurício Ribeiro Baldan1,4, Emerson Sarmento Gonçalves1,2
INTRODUCTION
The search for innovative technologies in the area of electronics and electromagnetic absorbing materials has grown in the last few years (Singh et al. 2011; Mi et al. 2008; Kim et al. 2010). Materials that combine good electric properties, thermal stability (Feng et al. 2011), and low cost of production are used as initial requirements for the development of new materials. he development of polyaniline (PAni) and graphene oxide (GO) composites aims to join the unique properties of each material and to obtain a composite with better performance than the original materials. hese composites can be easily applied in aerospace industry devices, such as sensors, radar absorbing systems (RAS), and energy storage elements. Both materials present special properties that can be changed according to their manufacturing parameters.
As described by Wang et al. (2009), graphene (GE) and materials based on it (GO and reduced GO — rGO) have attracted even more attention thanks to their applications as energy storage devices (Wei et al. 2015; Yang et al. 2013). GO can be considered the most common graphene-based material produced in large scale and at a lower cost.
Diferently from GE, GO presents oxygenated, hydrophilic functional groups and can be easily dispersed in aqueous solution (Dreyer et al. 2010), facilitating the interaction between GO and PAni. Gupta et al. (2013) describe the GO as a material that presents a planar structure of oxidized carbon with sp2 hybridization, rich in oxygen groups, such as hydroxyl, carboxyl,
1.Departamento de Ciência e Tecnologia Aeroespacial – Instituto Tecnológico de Aeronáutica – Programa de Pós-Graduação em Ciência e Tecnologia Espaciais – São José dos Campos/SP – Brazil. 2.Departamento de Ciência e Tecnologia Aeroespacial – Instituto de Aeronáutica e Espaço – Divisão de Materiais – São José dos Campos/SP – Brazil. 3.Universidade Federal de São Paulo – Instituto de Ciência e Tecnologia – Campus Parque Tecnológico – São José dos Campos/SP – Brazil. 4.Instituto Nacional de Pesquisas Espaciais – Laboratório Associado de Sensores – São José dos Campos/SP – Brazil.
Author for correspondence: Emerson Sarmento Gonçalves | Departamento de Ciência e Tecnologia Aeroespacial –Instituto de Aeronáutica e Espaço – Divisão de Materiais | Praça Marechal Eduardo Gomes, 50 – Vila das Acácias | CEP: 12.228-904 – São José dos Campos/SP – Brazil | Email: [email protected]
and epoxides. Dreyer et al. (2010) consider that the presence of these groups can be used as a good site for surface modiication.
Regarding PAni and its special chemical property of doping and dedoping (ranging from acidic to basic medium), Feng et al. (2011) and Rakic et al. (2011) showed its suitable environmental stability and application versatility. his polymer can be produced in several oxidation states (leucoemeraldine, emeraldine, pernigraniline), each one characterized by a different structure, with several electrical properties and the ability to be produced by chemical or electrochemical synthesis (Tamburria et al. 2011; Maia et al. 2000; Sapurina and Stejskal 2010; Ćirić-Marjanović 2013). he formation of conductive structures in the polymer is shown in Fig. 1.
Recently, the PAni/GO composition was successfully synthesized by electrochemical and chemical methods applied to obtain supercapacitor materials (Wang et al. 2009). In this paper, a composite was obtained through a physical mixture of PAni and GO in suspension. he aim is to achieve, through this simple method, the formation of a PAni/GO composite and to study the potential interaction between PAni polar groups and the graphenic structure. he morphological, structural, chemical, and thermal aspects were analyzed. Furthermore, low-cost factors to develop a high-quality composite using innovative methods and processes were considered in the present study.
METHODOLOGY
POLYANILINE SYNTHESIS
he PAni synthesis was carried out through aniline monomer oxidation (1.0 mol/L aqueous solution) with ammonium persulfate (1.9 mol/L), in 1.0 mol/L solution of hydrochloric acid and sodium chloride. he solution was kept in a reactor at −5 °C under constant stirring, immersed in a bath of 1.0 L capacity with ethylene glycol in a temperature around −40 °C, while the ammonium persulfate solution was added during 50 min.
A dark green precipitate in the solution was observed, indicating the formation of PAni doped with HCl. After the complete addition of oxidizer, the system was let under mechanical stirring for 2 h. he polymer was removed from the reactor and washed several times with an 50% v/v ethanol/ distilled water solution and a basic solution of NH4OH (1.0 mol/L).
Ater dedoping, the material was washed with a 50% v/v ethanol/distilled water solution several times and iltered to obtain a particulate powder (base form of pure PAni).
It was added a quantity of 5 g of PAni in an aqueous solution containing 9 g of dodecylbenzenesulfonic acid (DBSA); this solution was left under constant stirring for 24 h at room temperature. he doped PAni-DBSA was washed with distilled water and ethyl alcohol, iltered, and the green powder was dried under vacuum at 60 °C until constant weight. he doping with functionalized DBSA was carried out by a solution method in the molar ratio 1:8 of PAni/DBSA. he PAni doped with this acid is referred to as “PAni” throughout this paper.
POLYANILINE/GRAPHENE OXIDE COMPOSITE
he cited method aims to verify the impact of solvent action in the composite formation. Furthermore, it is not previously
Figure 1. Linear structure of PAni and its several oxidation states. (a) Leucoemeraldine; (b) Pernigraniline; (c) Emeraldine; (d) Protoned emeraldine (Padilha 2011).
N H
H H
H n
n
n n H
H
H H
H H
N
N
N N
N N
N N
N N
N N
N N N
+ +
When the emeraldine base is doped in an acid environment, a polaron or bipolaron can be formed through successive formations of positive species. Bipolaron structures are thermodynamically more stable and conductive (Bockris and Reddy 2004). As mentioned by Bhadra et al. (2009), these polarons are responsible for electrical conduction through a jumps mechanism in the crystalline polymer region. he adjacent nitrogen electron (neutral) moves to a vacant spot and neutralizes it. Consequently, this spot moves, creating new spaces in the nitrogen structure and in the polarons structures, resulting in electron transportation and, thus, electrical conductivity along the chain (Bockris et al. 2004).
(a)
(c) (b)
described in the literature, and the interaction efects need to be conirmed.
Composites were prepared with doped PAni (2 h; 200 mesh/ 325 mesh) and GO from SIGMA-ALDRICH (4 mg/mL in water dispersion). Initially, the desired amount of PAni powder was transferred into a 10 mL-beaker and the mixture with GO; 5 mL of this mixture were transferred to a Petri dish and dried in a vacuum oven at 40 °C, resulting in a dried ilm. he ilms were obtained ater 5 h of drying using 3 diferent PAni concentrations (25; 50 and 75%) that were compared with the original materials — GO and PAni.
CHARACTERIZATION METHODS
The morphological characterization of the films was performed using Zeiss® Leo 440 scanning electron microscopy (SEM), and the crystallographic structures of the ilms were analyzed using Panalytical® X-ray difractometer (XRD), a rotating anode X-ray generator working at 5° ≤ 2θ ≤ 90°, with Cu monochromatic radiation (0.154 nm). Functional groups were determined by Fourier transform infrared (FT-IR) spectroscopy using PerkinElmer® Spectrum One spectrometer. he samples were prepared as KBr pressed pellet samples, and the FT-IR spectra were obtained by transmission mode from 4000 to 400 cm−1. Diferential scanning calorimetry (DSC) data were obtained with PerkinElmer® Pyris 1, at a heating rate of 5 °C/min in nitrogen atmosphere.
RESULTS AND DISCUSSION
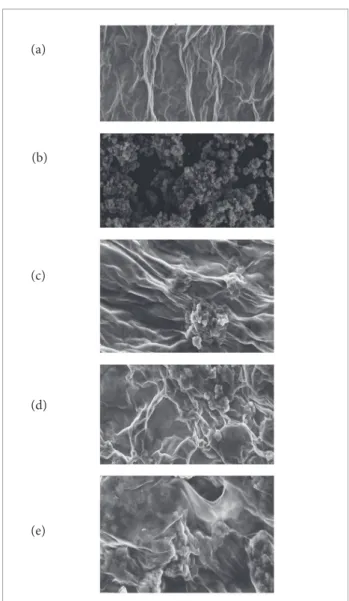
SCANNING ELECTRON MICROSCOPY
he material morphology was studied by SEM. Figure 2 shows the original materials and the ilms that were obtained with the diferent ratios of PAni. he corrugated structures refer to the GO (Fig. 2a), and the granular ones, to the PAni (Fig. 2b). he corrugated structures are microscopically-oriented and grouped with a certain degree of parallelism, which was broken as the polymer was added. For all the diferent ratios of GO/PAni, the PAni was homogeneously surrounded by GO ibers. his morphology remains similar, in greater or lesser intensity, for all GO/PAni ratios.
This encapsulation effect appears more evident in the proportions of 50 and 75% of PAni, as shown in Figs. 2d and 2e. he interaction between PAni and corrugated sheets of GO can be easily noticed, as well as corrugated structures are localized between PAni particles, which can be partially encapsulated
Figure 2. SEM of PAni, GO and their mixture (scale 10 μm). (a) GO (1,800X); (b) PAni (1,000X); (c) PAni 25%/GO 75% (2,700X); (d) PAni 50%/GO 50% (2,700X); (e) PAni 75%/GO 25% (3,000X).
Figure 3. SEM of PAni 50%/GO 50% composite.
as demonstrated in Fig. 3. In all cases, the GO acts as a placental structure, very thin and transparent, and involves most of the PAni particles. his fact may be explained by the presence of
(a)
(c) (b)
(d)
a solvent action (deionized water) to connect and encapsulate the PAni particles.
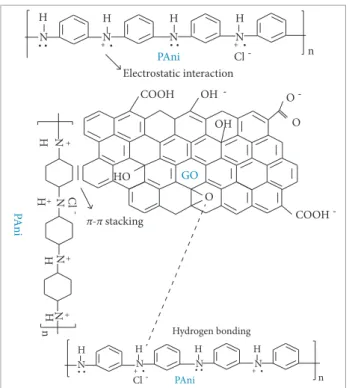
There is evidence of interactions between PAni and GO structures, so the nature of their bonds is not conclusive. Wang et al. (2010) made a relevant contribution and raised possible chemical bonds and electrostatics interactions between PAni and GO. They suggested a chemical synthesis of PAni/GO composites and its interactions using XRD and FT-IR techniques. With a diferent synthesis method compared with that of Wang et al. (2010), the present paper intends to analyze the existence of chemical bonds between PAni and GO, proving the composite formation.
As shown in Fig. 4, some interactions are noticed. By combining the results of UV-vis absorption, Raman spectra, and XPS analysis, Wang et al. (2010) proposed that the interaction of GO/PAni can be divided into 3 major interactions: (a) π-π stacking; (b) electrostatic interactions; and (c) hydrogen bonding. In order to get the best of both materials, it is important to understand the interaction between GO and PAni to exploit the potential for supercapacitor applications. he interaction between polar groups (polymer charge carriers) and oxygenated groups of GO results in the possible formation of ionic or coordinated complexes. In addition, hydrogen bonds may be formed between the non-protonated amine groups with hydroxyl hydrogen atoms. his
can also occur between epoxide groups and hydrogen atoms attached to electrically-charged nitrogen (Wang et al. 2010).
X-RAY DIFFRACTION
he structure of the composites was investigated by powder XRD measurements. he XRD spectra were measured in a range of 2θ from 5° to 70°, showing an intense and sharp peak at 2θ = 8.7° (GO) corresponding to the interplanar space of GO sheets. he relection peak can be assigned to (001). According to Blanton and Majumdar (2013), the 2θ peak of GO can shit from 7° to 12°, depending on the amount of residual water that can be intercalated between the basal planes. Zhang et al. (2010) reported that the reflection peak might depend on 2 major contributions: the method of preparation and the number of layers of water below the GO surface ilm. Michell et al. (2015) observed that the characteristic peak of the graphite used to synthesize the graphite oxide shits from 2θ = 26.4° to 2θ = 10.61°. his shit was attributed to oxygenated groups and water molecules inserted in the interlayer of graphite. It is important to remember that GO has a 2-D form of graphite and presents oxygen function groups in its basal planes and edges providing compatibility with polymer matrices. he GO surface acts as a nucleation site for the PAni due to oxygen functional groups on GO surface. he tuning of the amount of PAni in GO introduced some interesting aspects in XRD and in the morphology (Fig. 2). Ater the formation of GO/PAni, it is observed that the GO peak height intensity shows a very strong decrease. Furthermore, the peak broadening is very apparent for all the 3 compositions of GO/PAni (inset of Fig. 5). Another interesting aspect is that the peaks shit to
Figure 4. Possible interaction between PAni and GO
structures, adapted from Wang et al. (2010).
PAni Cl ˉ
N N N N
H H H H
n
Electrostatic interaction
• • +• • • +•
COOH
GO
PAni
PA
n
i
COOH ˉ
Cl ˉ
C
l ˉ
O ˉ
O
O
N N
n H
H H
H
N N
OH
N
N
N
N
H
H
n
H
H +
+
+
+
OH
Hydrogen bonding π-π stacking
HO
• •
• • +• +•
Figure 5. XRD of PAni/GO composites.
0 3,000
10 20 30 40 50 60 70 80 90
2θ
2θ 6,000
9,000 12,000 15,000
Ú
s
In
te
ns
it
y [a.u]
s rGO
¸ GO
PAni 75%/GO 25% PAni 50%/GO 50% PAni 25%/GO 75% Ú PAni
¸
s
Ú
0 1,000 2,000 3,000 4,000
6 8 10 12 14
5,000
In
te
ns
it
a higher 2θ. Singh et al. 2011 observed the decrease in GO height peak. According to them, the GO peak decreases its height intensity when residual water is removed from the GO surface, which suggests a possible interaction between PAni and GO that may be influenced by water content or oxygen function groups on the GO surface. he pure PAni exhibits 2 important relection peaks, 2θ = 2θ° and 2θ = 25°, that can be associated to some crystalline order in the bulk PAni. he PAni relection peaks decrease drastically during the formation process of GO/PAni, which was revealed by the shallow relection in just one peak around 2θ = 21°. his change is associated with PAni/GO interaction and crystallographic sheets changes. he combination of the substantial shit of the PAni, in the formation process of PAni/GO, and the decrease in GO peak height intensity justify the formation of a hybrid composite. By analyzing the XRD of the 3 compositions (PAni 25%/GO 75%, PAni 50%/GO 50% and PAni 75%/GO 25%), a new, broad, and minor peak appears indicating the intercalation of PAni between GO sheets.
he broadening of the peaks is evident for all the PAni/ GO compositions studied in this paper. Due to the interaction between PAni and GO, the material structure may change and afect their thermal and mechanical stability. In order to conirm the nature of these interactions, the FT-IR and DSC techniques are discussed next.
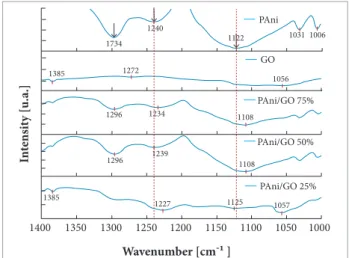
FOURIER TRANSFORM INFRARED SPECTROSCOPY
FT-IR spectroscopy was used to elucidate the nature of the interaction between PAni and GO. Figure 6 shows the spectra of PAni, GO, and of their mixtures. It is possible to observe the greatest similarity between the spectra of PAni 25%/GO 75% and the spectra of GO. he samples containing PAni 50%/GO 50% and PAni 75%/GO 25% demonstrated similarity with the PAni, especially PAni 50%/GO 50%, suggesting that the interaction efect achieved an optimized level.
All contributions were grouped in 10 diferent items as shown in Table 1. he main spectra changes in the medium infrared region (MIR) are included in Table 1 as well. In order to analyze and compare all the spectra, they were divided into diferent intervals in this region. It is very important to notice that, in MIR region, from 4000 down to 1800 cm−1, the spectra showed a broad and intense band related to stretching O-H and N-H in hydroxyl and amine groups, respectively. In addition, the presence of moisture in KBr pads, used to perform the
experiment by transmittance or humidity from GO, could contribute to this. he band may be associated to hydrogen bond between NH from PAni and possible oxygenated group from GO. he behavior of the OH group can suggest electrostatic interaction (Smith 1979), and the relevant FT-IR bands in the MIR region are shown in Table 1 (item 1).
In the range from 1,800 to 1,600 cm−1, it is possible to analyze the GO spectrum and its consequences in the presence of diferent PAni/GO compositions (Table 1, items 2 and 3). Probably, π-π stacking is a predominant efect, which moves electrons preferably from GO to PAni structure. he main bands at 1720 and 1630 cm−1 in the spectrum of GO are related to C=O stretching in COOH group and C=C in aromatic rings, respectively. However, 1630 cm−1 band may be associated to vibrations of the residual water mainly coming from KBr pads. his efect certainly masks the analysis of this band. It is possible to notice the constant presence of these bands for all PAni/GO compositions. Furthermore, a noticeable blueshit at 1720 and 1630 cm−1 regarding PAni 50%/GO 50% was observed (Fig. 7), which may be related with 2 phenomena: electrostatic attraction of carboxylic oxygen and π-π stacking from C=C supplied from graphene sheets to benzenoid structure of PAni, once the
Figure 6. Transmission MIR spectra of PAni/GO, prepared as KBr pellets.
58.5
4000 3500 3000 2500 2000 1500 1000 500 65.0
71.5 20.7 27.6 34.5 19.2 24.0 28.8 35.1 39.0 42.9 46.8 4.5 9.0 13.5 18.0
Wavenumber [cm-1 ]
GO
PAni 25% /GO 75%
T
ra
ns
mi
tta
nc
e [%] PAni 50%/GO 50%
Item GO (cm−1)
PAni
(cm−1)
25% PAni (DBSA)/
75% GO (cm−1)
50% PAni
(DBSA)/ 50% GO
(cm−1)
75% PAni
(DBSA)/ 25% GO
(cm−1)
Wavenumber
shift
Changing on form
and intensity
Attribution
and probable effects (Wang et al. 2009; Smith 1979)
1 3413 3442 3422 3431 3431
In relation to GO, it increased with
the increasing in PANI ratio; in relation to PAni spectrum,
a decrease was observed
Widening observed for PAni 50%/ GO 50% and band higher than others for PAni 75%/GO
25%
- ν OH (GO) and ν NH (PAni/ DBSA), referring to hydrogen bond between NH from PAni and possible
oxygenated group from GO, except hydroxyl (possibly carboxyl or epoxyde). he behavior of OH group can suggest electrostatic interaction.
Furthermore, there is a possible overlap with humidity fromKBr pad
(Smith 1979)
2 1720 ---- 1727 1734 1717
Highest value for PAni 50%/
GO 50%
he lowest intensity for PAni
50%/GO 50%
νC=O in COOH from GO, which may pass to C=O similar to ester (Smith 1979). Suggested changing on mode of electrostatic interaction.
Possible action of DBSA (PAni dopant)
3 1630 --- 1616 1641 1632
he lowest value for PAni 25%/ GO75% and the highest for PAni 50%/GO 50%
Intensity decreases, especially for PAni
50%/GO 50%
π–π stacking, possibly masked to PAni 50%/GO 50% by KBr humidity
4 ---- 1559 Shoulder at 1559 1564 Shoulder at 1556 No variation
he highest value for PAni 50%/GO
50%
Quinoid structure (N=Q=N) in aniline oligomers (Wang et al. 2009;
Tang 1988)
5 ---- 1481 Shoulder at 1465 1457 1457 Decrease
It is visible for PAni 50%/GO 50% and PAni 75%/GO 25%
π (C=C) in benzenoid ring (N-B-N) (Tang 1988; Dmitrieva and Dunsch 2011). Wang et al. (2009)suggest π–π
stacking
6 1385 --- 1385 1384 1385 No variation
Apparently, intensity decreased
until maximize PAni ratio
δ OH acid and δ OH phenol (GO) (Smith 1979)
7 --- 1297 Shoulder at 1297 1296 1296 No changes
The highest value for PAni 50%/
GO 50%
υ C-N in QBcisQ, QBB, BBQ (Wang
et al. 2009) and υ C-N secondary
aromatic amine (Smith 1979)
8 ---- 1240 1232 1239 1234
The lowest value for PAni
25%/GO 75%
Apparently, the
highest value for PAni 50%/GO 50%
n C-N in BBB (Wang et al. 2009).
Probably performing on π-π stacking
9 --- 1122 1125 1108 1108 Decrease
The highest
intensity for
PAni 50%/GO 50%
1,170 – 1,140 cm−1 refers to
vibrational mode Q=NH+-B or
B-N+H-B (related to electrical
conductivity). At 1,115 cm−1,
substituting 1,2,4 of ring (Zeng and Ko 1998; Tang 1988; Dmitrieva and Dunsch 2011). It can be related to
π -π stacking and hydrogen bonds
with oxygen groups from GO
10 --- 800 Shoulder at 800 798 797 No variation
he highest value for PAni 50%/GO
50%
blueshit of this band may be related to decreased availability of electrons π in graphenic rings.
Concerning the second region (Fig. 8), in the range from 1,600 to 1350 cm−1, the bands at 1481 and 1559 cm−1 are assigned to C=C in benzenoid and quinoid structures, respectively. he 1481 cm−1 mode in the PAni spectrum was redshited from its position for all PAni/GO combinations. he blueshit for the mode 1559 cm−1 in combination with a decrease in the benzoid structure may be associated to the greater electron availability from GO in the π-π stacking. Besides, the electron availability contributes to the reduction of quinoid structures. his behavior was described in Table 1 (items 4 and 5).
The band at 1296 cm−1 (Fig. 9), observed in the PAni spectrum, was attributed to C-N stretching of secondary amine in QBcisQ, QBB, and BBQ units (Table 1, item 7). It can
Figure 9. FT-IR partial spectra: third signiicant region of MIR for PAni/GO composites.
PAni
1734 1240
1122
1385 1272
1056 1031 1006
1108 1234
1296
1108
1385
1227 1125 1057
GO
PAni/GO 25% PAni/GO 50% PAni/GO 75%
1239 1296
1400 1350 1300 1250 1200 1150 1100 1050 1000
In
te
ns
it
y [u
.a.]
Wavenumber [cm-1 ]
1600 1550 1500 1450 1400
PAni
GO
PAni 75%/ GO25%
PAni 50%/GO 50%
PAni 25%/GO 75%
1659 1481
1457
1564
1457 1405
In
te
ns
it
y [u
.a.]
Wavenumber [cm-1 ]
1800 1750 1700 1650 1600 1550 1500
PAni
1720
1716
1734
1727
1641
1616 1632 1630
1559
GO
PAni 75%/GO 25%
PAni 50%/GO 50%
PAni 25%/GO 75%
In
te
ns
it
y [u
.a.]
Wavenumber [cm-1 ]
Figure 8. FT-IR partial spectra: second signiicant region of MIR for PAni/GO composites.
Figure 7. FT-IR partial spectra: irst signiicant region of MIR for PAni/GO composites.
be observed that this band is more evident for the PAni 50%/ GO 50%. his efect is related to the alternation of benzenoid and quinoid structures. he next band, at 1240 cm−1 (Fig. 9), is related to C-N stretching in BBB units (and it is a result of the reduction from quinoid to benzenoid structures, as discussed next, coherent with the proportion between the bands 1,564 and 1457 cm−1) and is decreased for this composition.
The band at 1122 cm−1 (Fig. 9) may be associated to p electron cloud in PAni chain (Table 1, item 9). No relative increase was observed for the charged polymer unit Q=NH+-B or B-N+H-B. his structure may be suited to evaluate the degree of doping. As can be observed, this efect is more pronounced in PAni 50%/GO 50%, indicating that this composition favors a conductivity greater than the others.
According to Table 1, all efects noticed in the literature are present, but with predominance of π-π stacking. Concerning GO bands, shits are observed for higher values of wavenumber, while, for PAni, values decrease in contrast to those outlined by Wang et al. (2009). However, the techniques and orders of magnitude of ratios are radically diferent. he efects observed in the interaction are more highlighted for the composite PAni 50%/GO 50%.
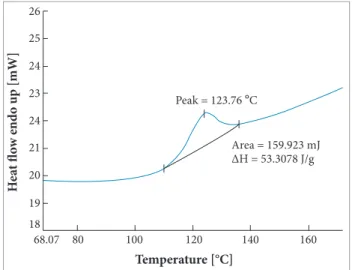
DIFFERENTIAL SCANNING CALORIMETRY
PAni may suffer a change in conformation or reticulation reaction above 100 °C. An increase from 107 °C (Fig. 10) up to around 180 °C (Fig. 11) was observed for this peak temperature when PAni was combined with GO.
hese data indicate the formation of PAni cross-links. However, in the presence of GO, there is an engagement of PAni p electrons in a stacking with GO aromatic structures, decreasing their availability to obtain s bonds of cross-linking. Due to this fact, the cross-linking reaction is thermodynamically disfavored at temperatures below 170 °C, probably because these interactions. his efect is more evident in PAni 50%/GO 50%, which showed a cross-linking temperature higher than that of PAni alone. In all compositions of PAni/GO, a very strong increasing in the process enthalpy was noticed. he jumping from −94.3 J/g (Fig. 10) up to values between 2 and 7 times more than that, inversely proportional to the concentration of PAni (Fig. 11), highlights the efect of entrapment of PAni by GO and its diiculty to form cross-linkings, when trapped by GO. This effect indicates that the stability of PAni/ GO is possibly valid to space application because of normative limitation. For example, the European Aerospace
Norms EN 4644-011:2015-8, EN 4644-013:2015-08, and EN 4644-131:2015-8 determine that aerospace materials must resist temperatures below 175 °C. For aeronautic applications, MIL-STD-810 determines that the materials must be stable until 85 °C. So, for aerospace application, PAni/GO seems to be more suitable than PAni.
he GO does not have an exothermic peak, as illustrated in Fig. 12, but an endothermic one can be noted, which merely indicates loss of water and, therefore, does not interfere in the composite thermal stability.
he evidence of electronic interactions of π-π stacking on composites was strongly conirmed by DSC, and the method of physical mixture has proven relatively easy and successful to obtain PAni/GO composites.
Figure 11. DSC of PAni/GO composites in different ratios.
Peak = 188.07 °C
Peak = 186.61 °C
H
ea
t fl
o
w e
nd
o u
p [mW
]
26 24
20 18 16 14 12 10 8 6 5 22
80 100 120 140 160 180 200 220 240 260 280 300
Temperature [°C] Peak = 175.77 °C
Area = –459.032 mJ ΔH = –208.6508 J/g
Area = –1242.564 mJ ΔH = –564.8019 J/g
Area = –1435.623 mJ ΔH = –652.5561 J/g PAni/GO (25% PAni)
PAni/GO (50% PAni) PAni/GO (75% PAni)
Temperature [°C]
H
ea
t fl
o
w e
nd
o u
p [mW
]
26
25
24
23
24
21
20
19
18
80 100 120 140 160
68.07
Peak = 123.76 °C
Area = 159.923 mJ
ΔH = 53.3078 J/g
Peak = 107.5 °C
H
ea
t fl
o
w e
nd
o u
p [mW
] 23
21
20
18 19
17 22
80 100 120 140 160 180 200 220 240 33.74 60
Temperature [°C] Area = – 367.722 mJ ΔH = – 94.2877 J/g
Figure 10. DSC thermogram of doped PAni.
Figure 12. DSC of GO.
CONCLUSION
hrough the experiments conducted with the used composite formulation, it is noticed that there is an increase in the attraction intensity of the corrugated GO and PAni particles through solvent action. However, this behavior is not linear.
observed (electrostatic interactions and, in lower incidence, hydrogen bonds). The thermal effect of this interaction is the formation of a more stable conformed PAni, disfavoring cross-linking reactions and improving the composite thermal stability, which, around 175 °C, is desirable for aerospace applications.
ACKNOWLEDGEMENTS
he authors would like to thank Andreza de Moura Cardoso, Maria Aparecida Miranda de Souza, Rogério Duque Gonçalves, Aline Fontana Batista, and João Marcos Kruczinski, from the Departamento de Materiais of the Instituto de Aeronáutica e Espaço, for their assistance and support in this project.
Special thanks also go to Milton Faria Diniz, from the Divisão de Química of the Instituto de Aeronáutica e Espaço, and to Coordenação de Aperfeiçoamento de Pessoal de Nível Superior/ Instituto Tecnológico de Aeronáutica, for the research grant PVS process that made this research possible.
AUTHOR’S CONTRIBUTION
Vargas LR, Dutra RCL, Baldan MR, and Gonçalves ES conceived the idea and co-wrote the main text; Vargas LR, Poli AK, and Souza CB performed the experiments; Vargas LR, Baldan MR, Souza CB, and Gonçalves ES prepared the igures. All authors discussed the results and commented on the manuscript.
REFERENCES
Bhadra S, Khastgir D, Singha NK, Lee JH (2009) Progress in preparation, processing and applications of polyaniline. Prog Polymer Sci 34(8):783-810. doi: 10.1016/j.progpolymsci.2009.04.003
Blanton TN, Majumdar D (2013) Characterization of X-ray irradiated graphene oxide coatings using X-ray diffraction, X-ray photoelectron spectroscopy, and atomic force spectroscopy. Powder Diffr 28(2):68-71. doi: 10.1017/S0885715613000109
Bockris JO, Reddy AKN (2004) Modern electrochemistry. 2nd edition. New York: Kluwer Academic Publishers.
Cheng CH (2002) Thermal studies of polyaniline doped with dodecyl benzene sulfonic acid directly prepared via aqueous dispersions. J Polymer Res 9(3):195-200. doi: 10.1023/A:1021395726060
Ćirić-Marjanović G (2013) Recent advances in polyaniline research: polymerization mechanisms, structural aspects, properties and applications. Synthetic Met 177:1-47. doi: 10.1016/ j.synthmet.2013.06.004
Dmitrieva E, Dunsch L (2011) How linear is “linear” polyaniline? J Phys Chem B 115(20):6401-6411. doi: 10.1021/jp200599f
Dreyer DR, Park S, Bielawski CW, Ruoff RS (2010) The chemistry of graphene oxide. Chem Soc Rev 39:228-240. doi: 10.1039/B917103G
Feng XM, Li RM, Ma YW, Chen RF, Shi NE, Fan QL, Huang W (2011) One-step electrochemical synthesis of graphene/ polyaniline composite ilm and its applications. Adv Funct Mater 21(15):2989-2996. doi: 10.1002/adfm.201100038
Gupta RK, Alahmed ZA, Yakuphanoglu F (2013) Graphene oxide based low cost battery. Mater Lett 112:75-77. doi: 10.1016/ j.matlet.2013.09.011
Kim H, Abdala AA, Macosko CW (2010) Graphene/polymer nanocomposites. Macromolecules 43(16):6515-6530. doi: 10.1021/ma100572e
Maia DJ, De Paoli MA, Alves OL, Zarbin AJG, Neves S (2000) Síntese
de polímeros condutores em matrizes hospedeiras. Quím Nova 23(2):204-215. doi: 10.1590/S0100-40422000000200011
Mi H, Zhang X, Yang S, Ye X, Luo J (2008) Polyaniline nanoibers as the electrode material for supercapacitors. Mater Chem Phys 112(1):127-131. doi: 10.1016/j.matchemphys.2008.05.022
Michell E, Candler J, De Souza F, Gupta RK, Gupta BK, Dong LF (2015) High performance supercapacitor based on multilayer of polyaniline and graphene oxide. Synthetic Met 199:214-218. doi: 10.1016/ j.synthmet.2014.11.028
Padilha RMA (2011) Estudo de transporte de cargas de polímeros de polianilina (Master’s thesis). Rio de Janeiro: Pontifícia Universidade Católica.
Rakic A, Bajuk-Bogdanović D, Mojović M, Ćirić-Marjanović G, Milojević-Rakić M, Mentus S, Marjanović B, Trchová M, Stejskal J (2011) Oxidation of aniline in dopant-free template-free dilute reaction media. Mater Chem Phys 127(3):501-510. doi: 10.1016/ j.matchemphys.2011.02.047
Sapurina IY, Stejskal J (2010) The effect of pH on the oxidative polymerization of aniline and the morphology and properties of products. Russian Chemical Review 79(12):1123-1143. doi: 10.1070/RC2010v079n12ABEH004140
Singh V, Joung D, Zhai L, Das S, Khondaker SI, Seal S (2011) Graphene based materials: past, present and future. Progr Mater Sci 56(8):1178-1271. doi: 10.1016/j.pmatsci.2011.03.003
Smith AL (1979) Applied infrared spectroscopy: fundamentals, techniques, and analytical problem-solving. New York: Wiley-Interscience.
Tang J (1988) Infrared spectra of soluble polyaniline. Synthetic Met 24:231-238. doi: 10.1016/0379-6779(88)90261-5
Wang H, Hao Q, Yang X, Lu L, Wang X (2009) Graphene oxide doped polyaniline for supercapacitors. Electrochem Comm 11(6):1158-1161. doi: 10.1016/j.elecom.2009.03.036
Wang H, Hao Q, Yang X, Lu L, Wang X (2010) Effect of graphene oxide on the properties of its composite with polyaniline. ACS Appl Mater Interfaces 2(3):821-828. doi: 10.1021/am900815k
Wei P, Fan M, Chen H, Yang X, Wu H, Chen J, Li T, Zeng L, Zou Y (2015) High-capacity graphene/sulfur/polyaniline ternary composite cathodes with stable cycling performance. Electrochimica Acta
174:963-969. doi: 10.1016/j.electacta.2015.06.052
Yang JE, Jang I, Kim M, Baeck SH, Hwang S, Shim SE (2013) Electrochemically polymerized vine-like nanostructured polyaniline on activated carbon nanoibers for supercapacitor. Electrochim Acta 111:136-143. doi: 10.1016/j.electacta.2013.07.183
Zeng XR, Ko TM (1998) Structures and properties of chemically reduced polyanilines. Polymer 39(5):1187-1195. doi: 10.1016/ s0032-3861(97)00381-9
![Figure 6. Transmission MIR spectra of PAni/GO, prepared as KBr pellets.58.54000 3500 3000 2500 2000 1500 1000 50065.071.520.727.634.519.224.028.835.139.042.946.84.59.013.518.0Wavenumber [cm-1 ] GO PAni 25% /GO 75%](https://thumb-eu.123doks.com/thumbv2/123dok_br/18889997.424789/5.892.458.808.616.1043/figure-transmission-spectra-pani-prepared-pellets-wavenumber-pani.webp)