ABSTRACT: This study aims to evaluate the dynamic mechanical properties of a binder, used in composite propellants, with increasing amount of different solid illers. Dynamic Mechanical Analysis (DMA) is performed to determine the region of glass-rubber transition temperature (Tg). Further parameters were obtained from the description of the loss factor curves (tanδ)
with models based on exponentially modiied Gauss (EMG) distribution function. Polyurethane binders employing the polyol HTPB and diisocyanate were illed with 20, 40, and 60 mass-% of ammonium perchlorate (AP), aluminum (Al) or cyclotrimethylene trinitramine (RDX) particles, using ine and coarse mean sizes. A special turning device manufactured by Fraunhofer ICT was installed inside the curing oven in order to avoid sedimentation during curing. The cured composites were characterized by DMA in torsion mode from -100 °C to 70 °C. The good homogeneous distribution of illers in the samples was evaluated by computational X-ray micro-tomography. The data on tanδ showed a complex structure describable at irst
with 2 overlapping peaks. The peak at lower temperatures is due to mobility of unrestricted binder parts (Tgunr) and the second broader peak at high temperature is due to mobility of restricted binder parts (Tgres). Results of tanδ, calculated
areas of EMG curves and apparent activation energies of the distinct relaxation processes indicate that Al particles have higher interaction with HTPB-based polyurethane than AP and RDX. Probably Al is bonded to the binder network via isocyanate coupling with OH groups present in the surface. Ammonium perchlorate and cyclotrimethylene trinitramine particle sizes and its morphology inluenced the viscoelastic properties. AP and RDX cause more changes in intensity of irst peak of loss factor than Al. Increasing amount of these both particles enhances storage (G’) and loss (G”) shear moduli. As a whole tanδ intensity is lowered in the main peak and Al showed an intensity increase in the second apparent peak.
KEYWORDS: DMA, Ammonium perchlorate, Aluminum, Cyclotrimethylene trinitramine, HTPB loss factor modelling.
Evaluation of Filler Effects on the Dynamic
Mechanical Behavior of HTPB-Elastomer Used
as Binder in Exemplary Composite Formulations
Mauricio Ferrapontoff Lemos1, Günter Mussbach2, Manfred August Bohn3INTRODUCTION
A composite solid propellant (CSP) is an energetic material characterized by the release of high amount of energy during burning, generating hot gases and low molar mass molecules (Davenas 1993; Kubota 2007; Cerri et al. 2009). The CSP consists of a polymer matrix (binder) containing a high amount of solid particles. Polybutadiene-based polyols such as hydroxyl-terminated polybutadiene (HTPB) are today the main pre-polymers used for CSP, which are cross-linked with polyisocyanates to give a polyurethane elastomer (Cerri et al. 2009; Hufferd and Fitzgerald 1976). The main solid particles used as fillers are oxidizers, such as nitrates and perchlorates, which supply oxygen for the combustion reactions. Another important filler is the aluminum powder, which acts as fuel during the combustion by its strong exothermic oxidation reaction and cyclotrimethylene trinitramine (RDX) particle that can be used in some specific HTPB-based formulations as well as in plastic bonded explosives (PBX) (Davenas 1993; Kubota 2007; Cerri et al. 2009; Hufferd and Fitzgerald 1976; Lemos and Bohn 2016). The binder main functions are to give dimensional stability and viscoelastic properties, assuring structural integrity to CSP and minimizing or even avoiding combustion instabilities (Davenas 1993; Kubota 2007; Hufferd and Fitzgerald 1976).
The mechanical properties of composites with elastomeric binders depend strongly on the surrounding temperatures and on the deformation frequency of the applied mechanical load. In terms of low temperature properties, the elastomer
1.Instituto de Pesquisas da Marinha – Grupo de Tecnologia de Materiais – Rio de Janeiro/RJ – Brazil. 2.Bayern-Chemie GmbH – Aschau am Inn – Germany.
3.Fraunhofer Institute for Chemical Technology – Pinztal – Germany.
Author for correspondence: Mauricio Ferrapontoff Lemos | Instituto de Pesquisas da Marinha – Grupo de Tecnologia de Materiais | Rua Ipiru, 2 – Cacuia |
CEP: 21.931-095 – Rio de Janeiro/RJ – Brazil | Email: [email protected]
must be able to purvey a very low glass-rubber transition temperature (Tg) for safe operation (Davenas 1993; Kubota 2007; Cerri et al. 2009; Hufferd and Fitzgerald 1976; Lemos and Bohn 2016; Fluke 1969; Bohn 2016; Bohn et al. 2014; Cerri and Bohn 2010; Cerri et al. 2013). The loss factor (tanδ) as function of temperature, obtained in DMA, defines the region of glass-rubber transition. The glass-rubber transition temperature Tg is defined as temperature at the maximum in loss factor curve. However, the tanδ curve of CSP consists of several sub-transitions referring to different fractions of the elastomer binder with different mobility (Cerri et al. 2009; Bohn 2016; Bohn et al. 2014; Cerri and Bohn 2010; Cerri et al. 2013; Azoug et al. 2015). A modeling of the loss factor curve with suitable distribution functions is needed to separate these effects in tanδ and to characterize them quantitatively in terms of the maximum peak temperatures and by other parameters as areas (intensities), peak widths, and peak skewness (Bohn 2016; Bohn et al. 2014; Cerri and Bohn 2010; Cerri et al. 2013; Azoug et al. 2015). A CSP grain is subjected to several dynamic mechanical load stresses during transport, ignition and even during storage in a broad temperature range. In several investigations the viscoelastic response is reported under dynamic loads at frequencies from 0.1 up to 110 Hz from –40 °C to 50 °C (Hufferd and Fitzgerald 1976). Deformation frequency of applied stress or strain imparts changes in mechanical response of a viscoelastic binder, especially in the Tg region (Cerri et al. 2009; Hufferd and Fitzgerald 1976; Bohn et al. 2014; Cerri et al. 2013; Ornaghi Jr et al. 2010). Previous study showed an undesirable δ intensity increase and a shift of the peak to higher temperatures with increasing deformation rate in CSP, caused by molecular frictions, thus indicating the possibility of high energy dissipation and therefore a heating up of the material (Bohn 2016; Bohn et al. 2014; Cerri et al. 2013). These effects have severe implications for these materials already at moderate low temperatures. It is important to evaluate to which extend each type of solid particle in a CSP formulation affects these relaxations and dissipative effects, since each particle has different interaction possibilities with the binder. This paper aims at a first step of investigation to find out how the individual fillers interact with the HTPB-based matrix. Experimental investigation is performed in order to evaluate the influence of the type of fillers on the shape and intensity of loss factor and on its shift with deformation frequency.
METHODOLOGY
SAmplE pREpARATiOn
he composite samples consisted of a polyurethane binder illed with 20, 40 or 60 mass-% of diferent iller types. he polyurethane was obtained by the reaction of the polyol Hydroxyl-Terminated Polybutadiene type HTPB R45 HTLO (Sartomer, Polybd, Oakland, USA) with the curing agent Isophorone Diisocyanate – IPDI (Evonik, Marl, Germany) in a ratio of NCO to OH groups (Req) adjusted to 0.85. Plasticizer Dioctyl Adipate – DOA (BASF, Ludwigshafen, Germany) was added in 5 mass-% relative to total binder content. As illers were used the ammonium perchlorate (AP), with particle size d(0.5) equal to 42.83 μm (ine) and 202.28 μm (coarse); RDX from Dyno/Norway with 60.86 μm (ine) and 233.26 μm (coarse); and Al (Toyal, USA) with d(0.5) of 20.69 μm (type X81, ine) and 130.25 μm (coarse). he composite samples were manufactured at Fraunhofer ICT in a planetary centrifugal vacuum mixer (hinky Corporation, Tokyo, Japan). Operational conditions were 1,600 rpm rotation speed and 3 kPa vacuum during few minutes of mixing time. he temperature in the mix was kept below 40 °C. he formulations were produced in small batches and poured into a cylindrical glass recipient, sealed and cured in air at 60 °C for 96 h. he binder was protected by the addition of the antioxidant VulkanoxTM BKF.
Just ater mixing, the particles were homogeneously distributed all over the sample volume. However, the particles tended to sediment in the liquid binder mix in early stages of the curing process, when the viscosity was not yet high. his problem was even more critical for samples with lower amounts of solid loading, such as 20 and 40 mass-% of illers. hus, in order to keep the illers homogeneously distributed during all stages of curing process, a special turning device was manufactured at Fraunhofer ICT and installed inside the curing oven (Fig. 1).
was equipped with a counter to monitor the number of rotation cycles, useful for instance in case of failures in power network. he turning time is typically about 4 s and the holding time was set to 60 s. Ater curing, the glasses were broken and the DMA samples cut from the middle of the cured composite.
to +70 °C, with heating rate of 1 °C/min and soak time of 28 s. At −100 °C a pre-strain sweep test was performed to determine the value of strain control, in order to stay in the linear viscoelastic region during the measurements. At each temperature step, the specimens were measured at 4 sinusoidal deformation frequencies (0.1; 1; 10 and 30 Hz). he geometrical dimensions of the rectangular samples were about 40 mm length, 10 mm width and 5 mm thickness. In the cases where the material was too sot (as with pure binder and binder with 20 and 40 mass-% of iller), the signal scattered and a second strain sweep was necessary at −40 °C to determine a higher second strain control to be used from about −40 °C up to +70 °C.
Scanning electron microscopy (SEM) images were obtained by Supra 55VP (Zeiss, Germany).
RESULTS AND DISCUSSIONS
In Fig. 2, a sample with 20 mass-% of AP was used to show how the particles are homogeneously distributed in the elastomers after curing using the turning machine. he Micro-CT X-ray scan, shown in Fig. 2b, demonstrates the homogeneity of the distribution of the AP particle.
Figure 1. Design of the turning machine, schematic sketches (a). Installation and operation in curing oven shown in photographs (b and c) at Fraunhofer ICT. The device was used successfully for the curing of elastomers with low degree of illing of solid particles to avoid sedimentation.
(a)
(b)
(b) (a)
(c)
SAmplE ChARACTERizATiOn
A microcomputer tomography Micro-CT in-vivo Skyscan 1076 (Bruker, Germany) was used to evaluate the distribution of the illers in the samples taken for DMA measurements.
Dynamic mechanical analysis measurements in torsion mode were carried out with a DMA ARESTM (Advanced
Rheometric Expansion System) manufactured by the former Rheometric Group of the company Rheometric Scientiic, Inc. (this group belongs now to Waters, Inc., BU TA Instruments, New Castle, NJ, USA). he following parameters were determined: storage shear modulus G
’
, loss shear modulus G’’
, loss factor tanδ = G’’
/G’
as well as the phase angle δ and the torque. Measurements were performed in torsion mode from −100 °CFigure 2. Images from DMA sample with 20 mass-% of AP. (a) Normal optical photograph and (b) 3-D image taken from a Micro-CT X-ray scan, showing AP particles in gray.
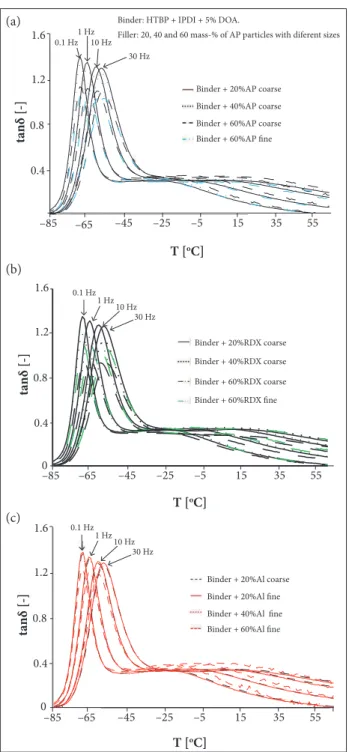
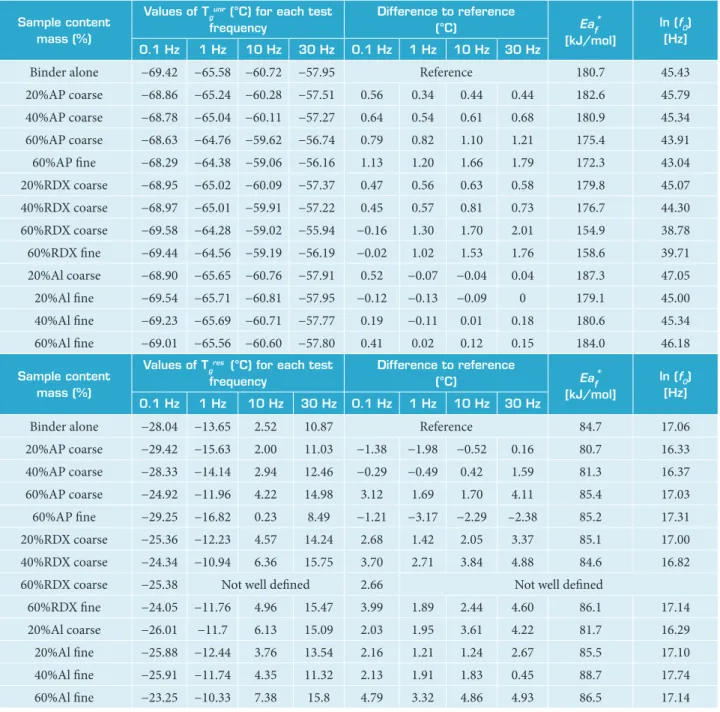
loss factor curves at all deformation frequencies are shown for the samples with increasing amount of AP, RDX and Al. Each sample has 2 apparent peaks, with tailing towards higher temperatures. Table 1 shows the values of Tg for each tanδ peak for each frequency. he values of the diferences between the Tg of composite and of pure binder are taken as reference
and are also presented. Samples with 60 mass-% of RDX had no defined apparent second peak in loss factor curves at deformation frequency higher than 0.1 Hz. his is a general feature also shown with HMX as iller (Bohn et al. 2014).
The first peak at lower temperatures represents the “mobility unrestricted glass-rubber transition” with the temperature Tg unr, and it is attributed to the main transition
of the soft segment regions of the HTPB chains in the temperatures range of −80 to −60 °C. The second broader peak originates from the transition regions of the hard segments of the polyurethane network (cross-link sites) and in part of the binder molecules (soft and/or hard segments), which have restricted mobility, for example, by filler-binder interaction. Therefore, this peak is called “restricted” and the associated maximum temperature is named Tg res
(Cerri et al. 2009; Bohn 2016; Cerri et al. 2013; Azoug et al. 2015). Each transition region corresponds to molecular rearrangements of fractions of the binder with different mobility. Tg unrincreased slightly at higher temperatures by
increasing the amount of AP and RDX particles but this decreased more considerably the tanδ intensity of the first peak especially at higher frequencies of applied strain. In Fig. 4, the curves are shown comparing loss factor curves at frequencies of 0.1 and 30 Hz. The curves of the samples with 60 mass-% of AP, RDX, and Al (fine) are indicated. Despite having less effect on the first peak, the Al addition imparts more intensity to tanδ of the second peak, and also shifted it to higher temperatures (see Tg resvalues of the lines
of 60 mass-%-filled samples in Table 1). A distinguishable
Figure 3. Deformation frequency dependence of the loss factor curve of composites samples with 20, 40, and 60 mass-% of AP (a), RDX (b) and Al (c) ine and coarse particles.
T [oC]
Binder + 20%AP coarse
Binder + 40%AP coarse
Binder + 60%AP coarse Binder + 60%AP fine
Binder + 20%RDX coarse
Binder + 40%RDX coarse
Binder + 60%RDX coarse
Binder + 60%RDX fine
Filler: 20, 40 and 60 mass-% of AP particles with diferent sizes Binder: HTBP + IPDI + 5% DOA.
T [oC]
1.2 1.6 0 0.8 0.4 tan δ [-]
T [oC]
–85 –65 –45 –25 –5 15 35 55
1.2 1.6 0.8 0.4 0 tan δ [-] –65
–85 –45 –25 –5 15 35 55
1.2 1.6 0.8 0.4 tan δ [-] –65
–85 –45 –25 –5 15 35 55
0.1 Hz 1 Hz 10 Hz 30 Hz 0.1 Hz 1 Hz 10 Hz 30 Hz 0.1 Hz 1 Hz 10 Hz 30 Hz
Binder + 20%Al coarse
Binder + 20%Al fine
Binder + 40%Al fine Binder + 60%Al fine
Figure 4. Loss factor curves of pure binder and of composites samples with 20 and 60 mass-% of AP, RDX, and Al coarse and ine particles. DMA in torsion mode at frequencies of 0.1 and 30 Hz.
1.1 0.7 0.3 -0.1 tan δ [-]
T [oC]
-75 -65 -55 -45 -35 -25 -15 -5 5 15 25 35 45
binder + 20% RDX coarse binder + 20% AI coarse binder + 20% AP coarse binder + 60% RDX fine binder + 60% AI fine binder + 60% AP fine pure binder
0.1 Hz 30 Hz
60 Hz
change in the first peak with the addition of AP and RDX in comparison to Al might be related with volumetric effects. The densities of AP and RDX are 1.95 g/cm3 and 1.82 g/cm3,
respectively, whereas Al has 2.7 g/cm3. So the use of an
equal mass results in a higher occupied volume by the particles in the composites with AP and RDX, imparting more geometrical hindrance to chain mobility than by the Al. On the other hand, Al filled samples present a higher intensity on the second peak, which might be explained by a higher filler-binder interactions.
The molecular rearrangements during glass-rubber transition enhance the thermo-mechanical energy loss inside the polymer. herefore, loss shear modulus increases. During glass-rubber transition, when the molecules are stimulated to pass a threshold of energy, long-range chain mobility takes place along the segments and the loss factor is at its maximum. By increasing the deformation frequency in DMA, the chains have less time to move and rearrange in order to accommodate the mechanical energy. So when heating up the samples from very low temperatures, the energy elastic
Sample content mass (%)
Values ofTgunr (°C) for each test
frequency
Difference to reference
(°C) Eaf
*
[kJ/mol]
ln (f0) [hz]
0.1 hz 1 hz 10 hz 30 hz 0.1 hz 1 hz 10 hz 30 hz
Binder alone −69.42 −65.58 −60.72 −57.95 Reference 180.7 45.43
20%AP coarse −68.86 −65.24 −60.28 −57.51 0.56 0.34 0.44 0.44 182.6 45.79
40%AP coarse −68.78 −65.04 −60.11 −57.27 0.64 0.54 0.61 0.68 180.9 45.34
60%AP coarse −68.63 −64.76 −59.62 −56.74 0.79 0.82 1.10 1.21 175.4 43.91
60%AP ine −68.29 −64.38 −59.06 −56.16 1.13 1.20 1.66 1.79 172.3 43.04
20%RDX coarse −68.95 −65.02 −60.09 −57.37 0.47 0.56 0.63 0.58 179.8 45.07
40%RDX coarse −68.97 −65.01 −59.91 −57.22 0.45 0.57 0.81 0.73 176.7 44.30
60%RDX coarse −69.58 −64.28 −59.02 −55.94 −0.16 1.30 1.70 2.01 154.9 38.78
60%RDX ine −69.44 −64.56 −59.19 −56.19 −0.02 1.02 1.53 1.76 158.6 39.71
20%Al coarse −68.90 −65.65 −60.76 −57.91 0.52 −0.07 −0.04 0.04 187.3 47.05
20%Al ine −69.54 −65.71 −60.81 −57.95 −0.12 −0.13 −0.09 0 179.1 45.00
40%Al ine −69.23 −65.69 −60.71 −57.77 0.19 −0.11 0.01 0.18 180.6 45.34
60%Al ine −69.01 −65.56 −60.60 −57.80 0.41 0.02 0.12 0.15 184.0 46.18
Sample content mass (%)
Values ofTg
res (°C) for each test
frequency
Difference to reference
(°C) Eaf
*
[kJ/mol]
ln (f0) [hz]
0.1 hz 1 hz 10 hz 30 hz 0.1 hz 1 hz 10 hz 30 hz
Binder alone −28.04 −13.65 2.52 10.87 Reference 84.7 17.06
20%AP coarse −29.42 −15.63 2.00 11.03 −1.38 −1.98 −0.52 0.16 80.7 16.33
40%AP coarse −28.33 −14.14 2.94 12.46 −0.29 −0.49 0.42 1.59 81.3 16.37
60%AP coarse −24.92 −11.96 4.22 14.98 3.12 1.69 1.70 4.11 85.4 17.03
60%AP ine −29.25 −16.82 0.23 8.49 −1.21 −3.17 −2.29 –2.38 85.2 17.31
20%RDX coarse −25.36 −12.23 4.57 14.24 2.68 1.42 2.05 3.37 85.1 17.00
40%RDX coarse −24.34 −10.94 6.36 15.75 3.70 2.71 3.84 4.88 84.6 16.82
60%RDX coarse −25.38 Not well deined 2.66 Not well deined
60%RDX ine −24.05 −11.76 4.96 15.47 3.99 1.89 2.44 4.60 86.1 17.14
20%Al coarse −26.01 −11.7 6.13 15.09 2.03 1.95 3.61 4.22 81.7 16.29
20%Al ine −25.88 −12.44 3.76 13.54 2.16 1.21 1.24 2.67 85.5 17.10
40%Al ine −25.91 −11.74 4.35 11.32 2.13 1.91 1.83 0.45 88.7 17.74
60%Al ine −23.25 −10.33 7.38 15.8 4.79 3.32 4.86 4.93 86.5 17.14
Table 1. Values of Tg unr and T g
state is retained longer, up to higher temperatures. Ot en this ef ect is also named strain rate hardening.
The deformation frequency dependence of the thermo-mechanically activated glass-rubber transition can be expressed by Arrhenius parameterization. With the use of an Arrhenius type equation (Eq. 1), an apparent activation energy Eaf* of the distinct relaxation process can be estimated.
where: f is the applied deformation frequency [Hz]; f0 is the apparent pre-exponential factor [Hz]; Eaf*is the
apparent activation energy [kJ/mol]; R is the general gas constant [8.31441 J/K∙mol]; Tgis the glass-rubber transition temperature [K] as function of deformation frequency f.
In Table 1 the values of Eaf* and f
0 are listed. In Fig. 3 the
shift of the loss factor curve to higher temperatures can be seen with increasing deformation frequency for the samples with increasing amount of AP, RDX, and Al.
The Eaf* values of the distinct relaxation process change
slightly with filler addition. With AP addition the Eaf* of
first peak (Tgunr) increases initially (20 mass-%), but then
decreases with increasing amount of filler. RDX addition, however, decreases continuously the Eaf* of T
g
unr. An opposite
trend is found with the values of activation energies of the Tgres. The addition of Al particles imparted overall slightly
higher values of Eaf** among all, which is an indication of higher interaction with the polymer matrix.
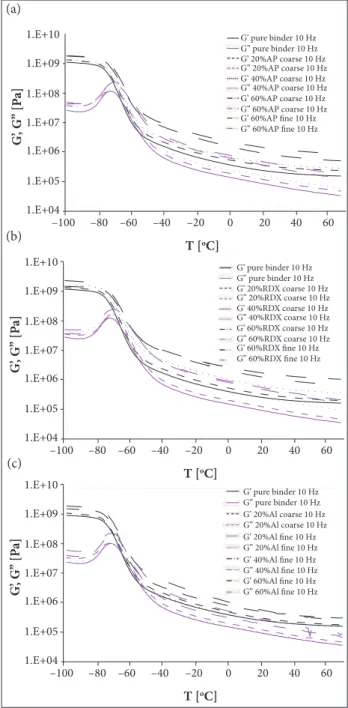
In Fig. 5, the elastic (storage) and loss shear modulus (G
’
and G”
) are presented for all the samples tested at deformation frequency of 10 Hz. Before the transition, G’
and G”
are very similar for the composites. Only G’
of samples with 60 mass-% is significantly higher. Increasing amount of AP and RDX particles enhances G’
and G”
, although with AP this happens mainly after Tgunr. Al produces this effectmore pronounced at lower temperatures. After the first transition the differences increase, and it is notable that the increase in solid filler content in the composites increases both G
’
and G”
. Storage modulus increase is related with a reinforcement of the material, whereas loss modulus increase with increasing solid fillers in composites is known to be caused by an enhanced internal friction in dynamic mechanical loading experiments (Bohn et al. 2014; Ornaghi Jr et al. 2010). Regarding particle sizes, the use of fine AP and fine RDX incremented G’ more than G”.h e quantii cation of the ef ects (interaction and amount) of each i ller on the loss factor curve is possible with the use of a model based on exponentially modified Gauss (EMG) distribution functions. h e EMG is a convolution between Gauss distribution and exponential decay function. Previous studies have described the model in details (Bohn 2016; Bohn et al. 2014; Cerri and Bohn 2010; Azoug et al. 2015). h e application
(1)
G’ pure binder 10 Hz G’’ pure binder 10 Hz G’ 20%AP coarse 10 Hz G’’ 20%AP coarse 10 Hz G’ 40%AP coarse 10 Hz G’’ 40%AP coarse 10 Hz G’ 60%AP coarse 10 Hz G’’ 60%AP coarse 10 Hz G’ 60%AP fine 10 Hz G’’ 60%AP fine 10 Hz
G’ pure binder 10 Hz G’’ pure binder 10 Hz G’ 20%RDX coarse 10 Hz G’’ 20%RDX coarse 10 Hz G’ 40%RDX coarse 10 Hz G’’ 40%RDX coarse 10 Hz G’ 60%RDX coarse 10 Hz G’’ 60%RDX coarse 10 Hz G’ 60%RDX fine 10 Hz G’’ 60%RDX fine 10 Hz
1.E+10 1.E+09 1.E+08 1.E+07 1.E+06 1.E+05 1.E+04 G ’, G ’’ [P a]
T [oC]
–100 –80 –60 –40 –20 0 20 40 60 1.E+10 1.E+09 1.E+08 1.E+07 1.E+06 1.E+05 1.E+04 G ’, G ’’ [P a]
T [oC]
–100 –80 –60 –40 –20 0 20 40 60 1.E+10 1.E+09 1.E+08 1.E+07 1.E+06 1.E+05 1.E+04 G ’, G ’’ [P a]
T [oC]
–100 –80 –60 –40 –20 0 20 40 60
G’ pure binder 10 Hz G’’ pure binder 10 Hz G’ 20%Al coarse 10 Hz G’’ 20%Al coarse 10 Hz G’ 20%Al fine 10 Hz G’’ 20%Al fine 10 Hz G’ 40%Al fine 10 Hz G’’ 40%Al fine 10 Hz G’ 60%Al fine 10 Hz G’’ 60%Al fine 10 Hz
Figure 5. G’ and G” curves of all samples measured at 10 Hz deformation frequency of applied strain. Samples consisting of binder with increasing amount (20, 40, and 60 mass-%) of (a) AP, (b) RDX, and (c) Al.
(a)
(b)
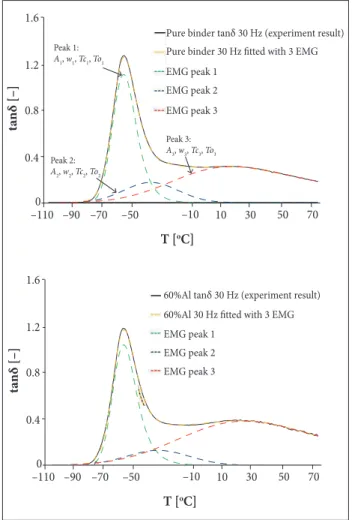
of EMGs provides parameters of the sub-transition regions of the loss factor curve: the peak areas (Ai); the half peak width at half height of the Gaussian part of corresponding EMGi (wi); the temperature at peak maximum of Gaussian part of the EMGi (Tci) and the relaxation parameter τiin the exponential part of the EMGi (herein named To). Figure 6 shows 3 EMG functions to describe each of the tanδ data of the pure binder (a) and of the composite illed with 60 mass-% of Al particles (b). his was done for all samples at all deformation frequencies. Due to limited space only the parameters obtained for the samples illed with 60 mass-% particles are presented in Table 2.
Two parameters are considered to be more important for composites and are discussed in more detail. One is the parameter Ai, which is the area of the loss factor curve. When the intensity of the glass-rubber transition expressed by A is small, the reasons can be: (1) more hindrance in mobility for
the pre-polymer or (2) a more elastic behavior of the polymer means a more dominant elastic (storage) shear modulus. he other parameter of importance is the peak temperature Tci.
Regarding the sum of the peak areas (∑Ai), illing the binder with AP coarse particles had nearly no efect. Fine AP however had caused an overall depreciation of Ai parameters. his means that the polymer gained more in the elastic than in the loss shear modulus — one can say the sample is more elastic and less viscous. RDX has a reversed efect: the illing with coarse particle size had decreased the sum of Ai parameters. SEM analysis of AP ine and RDX coarse particles (Fig. 7b and 7c) showed that both are less round (means have more irregular geometry and edges), whereas coarse AP and ine RDX (Fig. 7a and 7d) had an apparent geometry closer to a sphere or are rounded particles. his is an indicative that the sum of Ai parameters, meaning the overall area of the loss factor curve, seems more afected by the AP and RDX particle shapes than by their size.
A3 is the area of the peak attributed to the transition of parts of the binder with more restriction to chain mobility, i.e. in iller-binder interfaces for example. It is evident from the results that the addition of Al particles had a stronger efect on increasing the value of this parameter than the other particles, and this efect is even more pronounced when deformation frequency is increased. On the surface of aluminum particles there is the possibility of forming Al hydroxide due to contact of the metallic Al with air (oxygen) and humidity. It was already discussed in the literature that the OH on Al may capture one end of isocyanate molecules (Cerri et al. 2009; Cerri et al. 2013), leaving less isocyanate groups to react with pre-polymer and more not bonded polyol chain ends are available. his may change the Req in the binder near the Al particles. According to literature, the second apparent loss factor peak in HTPB-based solid propellants, consisting mainly by the EMG-3 (peak 3), can be caused by 2 efects:
1. From the low of free polymer chains in the polymer network with a reptation mechanism. If more polymer or polyol chains are available to move near the particle due to isocyanate “capture” near the Al surface, one could expect an increase in A3 value (Azoug et al. 2015). 2. From a more intense intermolecular interaction between
Al and HTPB than between the polyol and AP. Due to stronger interactions, the Al exert more hindrance on the mobility of the HTPB chains in the polymer shell around the particles (Nardai and Bohn 2015). As a irst consequence the glass-rubber transition temperature of 1.6
1.2
0.8
0.4
0
tan
δ [–]
T [oC]
–110 –90 –70 –50 –10 10 30 50 70
EMG peak 3 EMG peak 2 EMG peak 1
60%Al 30 Hz fitted with 3 EMG 60%Al tanδ 30 Hz (experiment result)
1.6
1.2
0.8
0.4
0
tan
δ [–]
T [oC]
–110 –90 –70 –50 –10 10 30 50 70
Peak 2: A2, w2, T c2, T o2
Peak 1: A1, w1, T c1, T o1
Peak 3: A3, w3, T c3, T o3 EMG peak 3 EMG peak 2 EMG peak 1
Pure binder 30 Hz fitted with 3 EMG
Pure binder tanδ 30 Hz (experiment result)
pure binder 60 mass-% Ap coarse 60 mass-% Ap ine
f (Hz) 0.1 1 10 30 0.1 1 10 30 0.1 1 10 30
A1 13.3 16.7 20.3 22.5 10.8 13.5 16.2 18.0 11.0 13.9 17.0 22.5
A2 2.6 5.6 7.2 7.8 2.8 4.8 8.2 8.3 3.7 7.9 7.6 6.7
A3 24.8 29.0 39.0 42.3 25.2 30.9 38.7 45.8 19.9 21.3 31.3 34.1
∑Ai 40.8 51.3 66.5 72.7 38.8 49.3 63.2 72.2 34.5 43.1 56.0 63.3
w1 4.2 5.2 5.6 6.3 4.3 5.2 5.6 6.3 4.5 5.5 6.1 6.7
w2 2.0 2.7 16.4 17.5 2.1 2.8 17.0 17.5 2.3 3.1 16.5 6.6
w3 25.3 26.3 26.7 28.5 26.8 27.7 25.5 28.1 24.7 25.6 23.9 30.6
Tc1 −70 −66 −65 −63 −69 −66 −64 −61 −69 −65 −63 −65
Tc2 −63 −58 −46 −43 −62 −57 −46 −42 −61 −56 −43 −57
Tc3 −43 −33 −23 −20 −38 −32 −20 −17 −39 −28 −19 −12
To1 0.9 1.0 5.6 6.4 0.8 1.0 5.5 6.1 0.9 1.0 5.8 23.8
To2 9.6 17.1 2.7 3.0 11.4 16.6 3.2 3.0 15.4 26.8 3.3 1.0
To3 22.3 37.6 60.1 70.8 17.6 35.1 59.3 75.1 20.9 34.5 57.9 66.6
60 mass-% RDX coarse 60 mass-% RDX ine 60 mass-% Al ine
f (Hz) 0.1 1 10 30 0.1 1 10 30 0.1 1 10 30
A1 9.7 12.1 16.2 19.2 10.8 13.7 17.4 19.4 13.4 14.9 17.7 21.2
A2 3.3 6.3 7.3 6.1 3.0 5.4 10.1 13.4 2.6 5.2 7.5 6.5
A3 21.3 22.9 28.6 33.5 23.9 32.5 35.6 37.4 25.4 35.6 48.2 49.8
∑Ai 34.3 41.2 52.2 58.8 37.7 51.6 63.1 70.2 41.4 55.7 73.4 77.4
w1 4.5 5.5 6.0 6.7 4.3 5.4 6.8 7.6 4.2 5.2 5.1 6.0
w2 2.2 3.1 17.4 17.3 2.2 3.1 4.1 4.8 1.7 2.9 21.1 20.0
w3 25.9 27.0 23.8 27.4 26.2 26.7 31.6 34.6 25.8 27.0 30.1 34.2
Tc1 −69 −65 −64 −62 −69 −65 −61 −58 −70 −66 −65 −63
Tc2 −61 −57 −41 −34 −62 −57 −50 −47 −63 −58 −49 −39
Tc3 −40 −31 −18 −14 −39 −33 −16 −5 −41 −30 −20 −11
To1 0.8 1.0 6.8 8.2 0.8 1.0 1.4 1.5 0.8 1.0 6.6 7.5
To2 15.5 22.4 3.3 3.2 11.6 17.9 29.3 35.5 9.9 16.0 3.0 3.1
To3 19.7 32.8 54.4 65.3 19.3 43.3 54.6 60.1 21.0 35.8 59.3 56.6
Table 2. Values of EMG parameters of samples with 60 mass-% coarse and ine particles in comparison with the pure binder.
such binder fractions is shited to higher temperature values compared to not mobility restricted HTPB chains (see Tc3 parameters). Secondly, because of the increased binder part in this fraction, it creates a relative intense glass-rubber transition, since the mobility restriction
imparted by Al is not high enough to avoid the transition to take place, meaning that no rigidity for the polymer chains is caused.
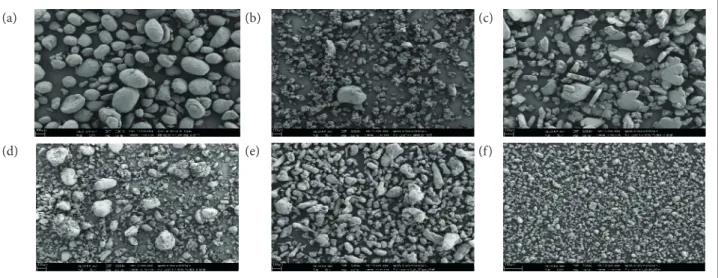
Figure 7. SEM images (magniication of 50X) of the particles loaded in the CSP in this study. (a) Coarse AP, rounded; (b) Fine AP, non-rounded (AP) particles; (c) Coarse RDX, non-rounded; (d) Fine RDX, rounded; (e) Coarse Al, rounded; (f) Fine Al, rounded. Scale of 100 μm.
polymer chains in the neighborhood of particles, which form then a more rigid amorphous region and the transition intensity is reduced, but the storage modulus increases. Another efect is the stronger chemical bonding of Al particles to the network, when isocyanate attaches to the Al surface via its OH groups. his enlarges the polymer shell around Al particles and the intensity of A3 is increased.
Regarding the Tc parameters, Tc1 is nearly not afected, independent of particle size or type. Tc3 is increased, and the increase is more pronounced at higher frequencies, especially with ine particle sizes. his is an indication that an increase in solid iller tend to enhance chain mobility restrictions, afecting the Tg res, corroborating the results shown in Table 1.
CONCLUSIONS
AP and RDX impart more changes in tanδ intensity of the irst loss factor peak than Al particles. he main glass-rubber transition temperature (Tg unr) is nearly not affected by the
addition of particles.
Results of tanδ intensity as calculated areas of EMGs itting curves and results of apparent activation energies of the distinct relaxation process during Tg reswith increasing frequency indicates
that Al particles have higher interaction possibilities with HTPB-based polyurethane binder than AP and RDX, when no bonding agents are used. Probably Al is bonded to the binder network via isocyanate coupling, because on Al surfaces OH groups are always present. AP and RDX particle sizes and their shape or their particle morphology inluence the viscoelastic properties. Increasing amount of AP and RDX particles enhances storage (G’) and loss (G”) shear moduli, but AP causes this efect mainly during and ater Tgunr. Al produces this efect more pronounced
at lower temperatures in the range of the second loss factor peak.
AUTHOR’S CONTRIBUTION
Lemos MF and Mussbach G performed the experiments; Lemos MF and Bohn MA conceived the ideas and co-wrote the main text. All authors discussed the results and commented on the manuscript.
(a)
(d)
(b)
(e)
(c)
(f)
REFERENCES
Azoug A, Nevière R, Constantinescu A (2015) Molecular origin of the
inluence of the temperature on the loss factor of solid propellant.
Propellants Explos Pyrotech 40(4):469-478. doi: 10.1002/ prep.201400060
Bohn MA (2016) Influences on the loss factor of elastomer
binder for composite materials and its modelling. Proceedings of
Bohn MA, Mußbach G, Cerri S (2014) Modeling of loss factors of elastomer binders of high explosive charges and composite rocket propellants to separate binder fractions with different molecular mobility used to follow aging. Proceedings of 10th International Symposium on Special Topics in Chemical Propulsion & Energetic Materials; Poitiers, France.
Cerri S, Bohn MA (2010) Separation of molecular mobility ranges in loss factor curves by modeling with exponentially modiied gauss distributions. Proceedings of the 41st International Annual Conference of ICT; Karlsruhe, Germany.
Cerri S, Bohn MA, Menke K, Galfetti L (2009) Ageing behavior of HTPB based rocket propellant formulations. Cent Eur J Energ Mater 6(2):149-165.
Cerri S, Bohn MA, Menke K, Galfetti L (2013) Ageing of HTPB/AL/AP rocket propellant formulations investigated by DMA measurements. Propellants Explos Pyrotech 38(2):190-198. doi: 10.1002/ prep.201200186
Davenas A (1993) Solid rocket propulsion technology. Oxford; New York: Pergamon Press.
Fluke GA (1969) Composite solid propellant processing techniques. In:
Boyars C, Klager K, editors. Propellants manufacture, hazards, and testing. Vol. 88. Washington: American Chemical Society. p. 165-187.
Hufferd WL, Fitzgerald JE (1976) Development of a solid propellant viscoelastic dynamic model. Atlanta: J. E. Fitzgerald & Associates.
Kubota N (2007) Propellants and explosives. Weiheim: Wiley-VCH Verlag GmbH & Co.
Lemos MF, Bohn MA (2016) Evaluation of the effect of plasticizers on the DMA loss factor, the thermal and mechanical properties of Desmophen® 2200-based elastomers used for composite propellants. Proceedings of the 18th International Seminar on New Trends in Research of Energetic Materials; Pardubice, Czech Republic.
Nardai MM, Bohn MA (2015) Cohesion properties in PBX and composite propellants – computational results and experimental aspects. Proceedings of the 46th International Annual Conference of ICT; Karlsruhe, Germany.