Abstract— The quality of the optical fiber infrastructure is directly
related with the strength of the fiber polymer coating. In this work we have studied the effect of maritime environment in the aging of
optical fibers. The results show a decay rate of
0.00766±0.00065 GPa.day-1 for a 35g/L NaCl solution and of 0.01101±0.00133 GPa.day-1 for a 250g/L NaCl solution. The Boltzamann fit presented corroborates the experimental data, which shows that the aging transition period appears sooner for more concentrated solutions. The microscopy and SEM analysis performed confirmed the degradation condition of the fibers under study.
Index Terms— Optical fiber aging, maritime environment.
I. INTRODUCTION
In the actual fiber to the home infrastructures (FTTH) several factors are responsible for the fiber lifetime degradation, such as stress, humidity and temperature [1]. This is a key issue in the present telecommunication scenario, where the optical fiber infrastructure plays a relevant role. Several examples were reported about the fiber decrease of quality in a fiber link as result of the additional attenuation induced by the fiber coating degradation. For instance, Ad Abel reported the attenuation increase from 0.23 dB/km to 1.18 dB/km in a Asian commercial link due to the fiber extreme low temperatures exposition [1].
Previous works related with optical fibers aging and degradation had focus on the effect of the aqueous environment in the aging of optical fibers due to moisture diffusion into the silica surface [2]. In this work we have studied the effect of seawater in the zero stress aging of optical fibers, as this could be a relevant issue, especially in the installation of fiber networks in the seashore areas.
II. EXPERIMENTAL DESCRIPTION
To study the effect of maritime environment in the aging of optical fiber coatings, several samples of
Optical Fibres Coating Aging induced by the
Maritime Environment
F. Domingues and P. André
Instituto de Telecomunicações and Departamento de Física, Universidade de Aveiro, Campus de Santiago, 3810-193 Aveiro, Portugal.
M. Granada
a SMF-28e(R) fiber, from Corning, were exposed to a Sodium Chloride (NaCl) aqueous solution, with two different concentrations, namely 35g/L and 250g/L, at room temperature. The 35 g/L solution corresponds to the average sea water NaCl concentration while the 250 g/L corresponds to the Dead sea concentration (the highest found in the Earth).
The samples were removed from the NaCl solution, dry at environmental temperature for 24 hours, and its fracture stress measured. For that measurement it was used the flexion method with an experimental setup represented in Fig. 1.
Fig.1. Illustration of the experimental setup used to measure the fiber fracture stress.
The setup uses a fixe and a moveable PTFE plate, both with grooves for the fiber fixing. The moveable plate is controlled by an electric translation stage (Newport, model 861). Initially the plates had a distance between them of 20 mm. This distance is reduced during the tests at a speed of 0.55 mm/s. After the fiber break, the distance between plates is measured and related with the fiber fracture stress.
As the stress in the fiber is dependent of the distance between the two plates, decreasing the distance between them will increase the stress in the fiber. The stress applied in the fiber can be calculated through the equation (1) [3]:
+
=
ε
αε
σ
2 1 1 0 E
(1) Were σ is the fiber stress, E0 the fiber young modulus, ε the strain applied to the fiber and α is a non
linear elastic parameter. The strain term ε is given by (2):
+ − =
g c
f d d d
d
2 198
. 1
ε
(2) where df is fiber diameter without the coating, d the distance between plates, dc the fiber diameter with
coating and dg is the total depth of the two grooves. The non linear elastic parameter, α, is given by:
4 1 ' 4 3
+
=
α
α
For an optical fiber α’=6 [3]. By applying equation (1) to the measured data, we can determinate the
applied stress at which the fiber fractures. This procedure was executed for the two concentrations mentioned and for different aging periods. For every sample the average stress values and error were calculated for five identical samples.
III. MECHANICAL RESULTS
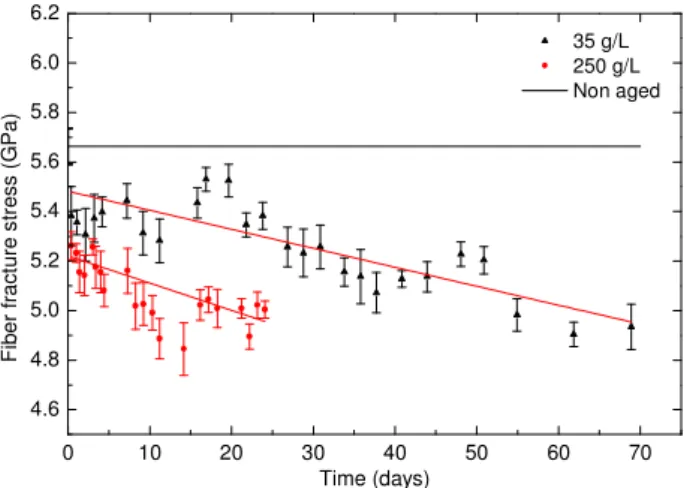
The fiber stress value was measured in order to find a relation between the aging time and the stress fracture. In Fig.2 we show the fracture stress of the fiber as function of the exposition time to the aqueous solutions and for a non aged sample. Each point represents the mean result of a five samples test.
0 10 20 30 40 50 60 70
4.6 4.8 5.0 5.2 5.4 5.6 5.8 6.0 6.2
35 g/L 250 g/L Non aged
F
ib
e
r
fr
a
c
tu
re
s
tr
e
s
s
(
G
P
a
)
Time (days)
Fig. 2: Stress decay rate for the NaCl solutions with concentrations of 35 g/L and 250 g/L.
0 50 100 150 200 250 -0.015 -0.010 -0.005 F ra c tu re s tr e s s d e c a y r a te ( G P a /d a y )
NaCl concentration (g/L)
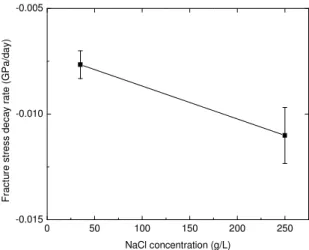
Fig. 3: Fracture stress decay rate for the NaCl solutions with concentrations of 35 g/L and 250 g/L.
With these results is safe to affirm that the aqueous solution of NaCl, namely its dissolved ions, penetrate the fiber coatings decreasing substantially its physical resistance.
It is long known from literature [3][4], that for fibers subjected to harsh environments for long periods, the fiber strength drastically drops after a certain time, corresponding to a fatigue transition, generally called as “knee”.
When we analyze the data collected for the two aging environments, plotted on a log-time chart, the aging starting process (“knee”) becomes evident, as shown in Fig. 4.
10 100 1000
0.85 0.90 0.95 1.00 N o rm a liz e d f ib e r fr a c tu re s tr e s s Time (hours) 35 g/L 250 g/L non aged
Fig. 4: Representation of the normalized stress as function of time in a log-time chart.
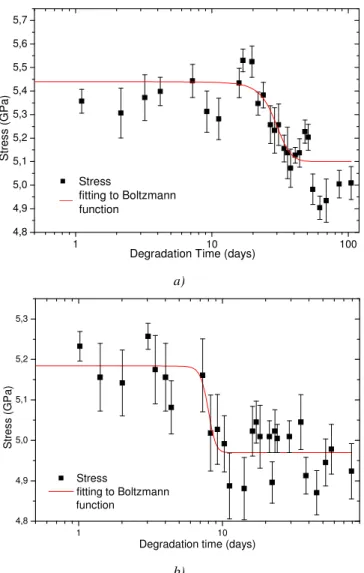
This knee represents the sudden decrease of the optical fiber strength and the transition of its strength to a degradation regime. In order to better understand the stress behavior of aged fibers, the stress values obtained for the two concentrations in study were submitted to a theoretical fit to a Boltzmann function given by equation (4):
2 0 2 1
)
/
)
exp((
1
)
(
A
d
x
x
A
A
y
x+
−
+
−
=
(4)a logarithmic scale to the 35 g/L NaCl and 250g/L concentrated solutions, and the respectively fit to the Boltzmann function. The parameters A1 and A2 are respectively the upper and lower limit of the
fiber stress, x0 is the activation parameter, the dx parameter represent the higher slope of the function, being inversely proportionate to it through the relation (A2-A1)/(4dx).
1 10 100
4,8 4,9 5,0 5,1 5,2 5,3 5,4 5,5 5,6 5,7
Stress
__ fitting to Boltzmann function
S
tr
e
s
s
(
G
P
a
)
Degradation Time (days)
a)
1 10
4,8 4,9 5,0 5,1 5,2 5,3
Stress
fitting to Boltzmann function
S
tr
e
s
s
(
G
P
a
)
Degradation time (days)
b)
Fig. 5: Stress decay for the fibers under NaCl solutions with a concentration of a) 35 g/L and b) 250g/L. The line is the fit to
a Boltzmann function.
The Table I show the Boltzmann fit parameters for the two concentrations under study.
TABLE I:BOLTZMANN FUNCTION FITTING PARAMETERS.
Concentration
(g/L) A1 A2 x0 dx 35 5.44 5.10 29.05 3.95 250 5.18 4.97 7.96 0.47
concentration increases. This means that for higher concentration of NaCl in the water the earlier the fiber “knee” will show up. These sudden increase of the strength degradation rate depends on the ability of the ions in solution to infiltrate the fiber coating, react with the fiber glass surface, and remove the products through the coating [5]. The diffusion of this species through the coating is an important phenomenon on the aging behavior of the optical fiber, because as the solution components diffuse through it, the strength of the fiber correspondingly drops, affecting the lifetime and the reliability of optical fibers.
IV. MICROSCOPY RESULTS
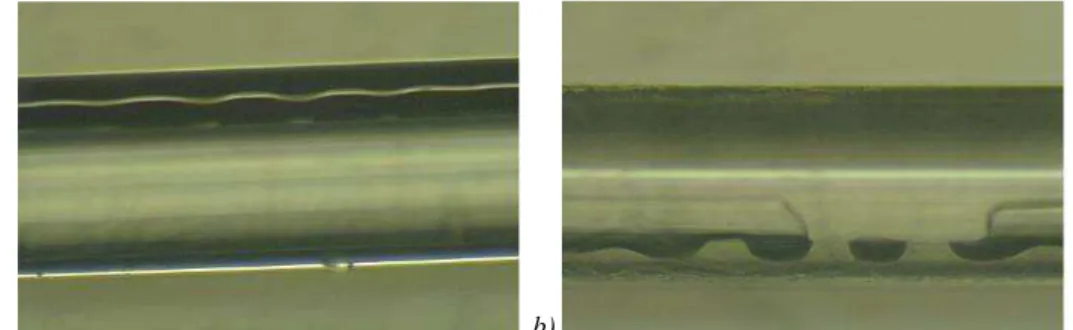
To better understand the result from the mechanical tests, we submitted the tested fibers to optical microscopy and SEM (Scanning Electronic Microscopy) analyzes. In Fig. 6 we present the optical microscopy images, taken with an Olympus BH2 and the digital camera Sony DKC-CM30, for fibers degraded on a 35 g/l NaCl aqueous solution a) during 31 day and b) 105 days. In these images we can see the difference in the protective polymer as consequence of its degradation.
a) b)
Fig. 6: Optical microscopy of optical fibers after degradation on a 35 g/l NaCl solution during a) 31 days and b) 105 days.
Also the samples submitted to stress as described in section II, were then analyzed near the fracture point and in the neighborhood of the fracture, through a SEM observation. The SEM images were obtained with a Hitachi SU-70 apparatus after carbon evaporation. As it can be seen, in Fig.7, even in the surroundings of the fracture point it’s visible the damage induced in the fiber, and for a sample left in the 35g/L solution for 61 days it’s possible to see some splintered area, besides the fracture referred previously.
a) b)
Such result emphasizes the fact that the aqueous solution of NaCl in fact also weakens the acrylate coating in the optical fiber, to the point that the mere contact with a sharper surface may damage it.
V. CONCLUSION
We have studied the effect of the maritime environment, in particular the effect of Sodium Chloride, in the aging of the optical fiber coating. For a typical seashore scenario (35 g of NaCl per liter of water) the value obtained for the optical fiber maximum stress decay rate was of 0.00766±0.00065 GPa/day, and for the death sea scenario (solution with 250g/L of NaCl) the stress decay rate was of 0.01101±0.00133 GPa/day.
In the analyzes of the stress fracture as function of aging time, in a log-time chart, it was possible to see, after some stable aging period, a sudden increase in the strength decay rate (knee). By fitting the experimental points to a Boltzmann function we determinate, through function parameter x0, the time
of appearance of the “knee”. In this way we showed that the higher the NaCl concentration in the aqueous solution the earlier the transition region appears.
From SEM images we also concluded that for long term exposition the NaCl diffuses within the acrylate coating, being responsible for the degradation of the silica optical fiber.
ACKNOWLEDGMENT
M. C. Ferro from Department of Ceramics and Glass Engineering, CICECO, University of Aveiro, is gratefully acknowledged for help in the SEM measurements. The financial support from FCT through FEFOF project is gratefully acknowledged.
REFERENCES
[1] Ad Abel, “Driving the Optical Fiber Future: How the Newest Generation of Fiber Coatings Can Ensure Network Reliability and
Increase Return on Investment”, Proc. FTTH conference, Lisbon, Portugal, February 2010.
[2] Janet L. Mrotek, M. John Matthewson, and Charles R. Kurkjian, “Diffusion of Moisture Through Fatigue-and Aging-Resistant
Polymer Coatings on Lightguide Fibers”, J. Lightwave Technol 21, 1775 (2003).
[3] R. El Abdi, A.D. Rujinski, M. Poulain, I.Severin, “Damage of optical fibers under wet enviroments”, Experimental Mechanics, DOI
10.1007/s11340-009-9310-1, 2009.
[4] J. L. Amstrong, M.J. Matthewson, M.G. Juarez, C. Y. Chou, “The effect of diffusion rates in optical fiber polymer coatings on Aging”,
Proceedings of SPIE, Vol. 3848, pp.62-67, September 1999.
[5] V. M. Thirtha, M. J. Matthewson, C. R. Kurkjian, K. C. Yoon, J. S. Yoon , C. Y. Moon, “Effect of secondary coating on the fatigue