UNIVERSIDADE DE LISBOA
FACULDADE DE CIÊNCIAS
DEPARTAMENTO DE ENGENHARIA GEOGRÁFICA, GEOFÍSICA E ENERGIA
Characterization of particulate emissions from biomass
power plants
João Luís Siopa da Silva
Dissertação de Mestrado
Mestrado Integrado em Engenharia da Energia e do Ambiente
UNIVERSIDADE DE LISBOA
FACULDADE DE CIÊNCIAS
DEPARTAMENTO DE ENGENHARIA GEOGRÁFICA, GEOFÍSICA E ENERGIA
Characterization of particulate emissions from biomass
power plants
João Luís Siopa da Silva
Dissertação de Mestrado orientada pela:
Professora Doutora Helena Lopes (FCUL/LNEG)
Doutora Ana Teresa Crujeira (LNEG)
Mestrado Integrado em Engenharia da Energia e do Ambiente
Master dissertation developed in the scope of Project FCOMP-01-0124-FEDER-019346 – BiomAshTech Impactos da Cinza na Conversão Termoquímica de Biomassa, financed by FEDER Competitiveness Factors Thematic Operational Program – COMPETE and National support through FCT – Fundação para a Ciência e a Tecnologia.
D
EDICATION
To professor Dr. Helena Lopes for the great and fulfilling opportunity that was this project, I truly appreciate it. For the availability and dedication during this period, the long and very educational conversations and the very effective work methods.To Dr. Ana Teresa Crujeira for the warm welcome to the project and for the companionship during the physically-demanding sampling work. For the support and the vast knowledge transmission, that helped the writing of this thesis.
To Dr. Fernanda Guimarães for the great and much useful work with the SEM equipment, at LNEG’s S. Mamede de Infesta Campus. To Dr. Teresa Diamantino for allowing the use of the stereo microscope equipment and to Dr. Teresa Ferraz for the technical support and enthusiasm during the observations.
To Dr. Luis Tarelho for the technical support during the sampling period. To Dr. Paula Teixeira and Márcia Freire M. Sc. for the availability and good will in helping with any task. To David Salema M. Sc. for the technical support with the TESTO analyser and with its data interpretation, and also the productive technical discussions.
To Dr. Ascensão Trancoso for the interesting conversations, suggestions, support and enthusiasm. To my dear friends from MIEEA 2008, this was an amazing adventure and the best part was having you around.
To my much loved friends Carolina, Joana, José, Liliana, Manuela, Mónica, Rafael, Raisa and Ricardo. I can only be grateful for having you in my life. Thank you, always.
To my parents, Bentes and Belinha, the unconditional supporters in everything I choose in my life; my grandparents, Fonseca and Cândida, my greatest inspiration and the legacy I stand for and; my brother Pedro for everything you taught me.
A
CKNOWLEDGMENTS
&
F
RAMEWORK
BiomAshTech is a project headed by University of Aveiro, Portugal, with participation of LNEG – Laboratório Nacional de Energia e Geologia, with Helena Lopes PhD as principal Investigator. The project focuses on the study of the inorganic material behaviour from various types of national biomass, in order to control the pollutant emissions and formation of problematic ashes in combustion systems.This subject selection for my Master’s Dissertation came from my increasing interest in the areas of the combustion technologies and biomass and waste energy. Interest that was developed during my academic course in Lisbon (FCUL) and in Germany (FH Aachen), during an Erasmus year, and also as an intern at the Electricity Museum in Lisbon. The opportunity to work at an industrial unit was also crucial on my decision.
The present document is the result of the work developed during an internship at LNEG, in order to achieve the Master Degree in Environmental and Energy Engineering from Faculty of Sciences of University of Lisbon – FCUL. The internship was held under the supervision of Professor Helena Lopes PhD (FCUL/LNEG) and Ana Teresa Crujeira PhD (LNEG).
The objective of this internship focused on characterization of emitted particles in the flue gas from an Industrial biomass-fired power plant, with later chemical and morphologic analyses of the samples. Pollutant emissions during combustion were also studied.
The activities developed can be summarized in:
1. Bibliographic research on particles emissions from biomass-fired combustion systems 2. Training in stationary source emissions sampling;
3. Training in particle chemical and morphological characterization; 4. Particle sampling at an Industrial unit stack’s external platform; 5. Particle samples chemical and morphological characterization;
A
BSTRACT
The efforts for energy sector decarbonisation led to the increase of biomass consumption, considered as a low GHG emissions fuel. Besides the low carbon emissions, also NOx and SO2 emissions can be reduced in fluidized bed (FB) combustion system, respectively, ca 83 % and 90 % of reduction can be achieved. This happens due to the biomasses composition and the FB systems characteristics, therefore the biomass-fired PP only need a fly-ash/particle removal system, usually an electrostatic precipitator (ESP).The bio-advantage of the biomass as fuel is confronted if some drawbacks, such as the high water and inorganic (ashes) content. Also, the possible presence of significant chlorine content from the fuel may result in relevant HCl emissions, possibly raising the need for an ELV legislation to control Cl base pollutants from biomass combustion systems.
The present work focused on the emitted particulate matter, particulate size distribution, constitution and morphology at a Portuguese medium combustion biomass-fired plant (between 20 MWth and 50 MWth). The methods used were: Total Suspended Particulate (EN 13284-1:2009), Particulate Granulometric Classification (Mark III user’s manual, based on the U.S. EPA Method 5) and PM10/2,5 (EN ISO 23210:2009). Particles collected were observed using Microprobe/SEM for morphology and composition.
Finer particles, with aerodynamic diameters below 10 µm, presented chlorine (Cl) and also a high alkali content, namely of Calcium (Ca), Potassium (K) and Sodium (Na), with fuel’s origin, as well as Silica (Si), a consequence of soil and stone contamination in addition to fuel’s origin and sand from the fluidized bed system. For the submicron (ranges below 0,43 µm) lead (Pb), a highly toxic heavy metal for the human health, was detected in discrete forms, despite the low amounts usually present in the biomass used in the power plant.
R
ESUMO
Os esforços para a descarbonização do sector energético levaram a aumento do consumo de biomassa, considerado um combustível com baixas emissões de gases com efeito de estufa. Para além das baixas emissões de carbono, também as emissões de NOx e SO2 podem ser reduzidas em sistemas combustão de leito fluidizado (LF), respetivamente, ca 83 % e 90 % de redução podem ser atingidos. Facto relacionado com a composição das biomassas e com as características do sistema LF, assim, as centrais a biomassa apenas necessitam de sistemas para remoção de partículas, normalmente percipitadores electroestáticos (ESP).A bio-vantagem da biomassa como combustível é confrontada com alguns problemas como o alto conteúdo em água e o conteúdo inorgânico (cinzas). Também, a possível presença significativa de cloro do combustível pode resultar em emissões de HCl relevantes, possivelmente levando à necessidade de criação de legislação, valores de emissões limite, para controlar poluentes com origem em Cl nos sistemas de combustão a biomassa.
O presente trabalho focou-se no material particulado emitido, a distribuição de diâmetros das partículas, a consituiçao e morfologia numa central portuguesa de média dimensão a biomassa (entre 20 MWth e 50 MWth). Os métodos utilizados foram: Partículas Totais em Suspensão (EN 13284-1:2009), Classificação Granulométrica de Partículas (Manual de utilizador do Mark III, baseado no Método 5 da EPA) e PM10/2,5 (EN ISO 23210:2009). As partículas coletadas foram observadas utilizando microssonda/SEM para morfologia e composição.
Partículas finas, com diâmetros aerodinâmicos inferiores a 10 µm, apresentaram Cl e também um alto conteúdo alcalino, nomeadamente de Cálcio (Ca), Potássio (K) e Sódio (Na), com origem no combustível, bem como Sílica (Si), uma consequência de contaminação por solo e rochas, em adição à origem do combustível e areia do sistema LF. Para a partículas submicrónicas (inferiores a 0,43 µm) Chumbo (Pb), um metal pesado altamente tóxico para a saúde humana, foi detetado de forma discreta, apesar das pequenas quantidades normalmente apresentada na biomassa usada na central. PALAVRAS-CHAVE: Combustão de biomassa; Poluentes da combustão; Emissão de material particulado; PM10/2,5.
Contents
Dedication ... iv
Acknowledgments & Framework ... vi
Abstract ... viii
Resumo ...x
Contents ... ii
Abbreviations & Symbols ... iv
List of Figures ... viii
List of Tables ...x
1 INTRODUCTION ... 2
1.1 BIOMASS TO ENERGY ... 3
1.1.1 SECTOR CHARACTERIZATION ... 4
1.1.2 SOLID BIOFUEL CHARACTERISTICS ... 6
1.1.3 SOLID BIOFUEL COMBUSTION ... 10
1.2 COMBUSTION TECHNOLOGIES... 11
1.2.1 FLUIDIZED BED BOILER ... 14
1.3 EMISSIONS FROM BIOMASS COMBUSTION ... 17
1.3.1 LEGAL FRAMEWORK ... 17
1.3.2 CO EMISSIONS ... 19
1.3.3 NOX EMISSIONS ... 20
1.3.4 CHLORINE EMISSIONS ... 21
1.3.5 SOX EMISSIONS ... 22
1.3.6 PARTICULATE MATTER EMISSIONS,PM10/2,5 ... 23
1.4 PARTICLE CLEANING TECHNOLOGIES ... 27
1.4.1 CYCLONES ... 27
1.4.2 DRY ELECTROSTATIC PRECIPITATORS ... 28
1.4.3 FABRIC FILTERS OR BAGHOUSE FILTERS ... 29
1.4.4 SCRUBBERS ... 29
2.1 POWER PLANT CHARACTERIZATION ... 34
2.2 BIOMASS CHARACTERIZATION ... 35
2.3 FLUE GAS CHARACTERIZATION ... 38
2.3.1 SAMPLING AREA LOCATION ... 42
2.3.2 SAMPLING POINTS ... 43
2.3.3 CO,CO2,O2,SO2,NOX ANALYSIS... 44
2.3.4 VELOCITY AND VOLUMETRIC FLOW RATE OF FLUE GAS ... 45
2.3.5 MOLECULAR WEIGHT ... 47
2.3.6 MOISTURE ... 47
2.3.7 TOTAL SUSPENDED PARTICLES ... 48
2.3.8 PARTICULATE GRANULOMETRIC CLASSIFICATION ... 49
2.3.9 PM10/2,5 ... 52
2.3.10 HCL EMISSIONS ... 54
2.4 SAMPLING PERIODS ... 54
2.5 POWER PLANT OPERATION ... 55
2.6 PARTICLES CHARACTERIZATION ... 57
3 RESULTS & DISCUSSION ... 60
3.1 EMISSIONS CHARACTERIZATION ... 60
3.2 TOTAL SUSPENDED PARTICLES ... 66
3.2.1 TSPSEM/EDS ANALYSIS ... 67 3.3 PARTICULATE CLASSIFICATION ... 69 3.3.1 PM10/2,5 ... 69 3.3.2 PGC ... 72 4 CONCLUSIONS ... 80 5 REFERENCES ... 82
A
BBREVIATIONS
&
S
YMBOLS
acfm Actual cubic feet per minute
BAT Best Available Technology
BFB Bubbling Fluidized Bed
CAFE Ambient air quality and Cleaner Air For Europe CEMS Continuous Emission Monitoring System CFB Circulating Fluidized Bed
CHP Combined Heat and Power
d.b. Dry basis
D-ESP Dry Electrostatic Precipitator EPA U.S. Environmental Protection Agency ESP Electrostatic Precipitator
FB Fluidized Bed
FIT Feed-In Tariff
GHG Green House Gases
IED Industrial Emissions Directive
IPPC Integrated Pollution Prevention and Control LCP Large Combustion Plant Directive
LHV Low Heating Value
LRTAP Long Range Transboundary Air Pollution
MCP Medium Combustion Plant Directive
NDIR Non-dispersive infrared
Nm3 Volume at standard conditions for temperature and pressure NREAP National Renewable Energy Action Plan
OECD Organisation for Economic Co-operation and Development PCCD/F Dioxins/Furans
PGC Particulate Granulometric Classification
PM Particulate Matter
PM10/2,5 Particulate Matter with 10 µm and 2,5 µm aerodynamic diameter
PP Power Plant
SEM Scanning Electron Microscopy
TSP Total Suspended Particles
SRC Selective Catalytic Reduction
vol% Volume percentage
W-ESP Wet Electrostatic Precipitator
w.b. Wet basis
WID Waste Incineration Directive
C (129 m/s (kg/kmol K)1/2)
Cavg – average concentration during sampling period (mg/Nm3)
𝐶𝑐ℎ𝑙𝑜𝑟𝑖𝑑𝑒𝑠(𝐻𝐶𝑙) – Mass concentration of gaseous chlorides at standard conditions of temperature and pressure (mg/Nm3)
Cref – Reference oxygen content concentration (mg/Nm3)
cs – Particles concentration (mg/Nm3)
I – Isokinetic sampling (%)
K; Cp – Type S Pitot tube coefficient, dimensionless (0,85)
K4 (0,003454 (mmHg m3)/(mL K) )
Kp –Velocity equation constant (method 2) (34,97 m/s[(g/mol)(mm Hg)]/[(K)(mm H2O)]1/2)
KHCl – 1,028 ((µg HCl/µg-mole)/(µg Cl -/µg-mol))
Md – Molecular weight of stack gas, dry basis (g/g-mol)
MHCl – Molecular weight of HCl (36,46 g/g-mol)
MCl- Molecular weight of Cl (35,45 g/g-mol)
Ms – Molecular weight of stack gas, wet basis (g/g-mol)
Mw – Molecular weight of water (18,0 g/g-mol)
𝑚𝑐ℎ𝑙𝑜𝑟𝑖𝑑𝑒𝑠– Mas concentration of gaseous chlorides collected in the sample absorption solution (mg) 𝑚𝑝– Particles mass (mg)
𝑚𝑤𝑐 – Mass of water vapour collected in the trapping unit (g)
O2 ref – reference oxygen content (%)
O2 avg – average reference oxygen content (%)
Pbar – Barometric pressure at measurement site (mmHg)
Pg –Stack static pressure (mmHg)
pe; Ps – Absolute stack pressure, Pbar + Pg (kPa; mmHg)
pstd; Pstd – Standard absolute pressure (101,3 kPa; 760 mmHg)
Qs – Particles mass flow (kg/h)
qvr; Qsd – Dry volumetric stack gas flow rate corrected to standard conditions (m3/s; m3/h)
R – Ideal gas constant (0,06236 (mmHg m3)/(g-mol K) )
Tm – Absolute temperature at meter (K)
Ts –Stack temperature (K)
Tstd – Standard absolute temperature (273,15 K)
Vm; (V2 -V1) – Dry gas volume measured by dry gas meter (m3, dcm)
Vmol(std) - Molar volume at standard conditions (22,4x10⁻³ m3/mol at pstdand Tstd)
Vw(std) – Volume of water vapour condensed, corrected to standard conditions (m3, scm)
Vwc(g/m3) – Water vapour content on dry basis (g/m3)
Vwc(%);Bws – Water vapour in the gas stream (%) 𝑣̅ ; 𝑣𝑠– Average stack gas velocity (m/s)
𝑣𝑎– Velocity of the gas entering the sampling nozzle (m/s) 𝑣𝑁– Velocity of the in the duct at the sampling point (m/s)
Y – Dry gas meter calibration factor (1)
H – Samples gas pressure differential across the orifice (mmH2O)
p; P – Pressure differential across the S-type pitot tube (mmH2O)
- Sampling time (min)
ρw – Density of water (0,9982 g/mL) %𝑒𝑎𝑖𝑟 – Excess Air
L
IST OF
F
IGURES
FIGURE 1–MAIN COMBUSTION TECHNOLOGIES FOR BIOMASS (ADAPTED FROM VAN LOO ET AL.(2010)) ... 13
FIGURE 2–(A)CIRCULATING FLUIDIZED BED,(B)BUBBLING FLUIDIZED BED (ADAPTED FROM VAN LOO ET AL.(2010))... 15
FIGURE 3-ASH FORMATION DURING BIOMASS COMBUSTION (ADAPTED FROM OBERNBERGER (2005)) ... 24
FIGURE 4-PARTICLES CONCENTRATION DISTRIBUTION BY DIAMETER (ADAPTED FROM SLOSS ET AL.(2000)) ... 25
FIGURE 5–PM10/2,5 PARTICLES SIZE COMPARISONS WITH SAND AND HAIR ... 26
FIGURE 6–INDUSTRIAL UNIT SCHEME (ADAPTED FROM TARELHO ET AL.(2013)) ... 35
FIGURE 7–BIOMASS SAMPLES FROM THE INDUSTRIAL UNIT.(A) AND (C)PINE;(B)EUCALYPTUS,(D)MIXTURES ... 36
FIGURE 8–SCHEMATIC REPRESENTATION OF THE FLUE GAS CHARACTERIZATION PROCEDURE ... 40
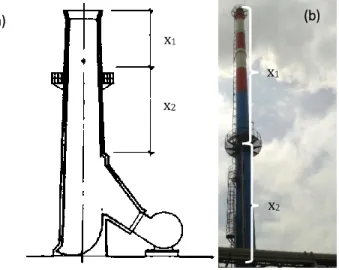
FIGURE 9–SAMPLING AREA LOCATION:(A)SCHEMATIC REPRESENTATION,(B)ON SITE LOCATION ... 42
FIGURE 10-(A)RISING MATERIAL TO SAMPLING SITE,(B)MATERIAL ARRANGEMENT TO BE ATTACHED TO RAISING CABLE ... 43
FIGURE 11 -STACK SAMPLING POINTS LOCATION INSIDE THE STACK, SCHEMATIC REPRESENTATION... 44
FIGURE 12-SAMPLING TRAIN SCHEMATIC REPRESENTATION (ADAPTED FROM (EPA5)) ... 46
FIGURE 13–SAMPLING TRAIN:(A)1PROBE,2HEATED AREA,3ICE BATH,4UMBILICAL CORD (B)CONTROL UNIT ... 46
FIGURE 14–FLUE GAS SAMPLING SCHEMATIC REPRESENTATION:(A) ISOKINETIC,(B) OVER-ISOKINETIC,(C) UNDER-ISOKINETIC ... 48
FIGURE 15–MARK III IMPACTOR, SCHEMATIC REPRESENTATION (ADAPTED FROM SALEMA (2008)) ... 50
FIGURE 16-MARK III ATTACHED TO THE SAMPLING TRAIN, SCHEMATIC REPRESENTATION (ADAPTED FROM THE MARKIIIUSER MANUAL) 50 FIGURE 17–PRINCIPLE OF IMPACTION (ADAPTED FROM NPISO23210(2009)) ... 51
FIGURE 18–TECORAMSSI IMPACTOR, SCHEMATIC REPRESENTATION (ADAPTED FROM TECORA(2015)) ... 52
FIGURE 19-TECORAMSSI ATTACHED TO SAMPLING TRAIN, SCHEMATIC REPRESENTATION (ADAPTED FROM (NPISO23210,2009)) 53 FIGURE 20–IMPACTORS:(1)TECORAMSSI,(2)MARK III ... 54
FIGURE 21–FB TEMPERATURE AND ESP VOLTAGE PROFILES DURING SAMPLING PERIODS ... 56
FIGURE 22–SCANNING ELECTRON MICROSCOPY EQUIPMENT (JXA-8500F) ... 57
FIGURE 23–SAMPLES ASSEMBLY FOR SEM ANALYSIS ... 58
FIGURE 24-DAY A:O2,CO,NOX AND SO2EMISSIONS (CEMS DATA) ... 62
FIGURE 25-DAY B:O2,CO,NOX AND SO2EMISSIONS (CEMS DATA) ... 62
FIGURE 27–(A)O2 AND CO EMISSIONS PROFILE FOR DAY A;(B)O2 AND CO EMISSIONS PROFILE FOR DAY A- DETAIL ... 65
FIGURE 28–FILTERS WITH PARTICLES OF SAMPLING GA(MARK III),PMA(TECORAMSSI) AND PTSB(TSP) ... 66
FIGURE 29-TSP SAMPLES SEM ANALYSIS ... 68
FIGURE 30-PARTICLE PYRAMID FROM PMA_2 SAMPLE ... 70
FIGURE 31-PM10/2,5 SAMPLE SEM ANALYSIS ... 71
FIGURE 32–CUT-OFF DIAMETER VARIATION BY STAGE (MARK III), DUE TO SAMPLE FLOW VARIATIONS ... 72
FIGURE 33–PGC SAMPLE MASS FREQUENCY AND CUMULATIVE FREQUENCY, BY IMPACTOR STAGE ... 73
L
IST OF
T
ABLES
TABLE 1–BIOMASS-FIRED PLANTS IN PORTUGAL (ADAPTED FROM E2P (INEGI)) ... 5 TABLE 2–BIOMASSES CHARACTERIZATION, TYPICAL MEAN VALUES (ADAPTED FROM ISO14961(2005)) ... 8 TABLE 3–EMISSION LIMIT VALUES (MG/NM3)FOR BIOMASS COMBUSTION, IN EUROPE AND PORTUGAL ... 19 TABLE 4–COMPARISON OF MAJOR PARTICLE CLEANING TECHNOLOGIES (ADAPTED FROM SINGH ET AL.(2014)). ... 32 TABLE 5-BIOMASS CHARACTERIZATION FROM FBINDUSTRIAL UNIT (ADAPTED FROM LOPES (2013))... 36 TABLE 6–FLUE GAS SAMPLING METHODS ... 39 TABLE 7–EQUATIONS USED FOR STACK SAMPLING ... 41 TABLE 8–STACK SAMPLING POINTS DISTANCE FROM ACCESS PORT ... 44 TABLE 9–SAMPLE’S NOMENCLATURE ... 55 TABLE 10–FLUE GAS O2,CO2,CO,NOX,SO2,HCL AND MOISTURE CONCENTRATIONS, AND OTHER MEASURED PARAMETERS . 60
TABLE 11–MAXIMUM THEORETICAL GASEOUS AND HCL EMISSIONS, AND FLUE GAS MOISTURE ... 61 TABLE 12-FLUE GAS O2,CO,NOX, AND SO2RANGES (CEMS DATA) ... 63
TABLE 13-TSP SAMPLED CONCENTRATION... 67 TABLE 14-PGC AERODYNAMIC DIAMETERS AND CONCENTRATIONS FOR EACH IMPACTOR STAGE ... 74
1 INTRODUCTION
Emissions of greenhouse gases have been a major worldwide concern due to increasing population and consequent increasing of industries and energy consumption so satisfy its needs. The energy sector is considered to be the largest source of carbon dioxide into the atmosphere, due to use of fossil fuels in transportation, heat and power generation for a wide range of industrial processes (pulp and paper, concrete industries among other). Therefore, major concerns regarding energy efficiency, sustainability and renewable energy have been increasing, straightening the energy area with the environmental science.The European Union has been a great supporter of renewable energies, through strategic energy plans and policies, and established concrete targets for exploitation of indigenous renewable energy sources, and for bioenergy in particular. The 2020 climate and energy package, also known as the Packet 20-20-20, from 2008, aims for a 20 % reduction in EU greenhouse gas emissions from 1990 levels, raising the share of EU energy consumption produced from renewable resources to 20 % and a 20 % improvement in the EU's energy efficiency (EC, 2015).
Committed to reducing greenhouse gas emissions from 80 % to 95% below 1990 levels by 2050, the EU is exploring new challenges of decarbonisation, based on the Energy Roadmap 2050 (EC, 2011) . Among the proposed solutions is the decrease of coal share in energy production using co-firing with biomass.
Biomass is as a good alternative energy supplier, mainly because its net CO2 emissions are much less than those of fossil fuels. It is a versatile fuel, being used for power and heat generation and also to produce biofuels for the transportation sector. It is also an indigenous renewable energy source, with great storage advantages.
These reasons are making biomass combustion more and more attractive. However, the adverse health effects of fine particles, among other drawbacks, have become an important issue and fine particle emissions from biomass combustion are considered to be one of the major sources. The inorganic content of biomass present a great problem for combustion systems, which leads to important research area, with the aim to achieve good environmental performance of solid biofuels utilization for energy, since the new plant construction and the conversions of coal-fired power plants will one of the main solid biomass energy development priority for the years to come (EurObserv'ER, 2013).
1.1 BIOMASS TO ENERGY
The Directive on the promotion of the use of energy from renewable sources (Directive 2009/28/EC) define Biomass as the biodegradable fraction of products, waste and residues from biological origin from agriculture (including vegetal and animal substances), forestry and related industries, fisheries and aquaculture, as well as the biodegradable fraction of industrial and municipal waste.
In industrialized countries biomass contributes, on average, from 9 % to 14 % of the total energy supply, but in developing countries this can get as high as one-fifth to one-third, due to domestic uses such as cooking and heating (Khan et al., 2009).
As a fuel, biomass is used in a wide range of applications: small-scale stoves, large-scale boilers, large heating plants, etc. It is also used in cogeneration plants to produce both electricity and heat – Combined Heat and Power (CHP) plant – with average efficiency from 75 % to 90 % (BAT, 2006). Combustion is the most important and mature technology available for biomass utilization, either for heat or electricity production (Nussbaumer, 2003).
According to OECD (1991), “CO2 emissions resulting from bioenergy consumption should not be included in a country’s official emission inventory”, considering that the biomass converted into energy consumed CO2 during its life. This is still the most commonly used approach for bioenergy systems life cycle assessments, although nowadays other approaches, considering greenhouse gases emissions have been discussed (Cherubini et al., 2011).
1.1.1 SECTOR CHARACTERIZATION
The European continent counted a wood supply of around 24 144 million m3 in 2008 (Alakangas et
al., 2012). The largest flows of wood are used in mechanical, semi-mechanical and chemical pulp
industry, sawn timber and fibre and particle board industry. In each of these industries there is a large share in energetic use of wood, used as solid biofuel or black liquor.
In the scope of the renewable sources promotion in a new energy policy, in 2005 the European Union (EU) presented the Biomass Action Plan (EC, 2005). When the plan was released, biomass met 4 % of the EU’s energy needs – 69 Mtoe – and the aim was to increase its use to around 150 Mtoe by 2010. The Directive 2009/28/EC on the promotion of the use of energy from renewable sources stablishes the target of, at least, 20 % for the share of energy from renewable sources in the gross final consumption of energy in the year 2020. Each member state should adopt a national renewable energy action plan in order to meet these targets. This target is in line with the overall Target 20-20-20 for the EU.
Solid and gaseous biomass used for electricity, heating and cooling production constitutes the biggest source of renewable energy in the EU. According to estimates from the National Renewable Energy Action Plan (NREAP), it is expected to further increase from 86,5 Mtoe in 2012 up to 110,5 Mtoe in 2020.
Solid biomass use for heat and electricity production has increased at an annual rate of 3,8 % since the year 2000 rising to a total of 82,3 Mtoe by 2012. The bioelectricity output reached 79,5 TWh in 2012, with 26,5 TWh coming from PP only and 53,1 TWh from CHP plants (EurObserv'ER, 2013). Wide-scale expansion of bioelectricity production and cogeneration, through new plant construction or the conversion of coal-fired PPs, will be the main solid biomass energy development priority for the years to come.
Focusing on the Portuguese territory, 38 % is covered by forest, presenting an available forest biomass potential of around 2,2 million ton/year (Marques, 2013). Portugal is a country where the wood, cork, paper industry and agricultural activities have a major role in the economy. From these industries a great amount of residues are obtain from the various production steps.
The energy policy stated by the Energetic National Strategy of 2005 (Plano Nacional para a Energia –
valorisation chapter, the objective was to increase the power capacity as well as to adopt new forestry biomass valorisation measures, cooperating with the wood and the paper & pulp industries. In order to increase the power capacity, in 2006 a project to build fifteen new forestry biomass PPs with a total power of 100 MW until 2010 was planned. To prompt this plan a favourable feed-in tariff (FIT) was established, around 109 €/MWh, for the energy generated in forest biomass PPs.
The plan was unsuccessful, with only two of the biomass PP built (Termoeléctrica de Belmonte and
Termoeléctrica da PALSER). Some of the appointed reasons for the failure were bad PP’s location,
high resource price (when analysed against the available tariff), resource supply issues, logistics and availability in the process.
However, externally to this plan, between 2007 and 2009, five new biomass PP with a total capacity of 78 MW were built in Portugal. By 2011 the FIT for forest biomass was set to be 119 €/MWh. The FIT is guaranteed for a period of 15 years, or for an amount of 33 GWh/MW capacity installed. Existing industrial CHP and PP, using biomass as fuel, are summarized in Table 1.
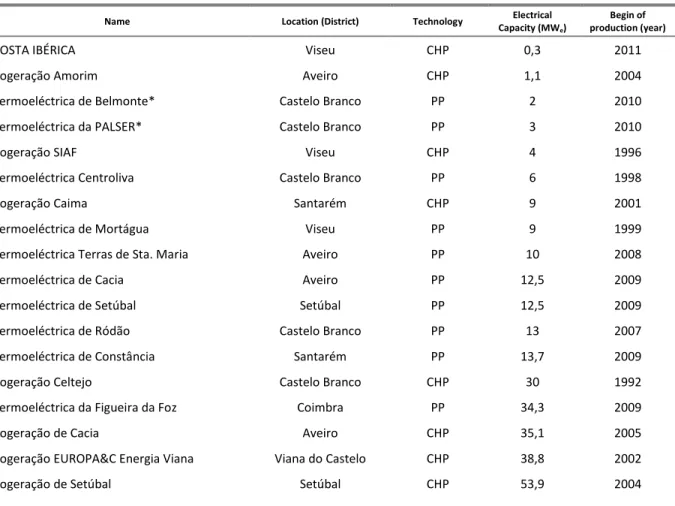
Table 1 – Biomass-fired Plants in Portugal (adapted from e2p (INEGI))
Name Location (District) Technology Electrical
Capacity (MWe)
Begin of production (year)
COSTA IBÉRICA Viseu CHP 0,3 2011
Cogeração Amorim Aveiro CHP 1,1 2004
Termoeléctrica de Belmonte* Castelo Branco PP 2 2010
Termoeléctrica da PALSER* Castelo Branco PP 3 2010
Cogeração SIAF Viseu CHP 4 1996
Termoeléctrica Centroliva Castelo Branco PP 6 1998
Cogeração Caima Santarém CHP 9 2001
Termoeléctrica de Mortágua Viseu PP 9 1999
Termoeléctrica Terras de Sta. Maria Aveiro PP 10 2008
Termoeléctrica de Cacia Aveiro PP 12,5 2009
Termoeléctrica de Setúbal Setúbal PP 12,5 2009
Termoeléctrica de Ródão Castelo Branco PP 13 2007
Termoeléctrica de Constância Santarém PP 13,7 2009
Cogeração Celtejo Castelo Branco CHP 30 1992
Termoeléctrica da Figueira da Foz Coimbra PP 34,3 2009
Cogeração de Cacia Aveiro CHP 35,1 2005
Cogeração EUROPA&C Energia Viana Viana do Castelo CHP 38,8 2002
Name Location (District) Technology Electrical Capacity (MWe)
Begin of production (year)
Cogeração Celbi Coimbra CHP 70 1987
Cogeração da Figueira da Foz (Lavos) Coimbra CHP 95 2004
*from the 2006 Plan
The Portuguese target for the share of energy from all renewable sources in gross final consumption of energy should be 31 % for the year 2020 (PNAER, 2009). The projected NREAP share in that year exactly matches the target. Based on the projection, the most important contribution is expected from biomass with 2 322 ktoe (1 484 ktoe from solid biomass), accounting for 38 % of all renewable energy.
Biomass accounted 55 % of all renewable energy share in the primary energy production in Portugal in 2012 (DGEG, 2014). Also, the primary energy production of solid biomass reached 2,342 Mtoe (EurObserv'ER, 2013).
In Portugal the gross electricity production from biomass in 2013 reached 2 516 GWh, with 1 780 GWh of that production coming from CHP and 736 GWh from PP, from a total electrical capacity of around 426 MWe (DGEG, 2014). The Portuguese NREAP aims for a total electrical capacity of 958 MWe by 2020, with 436 MWe coming from systems with cogeneration, to increase energy production efficiency.
The increasing demand of biomass to energy must be satisfied by a diversified set of existing biomass feedstocks not currently used because they are often considered of low quality (wastes from agricultural, agro industrial and forestry activities). However, these practices will have to be hand-to-hand with sustainable management of biomass natural resources to be used as solid biofuels.
1.1.2 SOLID BIOFUEL CHARACTERISTICS
Biomass energy resources are diverse and therefore a comprehensive classification system was created, in order to predict its behaviour by identifying to which class belongs and also establishing rules for managing and utilization. The classification can be based in the following concepts: (1) the biomass origin – primary, secondary and tertiary residues and energy crops (Williams, 1992); (2) the biomass properties – wood and woody fuel, herbaceous fuels, wastes, derives, aquatic and energy crops (Jenkins et al., 1998); (3) International Standard for Solid biofuels – Fuel specifications and classes (ISO14961, 2005)– woody biomass, herbaceous biomass, fruit biomass, blend and mixtures.
Biomass composition includes cellulose, hemicelluloses, lignin, lipids, proteins, simple sugars, starches, water, hydrocarbon, ash (inorganic compounds), and other compounds. The concentration of each class of compounds varies depending on specie, type of plant tissue, stage of growth, and growing conditions. These concentrations influence the combustion performance and the characteristics related with quantity and chemical composition of the ashes produced during thermochemical conversion of biomass to energy at power plants.
Biomass offers important advantages as a combustion feedstock due to the high volatility of the fuel and the high reactivity of both the fuel and the resulting char.
The bulk composition of biomass in terms of carbon, hydrogen, and oxygen (CHO) does not differ much among different biomass sources. Typical (dry base) weight percentages for C, H, and O are 30 % to 60 %, 5 % to 6 %, and 30 % to 45 %, respectively (Jenkins et al., 1998). Nitrogen, sulphur and chlorine can also be found in quantities usually less than 1%, but occasionally well above depending on the biomass type. When compared to coal, biomass presents higher share of moisture, ashes, oxygen, nitrogen, silicon, potassium; low heating value (LHV)– generally from 18 to 21 MJ/kg (dry base) – and less carbon, aluminium and iron contents.
The wood and woody materials tend to be low in nitrogen, chlorine and ash content, whereas the agricultural Biomass residues, generally herbaceous biomass, can have higher content of these components (Obernberger et al., 2006).
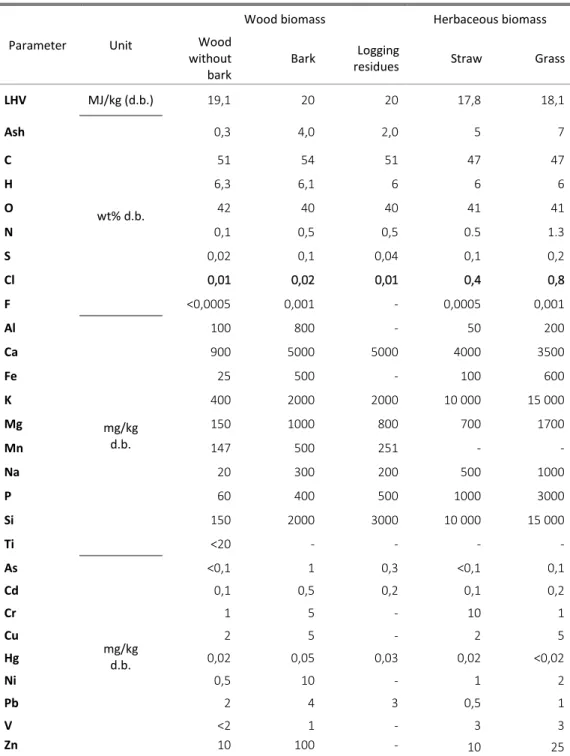
A comparison of various wood and herbaceous biomass compositions is summarized in Table 2, presenting typical guiding values for ash, LHV and element concentrations of several biomass species.
Table 2 –Biomasses characterization, typical mean values (adapted from ISO14961 (2005))
(LHV – Low Heating Value; d.b. - dry basis; wt% - weight percentage)
Parameter Unit
Wood biomass Herbaceous biomass
Wood without bark
Bark Logging
residues Straw Grass
LHV MJ/kg (d.b.) 19,1 20 20 17,8 18,1 Ash wt% d.b. 0,3 4,0 2,0 5 7 C 51 54 51 47 47 H 6,3 6,1 6 6 6 O 42 40 40 41 41 N 0,1 0,5 0,5 0.5 1.3 S 0,02 0,1 0,04 0,1 0,2 Cl 0,01 0,02 0,01 0,4 0,8 F <0,0005 0,001 - 0,0005 0,001 Al mg/kg d.b. 100 800 - 50 200 Ca 900 5000 5000 4000 3500 Fe 25 500 - 100 600 K 400 2000 2000 10 000 15 000 Mg 150 1000 800 700 1700 Mn 147 500 251 - - Na 20 300 200 500 1000 P 60 400 500 1000 3000 Si 150 2000 3000 10 000 15 000 Ti <20 - - - - As mg/kg d.b. <0,1 1 0,3 <0,1 0,1 Cd 0,1 0,5 0,2 0,1 0,2 Cr 1 5 - 10 1 Cu 2 5 - 2 5 Hg 0,02 0,05 0,03 0,02 <0,02 Ni 0,5 10 - 1 2 Pb 2 4 3 0,5 1 V <2 1 - 3 3 Zn 10 100 - 10 25
Wood by-products and wood residues, from industrial production when chemically treated, with wood preservatives or coating, can raise the amount of heavy metals or halogenated organic compounds (ISO14961, 2005).
Ash contents in solid biofuels is one of the main technical challenges for combustion systems, since they may present low melting temperature and sintering tendency due to its high alkali content (especially K), together with chlorine content of biomass (Khan et al., 2009). This is relevant in some woody biomass residues and herbaceous or fruit residues and may lead to problems in the systems such as: fouling, deposition, corrosion, slagging and agglomeration.
Slagging is the formation of molten or partially fused deposits on furnace walls or convection surfaces exposed to radiant heat. Fouling consists on the formation of layered deposits on convection heat surfaces such as superheater and reheaters. These deposits reduce the heat transfer and thus the efficiency of combustion units and can lead to plant shutdown for deposits removal and boiler cleaning (Lin et al., 2003). Furthermore, deposits can be corrosive and may thus reduce the lifetime of the installations.
Agglomeration happens in the Fluidized Bed (FB) systems’ bed, between the ashes and the material used in the bed (usually silica sand) which bond and reduce the bed’s fluidization. In extreme cases this may lead to unscheduled shutdown of the system (Khan et al., 2009).
Ashes are constituted by the inorganic non-combustible part of the fuel (essentially Al, Ca, Mg, K, Na, Fe) or from contamination – with soil, sand or stones. Therefore, the origin of phases in biomass ash is defined in three classes: Primary ashes are the original phases or minerals that come from natural processes, during the biomass living time. Their fibre structure contains Si and Ca, while K, P, S, Zn present as micro or macro nutrients; Secondary ashes result from the anthropogenic activity, regarding its new phase’s generation by solid, liquid and gas reactions among pre-existing and newly formed compounds, during biomass combustion in the appropriate installations; Tertiary ashes result from natural processes, weathering, during transport and storage of combustion residues (Vassilev
et al., 2013).
Moisture content of biomass may range from 10 % to 70 %, the higher its content is, the lower its heating value. Flue gas volume produced per energy unit increases with moisture increase, requiring larger flue gas treatment equipment. Also, high moisture in solid biofuels can cause ignition and combustion instability.
In Portugal the most common type of solid biofuel used in PP are a variety of forest biomass residues from forestry related activities (Tarelho et al., 2011). It consists mainly in material from eucalyptus (Eucalyptus globulus) and pine (Pinus pinaster) processing. This fuel may contain a significant amount
(can be as high as 25wt%) of inertial material – soil particles and stones from the forest – mixed, which can result from bad management practices in the forest during harvesting and biomass management operations.
1.1.3 SOLID BIOFUEL COMBUSTION
Combustion is defined as the rapid chemical combination of oxygen with the combustible elements of a fuel, consisting of consecutive heterogeneous and homogenous reactions, leading to the release of heat and final products.
Biomass combustion is a complex process which depends both on the fuel properties and the combustion application. The combustion process of solid fuels can be specified into the following main stages: drying, pyrolysis/gasification and oxidation (Nussbaumer, 2003).
The drying process consists in the evapouration of the moisture present in the fuel at temperatures around 100 ˚C. This endothermic reaction, evapouration, consumes part of the energy released in the combustion process, meaning that the amount of moisture in the fuel can influence the efficiency of the combustion process.
With temperature rising, between 200 ˚C and 400 ˚C, fuel suffers a thermal degradation – devolatilisation. Volatile organic matter is released from the biomass, mainly CO, CO2 and H2O, as well as pyrolytic products, mainly tar, leading to a slow loss of weight of the fuel material.
The remaining solid material of the fuel – charcoal – and the released volatiles are oxidised, while the temperature rises above 400 ˚C.Ideal combustion results in the maximum heat release from the fuel, minimizing losses from inefficient combustion, normally due to incomplete combustion and to deficient supply of air (oxygen).Hence, a good combustion process is accomplished by controlling the "three T's" of combustion which are (1) Temperature high enough to ignite and maintain ignition of the fuel, (2) Turbulence or intimate mixing of the fuel and oxygen, and (3) Time, sufficient for complete combustion.
An overall ideal reaction of biomass combustion can be defined by Reaction (1):
Left side of the equation represents biomass and air, respectively. As a result of the combustion reaction, besides the combustion products (CO2, H2O, NO2, SO2, HCl and excess air O2 and N2), different types of pollutants are emitted:
1. Unburnt compounds such as CO, CXHY, PAH, tar, unburnt carbon and PCDD/F; 2. Gaseous pollutants such as NOX (NO and NO2), N2O, CO2, SO2 and HCl;
3. Ash particles containing Si, Al, Fe, Ca, Mg, Na, K, S, and P as well as heavy metals such as Zn and Pb.
The air mass needed for combustion depends on the chemical and physical characteristics of the fuel. In order to achieve a complete oxidation of the fuel the total flow of air (airtotal) must be bigger than the stoichiometric flow (airstoiq) demands leading to an excess air ratio, expressed in Equation (1). This excess of air must be controlled to avoid the process to cool down.
%𝒆𝒂𝒊𝒓= 𝒂𝒊𝒓𝒕𝒐𝒕𝒂𝒍
𝒂𝒊𝒓𝒔𝒕𝒐𝒊 × 𝟏𝟎𝟎 = %𝑶𝟐
𝟐𝟏 − %𝑶𝟐× 𝟏𝟎𝟎 Equation (1)
The pollutant emissions from biomass combustion are briefly explained in Section 1.3
1.2 COMBUSTION TECHNOLOGIES
Heat and electricity production technologies, using biomass as fuel, are well developed in many applications. Biomass heating systems range from domestic small-scale stoves (5 kWth to 100 kWth) to larger scale boilers for heat and power (100 kWth to 500 kWth). Large heat and power plants have capacities in the range of 1 MW up to 500 MW and are capable of using various biomass feedstock,
e.g. wood residues, wood chips, straw, etc.
Thermal PPs use water as working fluid, in the form of steam. Steam generators, or boilers, use the heat to convert water into steam for power generation, by means of a steam turbine, and industrial process heating. Steam is a key resource because of its wide availability, advantageous properties and nontoxic nature.
The technological configuration of this type of PPs is based in Rankine’s Ideal Cycle, which can be split into four subsystems (Babcock, 2005): Subsystem A is where the conversion from heat to work
happens, the thermal energy in the working fluid is converted into mechanical energy in the turbine; Subsystem B is where the chemical energy from the fuel is converted into thermal energy, then stored in the working fluid; Subsystem C is where the energy stored in the working fluid is supplied to the cooling cycle; finally the Subsystem D, where the mechanical energy of the turbine is converted into electrical energy by the electrical generator.
The main feature of the Rankine cycle is that compression is confined to the liquid phase, avoiding the high compression work and mechanical problems. The temperature increase of the heat supplied to the working fluid in the boiler and the cooling temperature decrease in the condenser improve the thermal efficiency of the cycle. Hence, the working fluid, in steam state, is usually superheated in super-heaters systems.
The boiler is the component used in Subsystem B of a PP. The working fluid is mainly liquid water which gets into the vapour state, or steam. This high-pressured steam will then apply work in the steam turbine. The most common technology used to circulate the working fluid is the Aqua Tubular Boiler type, due to the high pressurized steam demands in a Power Plant. The fluid circulates inside the boiler by a pipe system and is heated from the outside by the combustion gases. The reverse is called Pyro Tubular Boiler.
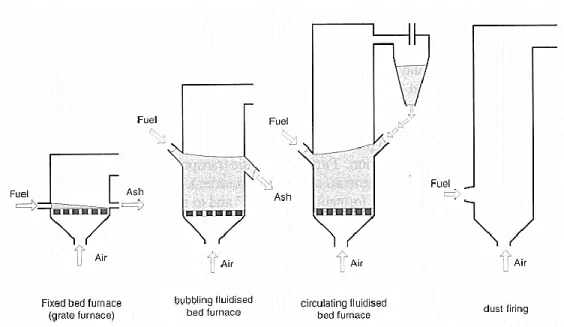
Systems for biomass combustion can be distinguished by the flow conditions in the furnace: fixed bed combustion, bubbling fluidized bed (BFB) and circulating fluidized bed (CFB), and dust combustion (Nussbaumer, 2003), as shown in Figure 1.
Figure 1 – Main combustion technologies for biomass (adapted from Van Loo et al. (2010))
These technologies normally have air staging systems, meaning that air supply is split, usually, into two inlets: primary and secondary, the first below and the last above the bed zone. This air staging enables good mixing of combustion air with the gases formed by devolatilization and gasification of fuel in the fuel bed zone. This mechanism allows controlling the combustion conditions and, therefore, controlling the pollutant formation and emissions. In conventional two-staged combustion, primary air is usually under stoichiometric, and a relevant residency time is needed between the fuel bed zone and the secondary air inlet (Nussbaumer, 2003).
Fixed bed combustion systems (T = 900 °C to 1200 °C) include grate furnaces and underfeed stokers. Primary air passes through a fixed bed, in which drying, gasification, and charcoal combustion takes place. The combustible gases produced are burned after secondary air addition has taken place, usually in a combustion zone above the fuel bed.
There are various grate furnace technologies available: fixed grates, moving grates, travelling grates, rotating grates and vibrating grates.
Grate furnaces are appropriate for biomass fuels with high moisture content, varying particle sizes, and high ash content. A good and well controlled grate is designed to guarantee a homogeneous distribution of the fuel over the whole grate surface. Furthermore, the transport of the fuel over the grate has to be as smooth and homogeneous as possible in order to keep the bed of embers calm
and homogenous, to avoid the formation of “holes” and to avoid the elutriation of fly ash and unburned particles as much as possible (Van Loo et al., 2010).
Dust combustion is suitable for fuels available as small particles (average diameter smaller 2 mm). A mixture of fuel and primary combustion air is injected into the combustion chamber, combustion takes place while the fuel is in suspension, and gas burnout is achieved after secondary air addition (Van Loo et al., 2010).
1.2.1 FLUIDIZED BED BOILER
This technology is recognized as the most suitable for biomass combustion due to its low process temperatures, isothermal operating conditions, and fuel flexibility.
Within a FB, biomass fuel is burned in a self-mixing suspension of gas and solid-bed material into which combustion bed and circulating fluidised bed combustion can be distinguished. This type of boilers is applied in large-scale applications and often used for waste wood and industrial wastes, e.g. from the pulp and paper industry
A FB boiler consists of a compact vessel with an air distribution plate in the bottom, filled with a fluidized suspension bed of hot, inert, and granular material. The common bed materials are silica, dolomite and/or ashes from the fuel. The bed material usually represents 90 % to 98 % of the mixture of fuel and bed material.
Primary combustion air enters the furnace from below through the air distribution plate and fluidises the bed material so that it becomes a seething mass of particles and bubbles. Secondary air is introduced above the bed – splashing zone – and, usually, also further higher up – freeboard, also called tertiary air – by well distributed air inlets.
The combustion temperature has to be kept low (usually within 800 ˚C to 900 ˚C) in order to prevent ash sintering in the bed. This can be achieved by internal heat exchanger surfaces, by flue gas recirculation, or by water injection (Babcock, 2005).
As mentioned before, the primary air inlet induces an upward flow of a gas through a stacked height of solid particles, which will affect the pressure differential between the top and the bottom of the container, this is the fluidizing process. At high enough gas velocities, the gas/solids mass exhibits
liquid-like properties, thus the term fluidized bed. The point where the bed starts to behave as a fluid is called the minimum fluidization velocity.
Regarding the minimum fluidization velocity, there can be four bed working regimes: Fixed bed - a small quantity of air flows through the air distributor into the sand; BFB - as the air flow increases further, bubbles of air start to form, and the bed becomes violent, increasing the bed volume. There is an obvious bed level and a distinct transition between the bed and the space above; Turbulent Fluidized Bed, by increasing the air flow further, the bubbles become larger and begin to coalesce, forming large voids in the bed. The solids are present as interconnected groups of high solids concentrations; CFB - a further increase in air flow causes the particles to blow out of the bed and the container. If the solids are caught, separated from the air, and returned to the bed, they will circulate around a loop. Unlike the bubbling bed, the CFB has no distinct transition between the dense bed in the bottom of the container and the dilute zone above. The solids concentration gradually decreases between these two zones (Babcock, 2005).
Regarding technological applications, fluidized bed boilers can be split into: CFB and BFB boilers, schemes of both are presented in Figure 2.
Figure 2 – (a) Circulating Fluidized Bed, (b) Bubbling Fluidized Bed (adapted from Van Loo et al. (2010))
The main differences between both are the fluidization velocity, bed particles’ size, heat and mass transfer rate and flue gas composition profile along the reactor.
Freeboard zone Bed zone Freeboard zone Bed zone
A CFB system is achieved with a fluidising velocity of primary air from 5 m/s to 10 m/s and using small sand particles, from around 0,2 mm to 0,4 mm in diameter, which are carried out of the bed zone. The sand particles will be carried with the flue gas, separated in a hot cyclone or a U-beam separator, and fed back into the combustion chamber. The high turbulence in CFBB leads to a better heat transfer and a very homogeneous temperature distribution in the bed, resulting in stable combustion conditions. In view of their high specific heat transfer capacity, this system are widely used at industrial scale, due to their higher combustion efficiency and the lower flue gas flow produced. In a BFB the bed material is usually silica sand of about 1,0 mm in diameter; the fluidisation velocity of the air varies between 1,0 m/s and 3 m/s. In contrast to coal-fired BFB furnaces, the biomass fuel should not be fed onto, but into the bed by inclined chutes from the fuel hoppers because of the higher reactivity of biomass in comparison to coal. The advantage of BFB furnaces is their flexibility concerning particle size and moisture content of the biomass fuels. Furthermore, it is also possible to use mixtures of different kinds of biomass or to co-fire them with other fuels. One big disadvantage of BFB furnaces, the difficulty to work at partial load, is solved in modern furnaces by splitting or staging the bed (Van Loo et al., 2010).
Due to the good mixing achieved, FB plants can deal flexibly with various fuel co-firing, but are limited when it comes to fuel particle size and impurities contained in the fuel. Therefore, appropriate fuel pre-treatment system covering particle size reduction and separation of contaminants (metals, stones and soil) is necessary for fail-safe operation. Moreover, partial load operation of FB combustion plants is limited due to the need of the bed fluidisation.
The intense heat transfer and mixing provides good conditions for a complete combustion with low excess air demand: between 1,1 and 1,2 for CFB plants and between 1,3 and 1,4 for BFB plants (Babcock, 2005).
One disadvantage of FB combustion plants is posed by the high dust loads entrained with the flue gas and the fuel, mainly biomass, which make efficient dust precipitators and boiler cleaning systems necessary. Bed material is also lost with the continuous ash extraction, making it necessary to periodically add new material to the plant.
1.3 EMISSIONS FROM BIOMASS COMBUSTION
This section presents a brief description regarding some of the pollutant emissions and mechanisms – CO, NOx, SO2, HCl and Particulate Matter (PM) in particular – are presented.
According to the European Directive (2010/75/EU) on industrial emissions (IED), the term “pollution” means the direct or indirect introduction, as a result of human activity, of substances, vibrations, heat or noise into air, water or land, which may be harmful to human health or the quality of the environment, result in damage to material property, or impair or interfere with amenities and other legitimate uses of the environment (IED, 2010).
The pollutant emissions considered by the IED, for biomass combustion, are PM, NOx and SO2. Nevertheless, CO and HCl emissions were taken into consideration.
1.3.1 LEGAL FRAMEWORK
The European Union addresses air pollution through a number of legal measures. The Large Combustion Plant Directive (LCP) (2001/80/EC), transposed to Portuguese law by Decree-Law 178/2003, de 5 de Agosto, sets the main principles for the permitting and control of installations with rated thermal input of 50 MWth to 100 MWth.
This directive is based on an integrated approach and the application of Best Available Techniques (BAT, 2006). These are the most effective techniques to achieve a high level of environmental protection, taking into account the cost and benefit. For combustion systems BAT for LCP was published in the 2001 Reference Document on Best Available Techniques for Large Combustion Plants (BREF, 2006). On 7 January 2014 the IED, transposed to Portuguese law by the Decree-Law 127/2013, of August 30, repealed and replaced Directive 2008/1/EC on Integrated Pollution Prevention and Control (IPPC), Directive 2000/76/EC on Waste Incineration (WID), Directive1999/13/ECon activities using organic solvents and Directives 78/176/EEC, 82/883/EEC and 92/112/EEC, concerningtitanium dioxide production.
Furthermore, in order to complete the regulatory framework for the combustion sector, in December 2013 the Commission adopted a proposal for a new Directive to control emissions of air polluting substances from combustion plants with a rated thermal input between 1 MWth and 50 MWth.
Therefore, a Medium Combustion Plants (MCP) directive proposal was presented. With this, the Commission aims to avoid possible trade-offs between air quality and increased biomass use, which may otherwise result in increased air pollution (MCP, 2013).
In the proposed Directive (MCP, 2013), on the limitation of emissions of certain pollutants into the air from MCP, it is stated that from 1 January 2025 emissions into air of SO2, NOx and PM, from an existing medium solid biomass combustion plant with a rated thermal input above 5 MWth, must be controlled.
Also another proposal is in works, this one to transpose into EU law the international emission reductions for 2020, that the EU has committed to under the 2012 Gothenburg Protocol of the Convention on Long-Range Transboundary Air Pollution (LRTAP, 2014). The LRTAP protocol aims to control emissions of heavy metals, by establishing ELVs, caused by anthropogenic activities that are subject to long-range transboundary atmospheric transport and are likely to have significant adverse effects on human health or the environment. However, this protocol only applies to large combustion plants (>50 MWth) and shall not apply to plants using biomass as their only fuel source.
In the scope of the Air Quality, the objectives related to limit value and exposure – exposure concentration obligation and exposure reduction target – for gaseous pollutants (SO2, NOx, CO) and PM10/2,5 are specified in Directive 2008/50/EC on ambient air quality and Cleaner Air For Europe (CAFE), transposed to the Portuguese law by Decree-Law 102/2010, on September 23. The information on all air pollution abatement measures that have been considered at appropriate local, regional or national level for implementation in connection with the attainment of air quality objectives, include, among other, reduction of emissions from stationary sources by ensuring that polluting small and medium sized stationary combustion sources (including for biomass) are fitted with emission control equipment or replaced (AAQ, 2008).
Within the Portuguese framework the prevention and control of SO2, NOx, CO and TSP emissions was established by the Decree-Law 78/2004, of April 3. It comprises combustion plants whose rated thermal input is greater than 100 kW.
In Portugal Emission Limit Values (ELV, mg/Nm3) are fixed by Portaria 675/2009, of June 23rd (general ELV) and Portaria 677/2009, of June 23 rd (fuel specific ELV). In addition, pollutants maximum mass flow limits, fixed by Portaria 80/2006 of January 23 rd, are 50 kg/h for SO2, 30 kg/h for NOx and 5 kg/h for PM.
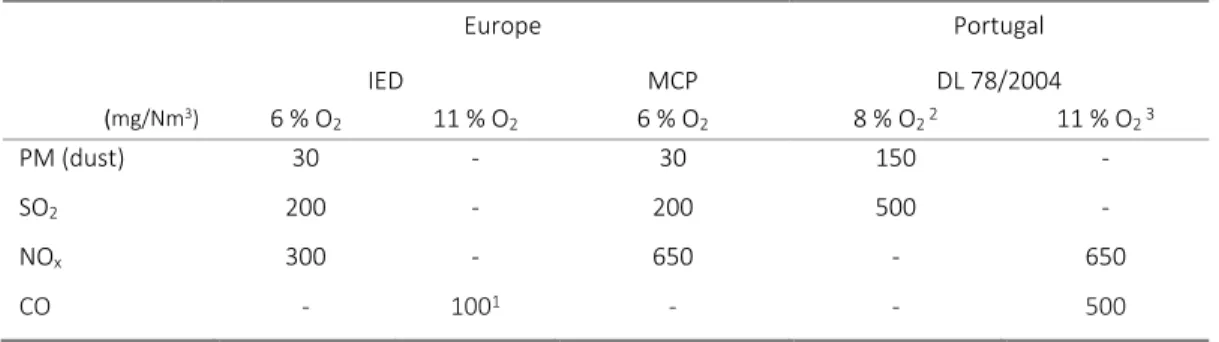
The ELVs for biomass combustion, from the European IED and the new MCP directive proposal and the Portuguese Decree-Law (DL) 78/2004, of April 3 rd, are presented in Table 3.
Table 3 – Emission Limit Values (mg/Nm3)for biomass combustion, in Europe and Portugal
Europe Portugal IED MCP DL 78/2004 (mg/Nm3) 6 % O 2 11 % O2 6 % O2 8 % O2 2 11 % O2 3 PM (dust) 30 - 30 150 - SO2 200 - 200 500 - NOx 300 - 650 - 650 CO - 1001 - - 500
1 Hourly average value for waste incineration plants using fluidized bed technology 2 Portaria 675/2009, 23rd June
3 Portaria 677/2009, 23rd June
In IED the ELV for HCl is 10 mg/Nm3 at 10% O2 for waste incineration and co-incineration. In the previously mentioned regulation, applicable to combustion systems, HCl is not regulated, however this ELV will be considered, as a reference value. The Portuguese DL 78/2004, defines a general ELV for chlorine compounds emissions of 30 mg/Nm3 at 8% O2 (around 25,4 mg/Nm3 at 10%O2).
1.3.2 CO EMISSIONS
Carbon monoxide (CO) emissions are essentially the result of incomplete combustion, hence belonging to the unburnt pollutants. Its emissions are usually related to the combustion efficiency, because of its dependence on the operational parameters related with the mentioned “three T’s” of combustion – Temperature (around 850 °C), Turbulence and Time of residence (around 0,5 s) – and fuel feeding characteristics such as compositions and granulometry. Therefore, it is possible to control its emissions by controlling these parameters.
In FB boilers, CO emissions are reduced by using air staging, running the system at lower fluidization velocity (increased residence time) and lower sand particle size as bed (providing good mixing at low fluidization velocities) (Khan et al., 2008). In terms of CO emissions, FB possess formation and destruction zones of CO. The formation zone in the boiler bed, were the early combustion stages take place, while the destruction zone is usually in the freeboard where the second air oxidizes the CO with OH and HO2 radicals and also O2 directly.
Small scale biomass units can produce higher emission concentrations because of the fuel’s high volatile content and the unit’s shorter freeboard: leading to an insufficient residence time inside the furnace to combust, regarding the amount of produced volatiles. Hence, the importance of air staging, which can reduce unburnt pollutants to levels close to zero (Nussbaumer, 2003). The heat exchangers, that might be located inside the freeboard, decrease the temperature of the gases, inhibiting the conversion of CO to CO2. Also, irregular or improper fuel feeding could lead to higher CO emissions (Gulyurtlu, 2004).
1.3.3 NO
XEMISSIONS
Nitrogen base pollutants are commonly summarized as nitrogen oxides (NOx) and refer to the nitrogen oxide (NO) and nitrogen dioxide (NO2) formed during the combustion process. NO is the main form produced and emitted, around 30 %, and is converted to NO2 in the atmosphere (Obernberger et al., 2006). This pollutant generates a high environmental concern as an air pollutant due to its influence in acid rain, eutrophication and haze. Its formation process can be summarized into three steps:
1. Thermal NO: formed from the nitrogen of air, in high temperature conditions (typically >1300 °C) due to dissociation of the atmospheric diatomic specie N2;
2. Fuel NO: formation as a result of reactions involving fuel bound N;
3. Prompt NO: formed by fast reactions between the nitrogen of air, N2, and fuel bound hydrocarbons radicals. This reaction forms intermediate reactants, e.g. HCN, which are later oxidized into NO.
For biomass combustion, fuel-bound nitrogen is the main source of NOx emissions. Thermal and prompt NOx represent a small share due to the typical lower temperatures of biomass combustion in FB (below around 900 °C) (Nussbaumer, 2003).
Due to the low combustion temperatures, when compared with other combustion systems, formation of N2O may also occur in FB systems. N2O, although in much less quantities, contributes to the greenhouse effect and ozone depletion. The intermediate volatiles formed during biomass combustion in FB, mostly NH3 and HCN, are the dominant source of NOx and N2O, that react with oxygen while still in the bed. On the other hand, if no oxygen is available, intermediates can interact
in the freeboard forming N2. Also, the presence of CaO, MgO, and Fe2O3 in the fuel can lead to the formation of an active bed that can catalyse the reduction of NO and N2O, especially under fuel-rich combustion conditions (Khan et al., 2009).
There are two ways of reducing NOx: primary measures, also known as in-situ reductions, are based on the combustion process control, minimizing the NOx formation. The main technics used in biomass combustion are low working temperatures, air staging and, fuel staging leading to oxygen and temperature control, with NOx reductions between 30 % to 80 % (Nussbaumer, 2003). Flue/Exhaust Gas Recirculation is also an option, although with minor influence on NOx emissions.
Reburning is also a widely used solution. This technology consists in using auxiliary burners with a secondary fuel, usually natural gas, in the zone above the primary combustion zone (bed). Reduction of NOx occurs in reaction with the hydrocarbon fragments (CH and CH2) formed in the secondary fuel combustion.
Secondary measures can be used, if the emission limits are not met with the primary emission reduction measures. These are: Selective Catalytic Reduction (SCR) that consists in ammonia (NH3)or urea injection over a catalyst at about 250 °C to 450 °C, with reduction efficiency up to 95 %; Non-Selective Catalytic Reduction where the ammonia injection takes place in a separate reduction chamber at 850 °C to 950 °C, reduction efficiencies up to 90 % (Khan et al., 2009).
1.3.4 CHLORINE EMISSIONS
During combustion mainly gaseous HCl, and also Cl2 and alkali chlorides such as KCl and NaCl are produced. Due to subsequent cooling, part of Cl condenses as salts on fly ash particles in flue gas or in heat exchangers surfaces. The incorporation of Cl in the ash, which may attain 40 % to 80 % for wood combustion, depends on availability of alkali, earth-alkali metals present in the fuel (Obernberger et al., 2006). Chlorine (Cl) emission are not considered by the IED, although their emissions might relevant in case of a high Cl content fuel.
HCl retention may be achieved with CaO or CaCO3, when limestone or dolomite are used as sorbent in FB. The end product of limestone chlorination is found to be CaCl2 between 650 ⁰C and 850 ⁰C, with a molar Ca/Cl ratio above 2 (Partanen et al., 2005a).
Beside emissions, other important effects of Cl are corrosion of metal parts in the boiler (expected for concentration above 0,1 wt% d.b.) (Obernberger et al., 2006), promoting emission of heavy metals as fine particles, because Cl promotes the volatility of heavy metals (Zn, Ni, Cu, Fe, Cr, Pb chlorides) (Lopes et al., 2009). Cl may also lead to emission of dioxins and furans (PCCD/F).
1.3.5 SO
XEMISSIONS
Fuel bound sulphur generates gaseous compounds, mainly, sulphur dioxide (SO2) and minor quantities of sulphur trioxide (SO3). It can also be retained in solid forms as metal sulphates during the combustion process (Obernberger, 2005). This pollutant is known as one of the causes of acid rain. Together with chlorine, it may cause corrosion of boiler components, which is a major concern when compared with its low emissions, in biomass combustion systems.
During devolatilization of the fuel, sulphur can be released as H2S, in reductive zones, being later oxidized by the combustion air (Tarelho et al., 2005). The sulphates may condensate on the fly ash particles’ surface in a rapid cooling of flue gas flow.
Co-combustion experiments of biomass and coal led to conclude that SOX emissions reduce with the increase of biomass share, due to the lower sulphur content of biomass. Biomass increases the SO2 retention as a result of its ash high content of alkaline compounds K2O, Na2O, CaO and MgO (Fuertes
et al., 1992). Studies have shown that from 40 % to 90 % of the sulphur is retained by the fuel’s ash
(Obernberger et al., 1997). In FB systems, due to the low operating temperatures, sulphur tends to remain as CaSO4 form, minimizing SO2 emissions, therefore the presence of S may interfere with the alkali metals’ behaviour.
In FB, SOx emissions can also be controlled by in-situ addition of limestone, with CaSO4 as the main product, at temperatures in the range of 800 °C to 900 °C. Also, dolomite is a common used sorbent, producing Ca sulphate. SO2 reductions of 90 % to 95 % are typically achieved in CFB, which is normally enough to achieve the emission limits.
Retention efficiency of SOx in the FB is highly dependent on operating conditions: limestone’s particle size, system’s temperature and residency time. A high retention is achieved by small particles of the sorbent, providing a larger surface area, and decreases for bigger particles at the same temperature ranges. Low temperatures, between 675 °C and 725 °C, showed the best sulphur retention regardless
the particle size, and is the indicated range of temperatures for absorption by larger particles (Laursen
et al., 2002). This study concluded that 3:1 Ca/S is an ideal molar ratio for sulphur retention by
limestone.
Simultaneous retention of HCl and SO2 with limestone was studied, concluding that both compete for unreacted Ca leading to limestone chlorination suppression while its sulphation is enhanced (Partanen et al., 2005b), i.e. the presence of HCl promotes the SO2 capture by the bed material.
1.3.6 PARTICULATE MATTER EMISSIONS, PM
10/2,5The control of Particulate Matter (PM) emissions is one important concern in biomass combustion systems. The United States Environmental Protection Agency (EPA, 2013) states that PM includes
both solid particles and liquid droplets found in air. Many anthropogenic and natural sources emit PM directly or emit other pollutants that react in the atmosphere to form PM. These solid and liquid particles come in a wide range of sizes.
PM, referring to particles emitted with the flue gases of power generation plants, depend on the fuel characteristics, such as: composition; particle dimension and morphology; combustion technology system characteristics. These particles are generally classified into two classes: particles from incomplete combustion, such as soot, tar and char, and particles from inorganic material in the fuel’s ash, commonly referred as fly ash (Khan et al., 2009).
The first class can be easily managed by improving the combustion conditions, since its formation occurs early in the flame zone. Particles formed by inorganic material are divided into coarse fly ash and aerosols, corresponding to larger particles and smaller particles respectively.
During combustion the biomass particle undergoes various mechanisms resulting in the mentioned particles, as shown in Figure 3. The ash constituents’ elements have different behaviours during combustion process, according to their volatility.
Figure 3 - Ash formation during biomass combustion (adapted from Obernberger (2005))
Coarse fly ashes are mostly produced from transport of minerals contained in biomass and also fusion and coagulation mechanisms of non-volatile ash elements such as Si, Ca, Mg, Al, P and Fe. This mechanism consists in the agglomeration of both regular and irregular shape particles through the outer layer (Khan et al., 2009). It is common that alkaline and heavy metal salts, form aerosol particles, and condensate on the surface of the coarse particles.
Aerosols are mainly originated by easily volatile elements, normally heavy metals and alkali metals, under nucleation and condensation mechanisms (Nussbaumer, 2001). A great share of these constituents is released into the gas phase, at high temperatures, going through homogeneous gas phase reactions and ultimately nucleate, due to super saturation (Obernberger, 2005).
Aerosol particles can form coarser particles through heterogeneous condensation on other particles’ surfaces; coagulation of particles and growth; explosions of cenosphere (round, hollow vitrine-derived particles); aerodynamic transport of small mineral forms and unburned matter (Lopes et al., 2009).
In the case of biomass combustion in FB, ultra-fine particles are mainly formed by alkali sulphates and chlorides nucleation and condensation on particles with metal oxides. Alkali compounds have low melting temperatures, that when condense may form low viscosity sticky layer, that highly contributes to the deposition of impacted particles (Nussbaumer, 2001).