BAYES AHMED URBAN LAND COVER CHANGE DETECTION ANALYSIS AND MODELLING SPATIO-TEMPORAL GROWTH DYNAMICS USING REMOTE SENSING AND GIS TECHNIQUES
Texto
Imagem
Documentos relacionados
Linking geomorphologic knowledge, RS and GIS techniques for analyzing land cover and land use change: a multitemporal study in the Cointzio watershed, Mexico.. Maps of land cover
Object-based change detection is a powerful analysis tool for remote sensing data, but few studies consider the potential of temporal semivariogram indices for mapping
We applied remote sensing techniques on a TM Landsat 5 image (1:50,000) to map land use and vegetation cover of the Restinga de Jurubatiba National Park and surroundings.. The
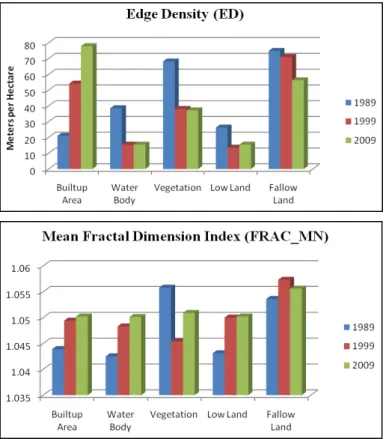
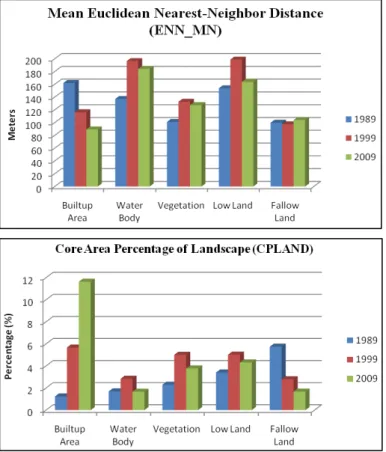
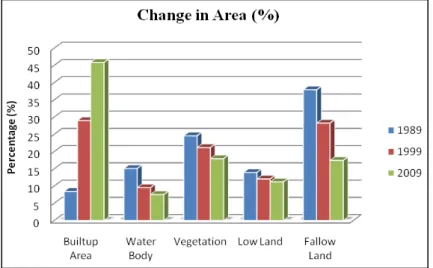
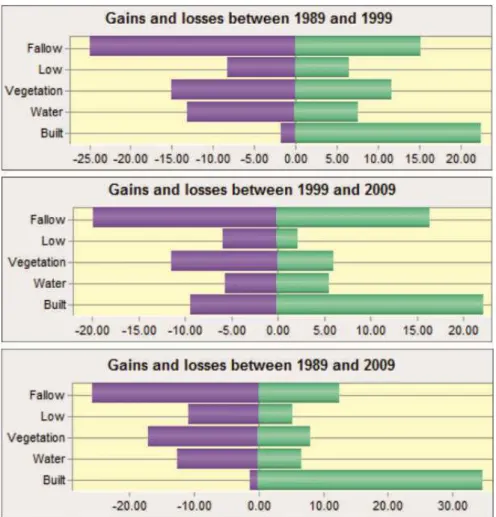
Integrated approach (Figure 1) of remote sensing and geographic information system such as image classification, change detection techniques, spatial metrics and land use
The main objective of this study was to assess the impacts of land use and land cover change impact on the stream flow of Gilgel Abbay watershed using Remote
This study attempts to analyze land use land cover change and its impact on soil erosion process by applying and adopting commonly used satellite remote
Exploring land use land cover (LULC) change to understand urban warming effect is a necessary work for community and local government. The research can be used
Once validated, the model was used with the same driving forces and the same prediction time difference (11 years) using 1984 and 2014 ’s LCLU maps to predict the LCLU map of
