Revista
de
Administração
http://rausp.usp.br/ RevistadeAdministração52(2017)3–14
Marketing
A
model
of
integration
among
prediction
tools:
applied
study
to
road
freight
transportation
Um
modelo
de
integra¸cão
entre
ferramentas
de
previsão:
estudo
aplicado
ao
transporte
rodoviário
de
cargas
Un
modelo
de
integración
de
herramientas
de
predicción:
estudio
aplicado
al
transporte
de
carga
por
carretera
Henrique
Dias
Blois
a,∗,
Ricardo
Silveira
Martins
baUniversidadedePassoFundo,PassoFundo,RS,Brazil
bUniversidadeFederaldeMinasGeraisBeloHorizonte,MG,Brazil
Received29July2015;accepted13June2016 Availableonline10October2016
Abstract
Thisstudyhasdevelopedasceneryanalysismodelwhichhasintegrateddecision-makingtoolsoninvestments:prospectivescenarios(Grumbach Method)andsystemsdynamics(hardmodeling),withtheinnovatedmultivariateanalysisofexperts.Itwasdesignedthroughanalysisandsimulation scenariosandshowedwhicharethemoststrikingeventsinthestudyobjectaswellashighlightedtheactionscouldredirectthefutureofthe analyzedsystem.Moreover,predictionsarelikelytobedevelopedthroughthegeneratedscenarios.Themodelhasbeenvalidatedempiricallywith roadfreighttransportdatafromstateofRioGrandedoSul,Brazil.Theresultsshowedthatthemodelcontributestotheanalysisofinvestment becauseitidentifiesprobabilitiesofeventsthatimpactondecisionmaking,andidentifiesprioritiesforaction,reducinguncertaintiesinthefuture. Moreover,itallowsaninterdisciplinarydiscussionthatcorrelatesdifferentareasofknowledge,fundamentalwhenyouwishmoreconsistencyin creatingscenarios.
©2017DepartamentodeAdministrac¸˜ao,FaculdadedeEconomia,Administrac¸˜aoeContabilidadedaUniversidadedeS˜aoPaulo–FEA/USP. PublishedbyElsevierEditoraLtda.ThisisanopenaccessarticleundertheCCBYlicense(http://creativecommons.org/licenses/by/4.0/).
Keywords:Decisionsoninvestment;Scenariosanalysis;Predictionmodel;Roadfreighttransportation
Resumo
Nesteestudo,buscou-sedesenvolverummodelodeanálisedecenáriosqueintegrouferramentasparaapoioàtomadadedecisãonosinvestimentos: Cenáriosprospectivos(MétodoGrumbach)eDinâmicadesistemas(modelagemhard),comainovac¸ãodaintroduc¸ãodaanálisemultivariada pelosperitos.Acontribuic¸ãodomodeloéamaiorobjetividadeeclarezanaanálisequesedáatravésdesimulac¸ãodecenários,comidentificac¸ão doseventosedasac¸õesredirecionadorasmaisimpactantes,numsistemainterativoemquenovasprevisõessãopossíveisdeseremdesenvolvidas atravésdoscenáriosgerados.OmodelofoivalidadonosetordetransporterodoviáriodecargasdoestadodoRioGrandedoSul.Osresultados mostraramqueomodelocontribuiparaaanálisedeinvestimentos,poisidentificaprobabilidadesdeacontecimentosqueinterferemnatomadade
∗Correspondingauthorat:RuaJoãoLech,88,99052304,PassoFundo/RS,Brazil.
E-mail:[email protected](H.D.Blois).
PeerReviewundertheresponsibilityofDepartamentodeAdministrac¸ão,FaculdadedeEconomia,Administrac¸ãoeContabilidadedaUniversidadedeSãoPaulo –FEA/USP.
http://dx.doi.org/10.1016/j.rausp.2016.09.005
decisão,bemcomoidentificaprioridadesdeac¸õesparaareduc¸ãodeincertezasnofuturo.Alémdomais,permiteumadiscussãointerdisciplinar quecorrelacionadiferentesáreasdoconhecimento,fundamentalquandosedesejamaiorconsistêncianaconstruc¸ãodecenários.
©2017DepartamentodeAdministrac¸˜ao,FaculdadedeEconomia,Administrac¸˜aoeContabilidadedaUniversidadedeS˜aoPaulo–FEA/USP. PublicadoporElsevierEditoraLtda.Este ´eumartigoOpenAccesssobumalicenc¸aCCBY(http://creativecommons.org/licenses/by/4.0/).
Palavras-chave: Decisãosobreinvestimentos;Análisedecenários;ModelodePrevisão;TransporteRodoviáriodeCargas
Resumen
Enesteestudiosebuscadesarrollarunmodelo deanálisisenque seintegranherramientasdeapoyoalatomadedecisionesdeinversiones: escenariosprospectivos(métodoGrumbach)ydinámicadesistemas(hardmodelling),mediantelainnovacióndelanálisismultivariadorealizado porlosexpertos.Elmodelocontribuyeconunamayorobjetividadyprecisiónenelanálisisypermiteidentificarloseventosyaccionesmás efectivos,enunsistemainteractivoenquenuevasprediccionespuedendesarrollarsepormediodelasimulacióndeescenarios.Sehavalidadoel modeloenelsectordetransportedecargaporcarreteradelestadodeRioGrandedoSul.Losresultadosdemuestranqueelmodelocontribuyeal análisisdeinversión,puesidentificaprobabilidadesdeeventosqueinterfierenenlatomadedecisiones,asícomoindicaprioridadesdeacciones parareducirincertidumbresenelfuturo.Además,permiteundebateinterdisciplinarioquecorrelacionadiferentesáreasdelconocimiento,loque esfundamentalcuandosedeseaunamayorcoherenciaenlacreacióndeescenarios.
©2017DepartamentodeAdministrac¸˜ao,FaculdadedeEconomia,Administrac¸˜aoeContabilidadedaUniversidadedeS˜aoPaulo–FEA/USP. PublicadoporElsevierEditoraLtda.Esteesunart´ıculoOpenAccessbajolalicenciaCCBY(http://creativecommons.org/licenses/by/4.0/).
Palabrasclave: Decisióndeinversiones;análisisdeescenarios;Modelodepredicción;Transportedecargaporcarretera
Introduction
Predictionmodelsarewidelyusedinbothbusinessand pub-licsectors.Theyareusefuleitherforplanningasforsensitivity analysis, as to the environmental changes for effective deci-sionmaking.Thusthereisaconstantsearchtoimprovethese models,sothaterrorsandrisksofthedecisionmakersare min-imized.Thisstudy includessomegaps sinceit worksbothin the prospection of opportunities as in the simulation, funda-mentalcharacteristics when analyzinginvestmentsinfluenced byanumberofrisksanduncertainties,whichneedto system-atizealogicalprocesstoawiderrangeofanalysis.Theseare notusualcharacteristicsintheliteratureandtheresultedmodel establishedareflectionontheintegrationofapproachesontwo tools:onethatanalyzesthevariablesunderthestaticpointof view(Prospective Scenarios) and anotherunder the dynamic (SystemDynamics).
Integratedmodelshadprovidedsuperiorresultswhentested for agivendecision-making. Exampleisthe model proposed by Mattos (2008), which integrated econometric tools for timeserieswithinput-outputmodelsandbroughtcontribution becauseithasestablishedinvestmentopportunitiesaccordingto theconfigurationofeachelaboratedscenario.Nishikawa(2014)
alsoproposedanintegrativemodeltodeterminethebehaviorof financial defaults composedof macroeconomic variablesand theircorrelationswithamacroeconomicevent,suchasan eco-nomiccrisis.
Specificallyforsectorialscenariosfordecisionsupportwith participationofexperts,themodelproposedbyBloisandSouza (2008) integrated prospective scenarios to the dynamic sys-tems,providingaqualitativedescriptionofthephenomenonand quantitativedevelopments.Thisstudyhastheincorporationof expertsdifferential,whichisnotsowidespreadintheliterature, withaconvenienceofallowingeasyunderstandingand partici-pationofexpertsintheconstructionandanalysisofscenarios.
Thisfeatureisimportantbecauseitallowsaninterdisciplinary discussionthatcorrelatesdifferentareasofknowledge,whichis essentialwhenyouwantmoreconsistencyinbuildingscenarios. In the present study, achange wasproposed tothe model developed byBlois andSouza(2008),incorporatingthe step “multivariateregressionanalysis”beforeperformingthe integra-tion.Theinclusionofthisstepcanbeconsideredabreakthrough since it enables the identification of correlations between variablesforsubsequentintegration,therebyimprovingits con-sistency. Thus, this model will have as empirical field the freighttransportationsectorintheRegionalDevelopment Coun-cil(COREDE)Production,stateofRioGrandedoSul,Brazil, from2016to2020.
Thearticleisstructuredinfoursessions.Thefirstsection,is wherethestudywascontextualizedandtheproblemand objec-tiveswerepresented,thesecondsectionprovidesabriefreview oftheliterature.Thethirddescribesthemethodologicalchoices. Then,thedatawasanalyzedanddiscussed,sothemodelreaches thefinalformat.Finally,wepresenttheconclusionsofthisstudy.
Literaturereview
The proposed model will imply integrating the tools of prospectivescenariosandsystemdynamics.Therefore,both the-oreticalandliteraturereviewsaresupportedbythesereferences.
Prospectivescenariosasadecisionsupporttool
Method Mechanisms of employed analysis
Godet
-It uses both qualitative and quantitative variables
-It has the clearest detail of the tooling at all stages, constituti ng the most robust, with steps to follow defined
-Little flexible
-Uses hauliers facts to generate future scenarios
-One that does not take into account the mental models of directors during the development of the works
GBN
-Generates global scenarios -It uses only qualitative variables -Flexible
-It uses the analysis"Uncertainty x importance" to generate scenarios. -It is the only one that does not work with probability at any time
Porter
-It drives its analysis to the industry and adds to the method the behavior of the competition at the end of the process
-Only qualitative variables -Flexible
- It uses the "uncertainty x importance" analysis to generate scenarios
Grumbach
-It uses qualitative variables only -Little flexible
-It uses future haulier facts to generate scenarios. -It is the only one using the Delphi method
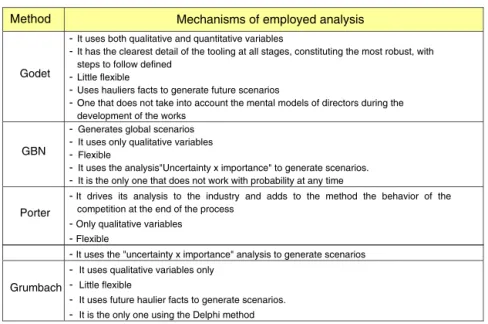
Fig.1.Comparinganalysismechanismsusedbydifferentmethods.Source:AdaptedfromMarcialandCosta(2012).
youshouldbepreparedtofaceit.Godet(1993)conceptualizes scenarioas awholeformed by the coherent description of a futuresituationandforthereferralimaginedandcreatedfrom eventsthatallowtopassthesourcesituationtothefuture sit-uation.Buarque(2003)complementsexplainingthatalthough uncertainties cannot beeliminated, nor categorically defined, thefuturetrajectoriesofrealitystudied,methodsofconstructing scenarios,contributetorestrictthepossibleevolutionsofreality. Thus,itcanbesaidthattheconstructionofscenarioscontribute, inparticulartoanintegratedrealitynetworkofinternaland exter-nalrelationsinthebusinesscontext,inordertoindicategoals anddirectionsfortheactionswithacertainsafety.Marcialand Grumbach(2012)identifythescenariosasimportantdecision supporttoolsincetheyallowleaderstotakeriskydecisionswith transparency,identifyingopportunitiesandthreatstobusiness, promotingthedevelopmentandanalysisofnewoptionsbefore changesinexternalenvironment,andthatprovideavisionthat canbesharedbymembersoftheorganizationoraspecificsector. Currently,weunderlinetheconstructionofscenariosinthe faceof the need for planning in bothoperative and decisive dimensions,aimingtohaveinformativesubsidiestobetter fore-casteventsbyreducingnegativeimpacts,inadulysubstantiated processofaproactiveperspective.Thescenariotoolhasbeen usedwithdifferentapproachestopredictenvironmentalissues.
Prado,Moya,andVatopoulos(2013)analyzedthepotentialfor improvingenergyefficiencyandreducingCO2emissionsinthe
fuelsectorby2030.RatcliffeandKrawczyk(2011)usedthe sce-nariostooltopointpriorityneedsandapplicationofresourcesin urbanplanning.Forsocioeconomicissues,Viguié,Hallegatte, andRozenberg(2014)developedamodeltosimulatethe evo-lutionoftheurbanareaofParisbetween1900and2100.These examplesshowtheuseofthetoolforinvestmentanalysis pur-poses,regardlessoftheareawhereonewantstoinvestigate.
However,MarcialandCosta(2012)statethatthereareonly four methods that Fall under the prospective settings (set of investigations whichare intended to predict long-term inthe fieldofhumanities).ThedescriptionbyGodet;thedescription
bySchwartz–alsoknownasGBNmethod;thedescriptionby Porter;andthemethoddescribedbyGrumbach.Suchmethods havesomecommonfeatures,such as:(I)theybeginwiththe definition of the problemthat will be scenerized (Godet and Grumbachmakesuchadefinitiontodefinethesystem,as the GBN,andPorter,thestrategicquestion);(II)theyconduct his-toricalstudiesanddescriptionofthecurrentsituation;and(III) theyaskexpertsand/orspecialists.Inaddition,allfourmethods areconcernedwiththeconsistencyofthegeneratedscenarios, andnoneofthemhaveaspeedyprocedureinupdatingand com-paringdata,theypresentdifficultiesinhandlingalargenumber of variables andtheir trends. Regarding the differences,they focusonthemechanismsofanalysisthatwereused,sinceeach hasitsrespectivetechniquetogeneratedifferentscenarios,as showninFig.1.
Systemdynamicsasadecisionsupporttool
papyriferainEthiopia,theAraújo’smodel(Araújo,2013)which servedtosimulatepassengerdemandinthirteenBrazilian air-portsatpeakhours;Sverdrup,Ragnarsdottir,andKoca(2014)
whichaimedtoprovidefortheexhaustionofthecoppermines ontheplanet.TheseexamplesreinforcetheroleofthehardSD modelingasanimportantdecisionsupporttoolforinvestments. Following,themethodologicalschemethatguidedthe inte-grationbetweenprospectivescenariostothesystemsdynamics ispresentedwhichwillbetestedinroadfreighttransportation.
Methodology
This is an exploratory and inductive logic study, when knowledge isbased onspecialists experience and generaliza-tionderivedfromcasesofobservationsoftangiblereality.This isanappliedresearch,itaimstoraisecausesandsolutionsto practicalproblemsexperiencedinthefieldofAdministration. As for its process, the research is qualitative and quantita-tive,developedthroughcasestudy,whereroadfreighttransport expertsparticipatedintheconstructionandanalysisofdata,they wereaddressedthroughminimummeetingsandsemi-structured interviewsduringthefirsthalfof2015,innortheasternofRio GrandedoSul.Theinformationwasraisedbyfactsoreventsthat hadimpactontheobjectofstudy,andservedinthediagnosis, constructionandanalysisofscenariosandfuturepredictions.
Modelanalysis
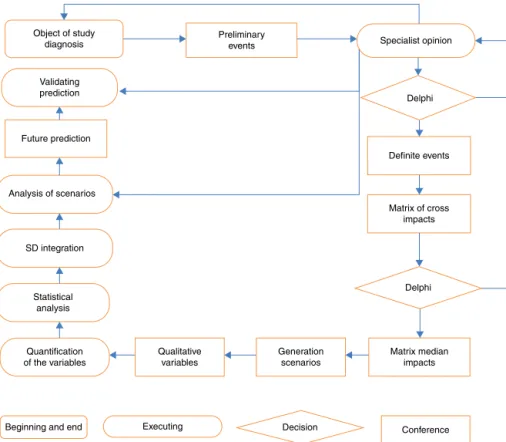
First of all,the model predicts adiagnosis of endogenous andexogenousissuesthat impactedpositivelyandnegatively thesurveyedsector.Thisdiagnosisshouldbemadebyexperts toidentifywhicharetheeventsthatactuallyimpactontheobject ofstudy.In thisstageofthemodel,thetoolusedarethe sce-narios,themethodwastheGrumbach(Marcial&Grumbach, 2012).Thechoiceofthismethodoccurredbecauseofthe consis-tencyandavailabilityofPointwiseUnconstrainedMinimization Approachsoftware(PUMA).Thismethodalsosetsupan inter-valineventsandprovidesthistooccurthroughaDelphipanel. Afterthat,the modelalsoprovides newassessment,whichis intended toindicate the degree of influence and dependence betweenevents,through anotherDelphipanel.Inthelaststep ofthemethodGrumbach(Marcial&Grumbach,2012),the sce-nariosaregeneratedandinterpreted,showingtheprobabilityor notofoccurrenceoffutureevents.
The integrationof the prospective scenarioswith Systems Dynamics(SD)isthroughIThinksoftware,aStellagroup prop-erty, for the same reasons that led to the choice of method Grumbach.Atthisstage,theeventsmustbequantifiedtoreceive astatisticalanalysisbeforeintegration.Intheimprovement pro-posed in this study, this is the new step inserted, aiming to identify an event (or independent variable), whichrepresents thequantitativeevolutionoftheanalyzedsector.Thisstepalso seekscorrelationsbetweentheindependentvariablewithother events(or dependent variables). If there are correlations, the influencesshouldbeallocatedonalinearregressionequation consideredinthepredictionsof thesystemdynamicSD.The variables(orevents)withnocorrelationshouldreceivefurther
treatment,whichisanassessmentoftheexpertsthroughnotes tobeinsertedintotheSDtool.
Fig.2showsthemethodologicaldevelopmentthatguidedthe research.
Totestthisproposedmodel,weselectedaterritorylocatedto thenortheastofRioGrandedoSul,namedCOREDEproduction region.Thisregionhas21cities,6002.7km2ofareaand pop-ulationof 342,442inhabitants(FEE, 2015).Thecomposition its Gross DomesticProduct (GDP)for 2010 wasrepresented as follows:services with63.96%, industry with26.86% and the remaining 9.18% to the agricultural sector (FEE, 2015). AnotherimportantfeatureofCOREDEisthelocation,thatis,an importantroadjunctionbetweensomeBrazilianstatesandthe Mercosulcountries.Theeconomicrepresentationandlocation oftheregionshowtheimportanceofplanningfortheroadfreight transportationsectorthroughinvestmentevaluationmodels.
Modelvalidation
Theapplicationofthemodelstartedinthefirsthalfof2015 withmeetingswithtenexperts.AsCamargopoints,thereisno specificformulatodetermineanoptimalnumberofparticipants inaDelphiresearchmodel.StudiesattheRandCorporation, byDalkeyetal.demonstratedminimalrequestofseven com-ponents. The option of ten experts was the availability and their interest in participating in all stages of research. The expert group isconstitutedas follows:two representatives of thefreighttransportationsector;threebusinessmenofthesector; anunionrepresentative;agovernmentrepresentative;andthree professorsandresearchersonfreighttransportationinCOREDE production.Thepurposeofthesemeetingswastoestablishthe diagnosisofthetransportationsectorintheregion.Therefore, itwasproposedthattheydescribeendogenousandexogenous eventsthatpositivelyandnegativelyimpactedontheindustry inthelasttenyears.
TheGrumbachmethodestablishesthatthelastperiodtobe consideredinthe observationof theeventsshouldbe atleast twiceasestablishedinthefutureprospection.Itwasestablished fiveyears,sinceMarcialandGrumbach(2012)recommendthat future scenarios do not have a time frame of less than that period. Andthisperiod was established alsoby limitation of past information. In selecting events, the experts participated of thebrainstormingtechnique,whichwereexpressed25 pre-liminaryfutureevents,occurringoverthenextfiveyears(from January 1,2016to31December2020),whichwereclassified intomacroeconomic,regionalandsectorialevents,listedbelow:
(A) MacroeconomicEvents (1) DollarValuation (2) Increasingdieselprice (3) WorldeconomyFALL
(4) RioGrandedoSuleconomyFALL (5) Braziliantaxreform
Object of study diagnosis
Preliminary
events Specialist opinion
Delphi
Delphi Definite events
Matrix of cross impacts
Matrix median impacts
Conference Decision
Executing Beginning and end
Quantification of the variables
Qualitative variables
Generation scenarios Statistical
analysis SD integration Analysis of scenarios
Future prediction Validating prediction
Fig.2.Methodologicalevaluationthathasguidedthisresearch.
(8) ConstructionofaFreightairportinCOREDE Produc-tion
(9) Local (COREDE Production) Rail service offer increasing
(10) Increasinglocal (COREDEProduction)agricultural production
(11) Increasing number of industries in the production COREDE
(12) Creation ofalocal (COREDEProduction)logistics platform
(C) IndustryEvents
(13) UnsaferoadsinCOREDEProduction (14) Increasingtollprice
(15) Increasingfreightrate
(16) FleetmodernizationinCOREDEProduction (17) Delaysinfreightratespayment
(18) Increaseduseoftechnologybyhauliers (19) Increasingcostsofvehiclemaintenance
(20) Increase the number of hauliers cooperatives in COREDEProduction
(21) Morelocal(COREDEProduction)logisticsoperators (22) BetterFederalandStateroads
(23) Easiercreditaccesstopurchasevehicles (24) IncreaseinfreightvehiclestheftinBrazil
(25) RisingcostsduetoimpactofLaw12619,which moni-torsthetransportoffreight
Obeyingtheevolutionmodel,weperformedaDelphipanel, inwhichtheexpertswereindividuallyinterrogatedbymeansof aquestionnaire.Theobjectiveofthispanelwastoreducetoten
thenumberofevents.Thisnumberissetbythelargenumberof scenariosgenerated,whichisequalto1024or210.Therefore,it tooktworoundsofDelphitoreducethescorestandarddeviation toalimitacceptabletotheGrumbachmethod.Thechoiceof thefinalevents,presentedbelow,followedthecriteria:events thatpresentedprobability≥60%(likelytooccurinthenext5 years)andrelevance≥7(veryhighinrelationtotheobjectof study).Fromthisstage,thefollowingonlyteneventslistedwere consideredinthedevelopmentofthemodel:
(2)Increasingdieselprice (3)WorldeconomyDrop
(4)RioGrandedoSul’seconomyFall (6)Increasinginterestrate
(8)ConstructionofaFreightairportinCOREDEProduction (9)Local(COREDEProduction)Railserviceofferincreasing (12)Creationofalocal(COREDEProduction)logistics plat-form
(14)Increasingtollprice
(19)Increasingcostsofvehiclemaintenance
(20)IncreasethenumberofhaulierscooperativesinCOREDE Production
12 8 6
9
II I
19
III
0
20 IV
3 4
Dependence
Influence
14 2
Fig. 3.Median impacts matrix: influence×dependence. Source: Software Puma.
andthereforethematrixofcrossimpactswassenttoexperts.In thismatrix,thedegreeofinfluenceanddependenceofthefinal eventsaregiven,asshowninFig.3.
(25)RisingcostsduetoimpactofLaw12619,whichmonitors thetransportoffreight
Thisarrayofmedianimpactsisanimportantinvestment anal-ysistoolbecauseitallowsthemanagerstohaveaperspectiveon thedegreeofinfluenceanddependencebetweenevents.InFig.4, inquadrantII,theeventsappear:“Increasinglocal(COREDE Production)agriculturalproduction”,“Increasinginterestrate” RioGrandedoSul’seconomyFALL”,“Increasingtaxes”,and “Increasingdieselprice”,thatis,veryinfluentialeventsandless
dependent.Anyactiononthemwillimpacttheothers,butother actionswillnotaffectthem.Thematrixreinforcesthedifficulty thattheroadtransportsectorwillfaceinchargesinthecoming yearsifnoactionistakenitisaimedchangingthem.
In quadrant III,the events are prepared “Increased use of technologybyhauliers”and“RisingcostsduetoimpactofLaw 12619,whichmonitorsthetransportoffreight”.Theseevents are ratherinfluentialandlittledependent thatisany actionin theothereventswillnotimpactthemaswellasanyactionon themwillnotimpactustoo.Eventsinthisquadrantshouldnot receivegreaterattention,theylittleinterferetheobjectofstudy. Effortstochangethemcauselowimpactonthetransportation sector.
In quadrant IV, appearevents“Increasing costsof vehicle maintenance”,“IncreaseinfreightvehiclestheftinBrazil”,and “unsaferoadsinCOREDEProduction“.Theseeventsarevery dependent and less influential. Any action on them will not impactustoomuch,butanyactionintheotherimpactsonthem. Twoeventsthatappearinthisquadrantaresectoraland unfa-vorable. Theyarealsothosewhosuffer thegreatestimpactif thereis nochangeintheother.In otherwords, itisexpected mostprecariousroadsandaconsequentincreaseinthecostof maintenanceoffreightvehiclesintheanalyzedregion.
Determiningthedegreeofinfluenceanddependencebetween eventsisimportantbecauseitdirectstheactionplanningofthose eventsthatcanchangethefutureofthesystem.Investorsshould notewhatarethepriorityactionstoamendthefutureoftheobject ofstudy.SpecialattentionshouldbegiventoquadrantIIevents,
MC1 MC2
MC3MC4
MC5 IR1
IR2 IR3 IR4 IR5
P11 P12
P13 P14
P15
Quantitative input
Qualitative addition
Number of vehicles
Qualitative decrease Quantitative
addition
Randomizer
S1P
S2P
S3P
S4P
S5P S6P
S7P S8P
SG10 SG9 SG8 SG7 SG6 Rate
SG1
SG2
SG3
SG4
SG5
S9P S10P
Scenario choice
Table1
Tenscenariosmostlikelytooccur.
Scenarios Probability Events
E.14 E.2 E3 E.4 E.12 E.19 E.6 E.20 E.8 E.9
Scenario1 24.00% O O O O O O O O O O
Scenario2 10.48% O O O O N O O O O O
Scenario3 8.58% O O O O O N O O O O
Scenario4 4.12% O O O O O O N O O O
Scenario5 3.24% O O O N O O O O O N
Scenario6 2.88% O O N O O O O O O O
Scenario7 2.61% N O O O O O N O O O
Scenario8 2.33% O O O O N N O O O O
Scenario9 1.89% O O N O N O O O O O
Scenario10 1.22% O O O O O N N O O O
Source:Puma4.0.
becausethesector’sperformancedependsonmacroeconomic actionswhichwillbetakeninthecomingyears.
Further,thesoftwarecalculatedthePUMAscenariosshown inTable1.ThemethodGrumbachusesBayestheorem(which shows the relation between a conditional probability and its inverse)toperformcalculations.Theresultisabinarysystem (occurrenceor nottheeventsoverfive years).Bayestheorem ischaracterizedbytheinfluenceoftheoccurrenceofanevent on the probability of other occur. To address the impacts as conditional probabilities, it is necessarythat theimpacts and likelyinformationbyexperts tobe subjectedtothistheorem, exemplifiedasfollows.
Therearetwoevents(A)and(B)towhichthefollowingare associatedprobabilities:
P(A)=probabilityofAoccurring;
P(B)=probabilityBoccurs;
P (A/B)=probability of occurring, provided that B has occurred;
P(B/A)=probabilityofBoccurs,sinceAhasoccurred.
Thetheoremcanalsobeexplainedbythefollowing:
Pr(A|B)= Pr(B|A)Pr(A)
Pr(B)
Table1shows thatthe toptenscenariosrepresent61.35% of probabilityof occurrencefor the nextfiveyearsout,what justifiesthe emphasis on them only. Thesescenarios can be interpretedin various waysin the methodology proposedby
Marcial andGrumbach(2012).The mostwidely usedis that whichdividesthemintothreecategories:mostlikely,trendand ideal.
Table1isdesignedforthesimultaneouscombinationofthe occurrenceornotofthetenfinalevents.Itisnoticedthatthe sce-nario1,alleventsoccursimultaneously.Inthescenario2,only theevent12(increaseinagriculturalproductioninCOREDE production)doesnotoccursimultaneouslywiththeothers.For this calculation, the PUMA software calculated the possible scenarios,the combinationof eventsor notevents, as Bayes’ theorem.
Themostlikelyscenario:Table1isrepresentedbyscenario 1,with24%probability.Inthisanalysistheexpertsalso partici-pated,givingprioritytonecessaryactionsforeachoftheevents, whichweredividedasfollows:
*Adverseeventsinthestudyobject–ischaracterizedasthe occurrenceofadverseeventsinthestudyobjectandthe non-occurrenceoffavorableevents.Intheseevents,theactionstaken initcanchangetheprobabilitiesofoccurrenceinthefuture.
Event(14)UnsaferoadsinCOREDEproduction
The actions that can be done today, in the assessment of experts,toimprovetheroadtransportoffreightforthenextfive yearswouldbe:mobilizingbothlogistical,independent opera-tors,shippersandpoliticalrepresentatives,aimingtodirectmore resources for corrective maintenance onroads in thisregion. TheeventisbecausethegovernmentofRioGrandedoSulstate resumedin2013alargepartofthemanagementof highways wereunderconcession,mainlyinCOREDEproductionregion. Duringtheconcessionperiod(15years),therewasdiscontent ofusersinrelationtotheamountpaidintolls.
However, fromthe endof theconcession, the government noticesnottodisposeofsufficientresourcestoperform mainte-nanceontheseroads,whichgeneratedmostdisagreement.The engagementofusersinthisshortstatemanagementperiodhas beentheonlyguaranteeforminimummaintenanceinstretches ofroadwithheavyflowoffreightvehicles.
Event(20)Increasingcostsofvehiclemaintenance
Thefirsteffectgeneratedbythepoorconditionof roadsis reflectedintheincreaseinthecostofmaintenance,orinadequate roads endup increasing the needto replaceparts invehicles that make their use.What could be done now to reduce the impactwouldbetocreatehaulierscooperatives,whichwould offerthepartsprocurementserviceforbothself-employed,and for operators. Thismeasure could cheapenthe acquisitionof parts,accessories,tires,grantingagreaterbargainingpower.
probabilityofoccurrenceoftheevents.Insuchcases,the alter-nativesectoristocreatealternativestoprotectagainstadversity.
Event(4)RisingcostsduetoimpactofLaw12619,which monitorsthetransportoffreight
Oneofthegoalsofthelawwastoguaranteetherestingperiod fordrivers,withtheimpactofthereductionofthoseroadsthat metlongjourneys.Butalsoimpliedincreaseinthe transporta-tioncosts.Intheassessmentofexperts,analternativetoreduce theimpactonthecostwouldbetousemanagement technolo-gies, whichwould enable to optimize the use of the fleet in transitestablishingsupportactivities,asscheduledsupply,small repairsonvehicleswhenitisstopped,especiallyforindependent hauliers.
Event(2)Increasingdieselprice
Dieselisanimportantvariablecostinroadtransport.Because it is a macroeconomic and unfavorable event, there are few alternatives toreducethe impactof thisevent. Shutdownsof hauliersthatoccurredin2014wereaimedatsensitizing govern-mentsandsocietyaboutthesituation,whichimpactstheentire economy.
Event(3)IncreaseinfreightvehiclestheftinBrazil
Freightofhigh-valueandeasytradingontheparallelmarket (cigarettes, electronics, etc.) are the most targeted.Increased security technology use is the primary means to reduce this adverse event.Asthecost for theacquisitionof security and communication technologiesin the transport sector hasbeen decreasing,itisexpectedthattheself-employedhauliers,who arethe majorityintheregion,canmakethemareality inthe nextfiveyears,asforlargerhauliersandlogisticsoperatorsof thesetechnologiesarealreadyarealityforsometime.
Event(6)RioGrandedoSul’seconomyFall
RioGrandedoSul’seconomyhasshownsignificant fluctu-ationsinGDP.Examplesaretheyears2008,whentherewasa decreaseof−0.8%ofGDP,andin2010,anincreaseof6.7% (FEE, 2014). Theseoscillations are also a reflection of agri-culturalfeature of the state (averageshareof the agricultural sector is 27% of the state GDP). As the agricultural sector dependsonclimaticfactors,rainfallfluctuationsdirectlyimpact theproductionandindirectlyinroadfreighttransport.Asbeing amacroeconomicevent,thetransportsectorhasnoactionsthat canchangethecourseofthiseventinthecomingyears.
Event(8)Increasinginterestrate
Interestratesnegativelyimpacttheeconomy.Whenincrease, interestcausethereductioninthecirculationofproducts,which directlyimpactsthetransportationsector.Andthereductionof theflowofgoodsinSDupdiscouragingindependenthauliers, largerhauliersandlogisticsoperatorstopurchaseand/orrenewal
ofthefleet.Becausethiseventisalsomacroeconomicand unfa-vorable,theanalyzedsectorwillhavedifficulties,ifnochange oftheinterestratepolicyforthenextfiveyearshappens.
Event(9)Increasingtaxes
Aswellas increasing interestrates, thetax increase nega-tively affects theperformance of the transportsector andthe economy asawhole, becauseit increasespricesandrestricts thepurchasingpowerofgoods.Thetransportsectoralsosuffers theconsequences,reducinginvestmentandcostitems suchas fuel.Thisisanothereventthatneedschangesinmacroeconomic policybytheexecutivepower.
* Events favorable to study- object are characterized by the occurrenceoffavorableeventsandthenon-occurrence of adverseeventstotheobjectofstudy.Inthiscase,actionsshould be structuredinthepresent sothat theobjectof studyknows besthowtotakeadvantageoffutureeventsthatarefavorable.
Event(12)Increasinglocal(COREDEProduction) agriculturalproduction
Althoughtherearehighlevelofmechanizationandintensive useofartificialirrigationintheregion,agriculturalproductionin COREDEProductionaccompaniesclimatecycles.Astherecent cycleofsoybean,wheatandcornproduction(most representa-tive culturesof the region)hada27% reductionintotaltons collectedbetween2010and2014(FEE,2015),expertsbelieve intheendofthatcycleandincreasingproductionforthe com-ing years. In thiscase the hauliers may take advantage of a possible increase in demand shuttle service for the next five years.
Event(19)Increaseduseoftechnologybythehauliers
Theintensiveuseofinformationtechnology(IT)asrouting systems, management and fleetcontrol, communication with CentralRouteCharges,amongothers,hasenabledthe optimiza-tionofvehicles.TheseITsinterferepositivelyonthecostofthe haulier, because we optimize equipment use,ponting shorter routes, indicating the shortest flow of vehicles on the roads, allowingbetterservicesoccupationcapacity,whichreducesthe cost per kilometer. Logistical and larger transporters opera-tors alreadyusethesetechnologiesonalargescale.However, self-employed hauliersstill havedifficultyacquiring ITs, par-ticularlythoseaimingmanagement.Theactioncouldbetaken todaytotakeadvantageofthisfavorableevent,theywouldbe self-employed hauliers, setupcooperatives topurchasethese servicesonfavorabletermstotheiroperations.
Thetrendscenario
Table2
Generationofscenariosandtheaveragegradeoftheexpertsforthenextfiveyears.
Events Impactrates
Scenario Probabilities E14 E2 E3 E4 E12 E19 E6 E20 E8 E9 1year 2years 3years 4years 5years
S.1 24.00% 0 1 1 1 1 1 1 0 0 1 −1.30 −1.39 −1.22 −1.05 −1.33
S.2 10.48% 0 1 1 1 0 1 1 0 0 1 −1.72 −1.82 −1.73 −1.50 −1.78
S.3 8.58% 0 1 1 1 1 0 1 0 0 1 −1.57 −1.66 −1.52 −1.39 −1.62
S.4 4.12% 0 1 1 1 1 1 0 0 0 1 −1.01 −1.10 −0.85 −0.74 −1.01
S.5 3.24% 0 1 1 0 1 1 1 0 0 0 −0.51 −0.46 −0.49 −0.41 −0.49
S.6 2.88% 0 1 0 1 1 1 1 0 0 1 −0.95 −0.73 −0.56 −0.46 −0.65
S.7 2.61% 0 1 1 1 1 1 0 0 0 1 −0.70 −1.10 −0.85 −0.74 −1.01
S.8 2.33% 0 1 1 1 0 0 1 0 0 1 −1.99 −2.09 −2.03 −1.84 −2.07
S.9 1.89% 0 1 0 1 0 1 1 0 0 1 −1.38 −1.46 −1.31 −1.11 −1.37
S.10 1.22% 0 1 1 1 1 0 0 0 0 1 −1.28 −1.37 −1.15 −1.09 −1.30
Source:Authors(2015).
tocharacterizethisscenario.Thesameauthorscharacterizethe idealscenarioas oneinwhichthefavorableeventsoccurand theunfavorableonesdonotoccur.Thisstudyhasnotidentified anyidealscenarioforthenextfiveyears.
FollowingtheintegrationofProspectiveScenariosfor Sys-tem Dynamicswill be displayed.The goal isto quantifythe generatedscenarios.Inthiscontext,beforethisintegrationstep “choiceofthedependentvariable”wasincludedinthemodel, inwhichthe“registrationoflightvehicles,mediumandheavy freightintheregion”wasthevariableidentifiedtorepresentthe segment’sbehavioroverthenextfiveyears.
TheintegrationofProspectiveScenariosandSystem Dynamics
TheintegrationofProspectiveScenariosandSystem Dynam-ics were used in the first ten scenarios (the probability of occurrence=61.35%). Experts participating in the following developmentsandwereconsultedontheimpactonthe regis-trationoffreightvehiclesinonlyseveneventsforthefollowing reasons:
1 Previouslymadeitamultivariateanalysisteneventsbetween theyears2003and2014.Thisanalysiswasperformedusing averages,minimum,mediumandmaximum,anditwasfound thattherewereonlytwoeventrecords(LawImpactof12619, whichregulatesroadfreighttransportandincreasedcostof transport),thatis,thelaw waspromulgated on30/04/2012, andtheimpactonthecostscanonlybeobservedintheyears 2013and2014,afactthatresultedintheexclusionofthefirst eventofmultivariateanalysis.
2 Subsequently,basedonanalysisofR2,therehavebeenthe eventsthatpresentedthebestfitinthemodel.Itwasobserved that wouldbe the events“Increasinglocal(COREDE Pro-duction) agricultural production”, “Rio Grande do Sul’s economyFall“, “Increasing costsof vehiclemaintenance”, “Increasing interest rate”,and “Unsafe roads in COREDE Production”.However,fewereventsweresought(or indepen-dentvariables),whichwouldnotsignificantlyreduceR2.This
procedureisimportanttopreventtheexistenceofinteraction betweenvariables.
3 AnalyzingTHEVALUEofeachvariable,itwasfoundthat theevents“UnsaferoadsinCOREDEProduction”and“Rio GrandedoSul’seconomyFall”hadahigher5%number,itis evidencedthatwerenotsignificantfortheregressionmodel becauseithadpreviouslybeengivenamaximumerrorof5% significance.Thus,theywerealsoexcluded.
4 Finally,wedesignedanewregressionmodelwithoutevents “Increasing local (COREDE Production) agricultural pro-duction” and“Rio Grandedo Sul’seconomyFall”. In this regression model only events “Increasing costs of vehicle maintenance“, “Increasing interest rate”, and “precarious Indexhighways”wereconsidered,andtheregression equa-tionwascharacterizedasfollows:
CVR=33659+(0.230×VMC)
+(570×IR)−(6626×PIH)
whereCVR=freightvehicleregistration;VMC=vehicle main-tenance cost; IR=interest rate; PIH=precarious index of highways.
Thisequationisimportantbecauseitdetermineswhichevents impacts(inputoroutput)onvehiclerecordsaccordingto simula-tionmadebySD.Importantlytheteneventswerenotconsidered inthequalitativeassessment(nottochangetheprobabilitiesof scenarios),butthethreeregressionequationevents(14,20:08) receivedvalue=0(ornonoccurrence)becausetheyareonlyto enterinthesystemasdrawnratesoftheregressionequation.
The remaining seven events were submitted to scores assignedbyexperts,whichaimtoindicatetheimpacttheycause onfreightvehiclesregisteroverthenextfiveyears.Table2shows theevents14,20and8,withvalue=0(notoccurring)inall sce-narios.Table2alsoshowstheresultofcalculatingtheimpactof taxonvehicleregistrationforthenextfiveyears,whichisdone bymultiplyingtheoccurrenceornon-occurrenceofevents,by theaveragegradeoftheexperts.
Table3
FreightvehicleregistrationpredictforCOREDEproduction(2016–2020).
YEAR Freightvehicleregistration(unit)
2016 25.203
2017 23.957
2018 22.978
2019 22.094
2020 21.060
Variation%between2016and2020 −16.44%
Source:Authors(2015).
randomly chooseoneof theten possiblescenarios. Sincethe probabilityof thefirsttenscenariosis61.35%,itwas consid-eredthispercentageas100%,andaccumulatedprobabilitiesof others.Thisenabledeachrandomizationtoberandomlychosen oneoftenpossible.
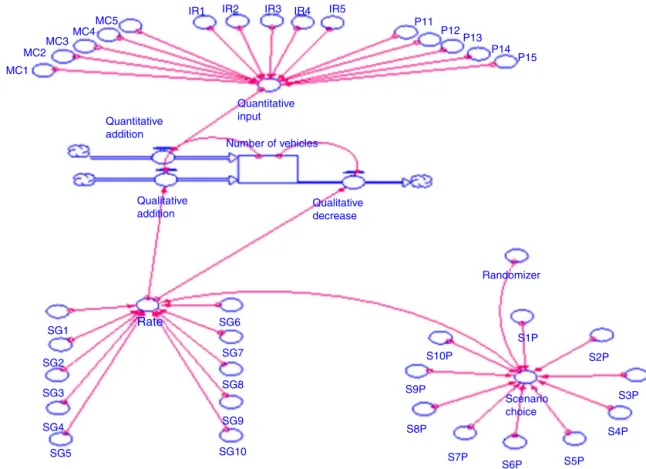
Fig.4showsthebeginningofthesimulationthatismadeby the“randomizer”andthatisinterconnectedwiththe probabili-tiesofthescenarios(S1P,S2P...SnP).Chosenonescenario,a connectionismadewiththeaveragegradeoftheexperts(SG1, SG2...SGn).Thesemeansmaybepositiveornegative.Being positiveitwillbedirectedtothe“qualitativeincrease”;if neg-ativetothe“qualitativedecrease”.Thisisthequalitativeflow simulationthatisatthebottomofFig.4.
Atthe topof Fig.4 the “quantitativeflow”is shown.The eventsofvehiclemaintenancecost(MC1,MC2...MCn), inter-estrate(IR1,IR2...IRn)andprecariousnessindexofhighways (PI1, PI2 ... PIn) received values were calculated by linear regression for the nextfive years. All these eventsare inter-connectedwiththe“quantitativeentry”,whichistheequation thatshowsinfluencefortheseevents,andcorrelatesthevehicle registration,demonstratedabove.Thequalitativeand quantita-tiveprocessareflows thatserve topredict the freightvehicle registrationforthenextfiveyearsinCOREDEProduction/RS. InTable3,theresult ofthe projectionisdisplayed forthe next5yearsthroughtheSD.
Table3projectsadeclineinvehicleregistrationchargesof 16.44%.Thisslowdowncanbeexplainedbecauseoftheseven eventsevaluatedbyexperts,fivewereunfavorabletothesector, resultinginnotes(orrates)alwaysnegativeintherandomization. Asfor the rates of the threequantitative events werealways positive,butwithless impact.ThecurrentBrazilianeconomy mayexplaintheperceptionofexpertsintheallocationofgrades and, consequently,the resultof thesimulation.The regionof COREDEproductionisnotdisconnectedfromthecurrentpolicy thatinhibitsvarioussectorsoftheBrazilianeconomy,including transportation.
Tobetterevaluatetheresults,inthefollowingTable4itwas madeacomparisonbetweentheestimatesoftheSDwith pro-jectionscalculatedusing freightofvehicleregistrationdatain theregioninthelast8years.Inthisprojection,wereachedthe followingequationoffirstdegreewithR2=0.9355:
Y =1.1285X+19.829
Table4showstheoppositebehaviorbetweenthesimulations madebySD,withtheregressionoffirstdegree.Theregression modelconsideredonlyhistoricaldataof thepast8 years,the
Table4
ComparisonofthepredictionsmadebySDwithcalculationsoffirst-degree equation.
YEAR PredictionmadebySD Regressionoffirstdegreeprediction
2016 25.203 29.985
2017 23.957 31.114
2018 22.978 32.242
2019 22.094 33.371
2020 21.060 34.499
Source:Authors(2015).
Table5
FreightvehicleregistrationonCOREDEproduction.
Years Vehicleregister Brazil’sGDPgrowth%
2003 29.709 1.2
2004 24.052 5.7
2005 25.082 3.1
2006 26.026 4
2007 21.639 6
Source:FoundationofEconomicsandStatisticsofRioGrandedoSul(2015).
registrationoffreightvehicleswasonanincreasingphase.Inthe simulationmadebytheSDestablishedatemporalcut(2015), most of whose eventwascharacterized as unfavorabletothe objectofstudy.Anotherwaytovalidatethepredictions made bytheSDwouldidentifythelastperiodswithhistoricalseries that projectedareductionintheregistrationofvehiclesinthe regionandconfrontwhatarethereasonsforthisperformance. Thus,itwaspossibletoselectbetweentheyears2003and2007, asshowninTable5.
Table5alsoshowsasignificantlevelofGDPthatshowsa similarbehaviorofthecurrentmacroeconomic momentumof theBrazilianeconomy.Basedonthishistoricalseries,therewas aprojectionfor theyears2008to2010,bothusing theSDas linearregression,andcomparedwiththeactualregistrationof vehiclesintheprojectionyears,accordingtoTable6.
Table6
Comparisonofpredictsfortheregistrationoffreightvehiclesbetweentheyears2008to2012.
Years Effectiveregistration SDprediction Regressionprediction SDerror Regressionerror
2008 22.391 25.203 29.985 2.812 7.594
2009 23.111 23.957 31.114 846 8.003
2010 23.962 22.978 32.242 −984 8.280
2011 24.298 22.094 33.371 −2.204 9.073
2012 25.967 21.060 34.499 −4.907 8.532
2.351 8.296
Source:Authors(2015).
Conclusions
Risksanduncertaintiesofthe futureneedtobeminimized forgreater efficiencyinthe useofresources,bothpublic and private.Thisisthemeaningofdevelopmentmodelsandthe per-manentsearchfortheirimprovements.Thisstudyworkedthis anxietythatsurroundsdecisionmakersandstructuredan inno-vativemodelforscenarioanalysisthatwassuccessfulwiththe integrationof existing tools,butused individually in suppor-ting decision-makingoninvestments– Prospective Scenarios (Grumbach method) and system dynamics (hard modeling). Alongwiththeinnovationofintroducingthemultivariate anal-ysis by experts, which can be highlighted as an academic contributionof long-rangegiventhedifferentareasof knowl-edge that can make use of these results, the model points objectivelyandclearlytheeventsandredirectingactionsmore impactful,aninteractivesysteminwhichnewpredictionsare likelytobedevelopedthroughthegeneratedscenarios.
Inthiscontext,themodelbringssignificantcontributionsto professionalplanningandcorporateandgovernmentstrategists, sinceitprovedeffectiveinreducingrisksandfutureuncertainties whenitevaluatedthegreaterimpactofeventsintheevolutionof theanalyzedsystemwiththeparticipationofexperts.Themodel alsoenablestheexplorationandsimulationbythecharacteristics ofthetoolsthatintegrateswheninvestmentsinfluencedbymany variablesare analyzed andit was validated withroadfreight transportdatafromstateofRioGrandedoSul.
Theintegrationproposedinthisstudyisdifferentfromother modelsofintegrationbecauseitprovedtobepracticaland demo-cratic, using tools that allowed equality of opinions, both in construction and in the analysis and predictions levels. This feature also differsfrom otherdecision-makingmodels, as it facilitatesinterdisciplinary,fundamentalfeaturewhenyouwant todeepenontheinvestmentanalysisinthefuture. The point-ing macroeconomic, regional and sectoral events require the exchangeofknowledgeindifferentareas,whatstrengthensthe analysestobemoreconsistentinthoseeventsthatcanactually interfereintheanalyzedsegment.
Inthissense,themodelalsoallowsforgreaterweightonthe opinionofleaderswhocouldeventuallycompromisethe evolu-tionoftheanalyzedsystem.Thisactionwasmadepossibleby theavailabilityoftheDelphimethod,whichconstantlymonitors andreviewstheopinionsofexperts.
Itisrecognizedthat themodel hasless possibilityof con-tribution when applied in situations where there are greater macroeconomiceventsofnegativeimpact,asitlimitstheaction
of managers in decision-making, making it difficult to redi-rect thesectoranalyzed, Oneexample ishigh-tech segments, aimedattheforeignmarket,Insuchcases,whenthereismore macroeconomiceventsofnegativeimpact,theactionofdecision makerswillbelimiteddecisionsthatcanlittlealterthefutureof theindustry,Themodelalsoshowedtheneedforfuturestudiesto establishgreaterconsistencyinpredictions,Thesestudiescould correlatethebehaviorofmacroeconomic,sectoralandregional variablesinthepast,withtheindustry’sbehaviorunderstudy.
Conflictsofinterest
Theauthorsdeclarenoconflictsofinterest.
References
Araújo,M.A.R.(2013).Modeloemdinâmicade sistemasparagestãoda capacidadedeaeroportosbrasileirosDissertation(MasterinProduction Engineering).Natal,RN:UniversidadeFederaldoRioGrandedoNorte. Centro de Tecnologia. Programa de Pós-Graduac¸ão em Engenharia da Produc¸ão.,96f.
Blois,H.D.,&Souza,J.C.(2008).Cenáriosprospectivoseadinâmicade sistemas:Propostadeummodeloparaosetorcalc¸adista.RevistaDe Admin-istra¸cãoDeEmpresas,48(3),35–45.
Buarque, S.C.(2003,February).Metodologiae técnicasdeconstru¸cãode cenáriosglobaiseregionais.TextosParaDiscussão,939.IPEA.
Fundac¸ãodeEconomiaeEstatística.Retrievedfromwww.fee.rs.gov.br. Godet,M.(1993).Manualdeprospectivaestratégica:Daantecipa¸cãoàac¸cão.
Lisbon:DonQuixote.TraslationfromJ.FreitaseSilva
Ithink,platafornstella[Computersoftware].Retrievedfromwww.iseesystems. com.
Lemenih,M.(2014).ModellingthefutureofBoswelliapapyriferapopulation anditsfrankincenseproduction.JournalofAridEnvironments,105,33–40.
Maani,K.E.,&Cavana,R.Y.(2000).Systemthinkingandmodeling: Under-standingchangeandcomplexity.NewZealand:PearsonEducationNew Zealandlimited.
Marcial,E.L.,&Costa,A.J.L.(2012).Ousodecenáriosprospectivosna estratégiaempresarial:evidênciaespeculativaouInteligênciaCompetitiva?
Enanpad,Anais:EletrônicosEnanpad,Campinas.
Marcial,E.C.,&Grumbach,R.J.S.(2012).Cenáriosprospectivos:como construirumfuturomelhor(5thed.).RiodeJaneiro:FGV.
Mattos,R.S.de.(2008).Integrac¸ãodemodeloseconométricoede insumo-produtoparaprevisõesdelongoprazodademandadeenergianoBrasil.
EstudosEconômicos,38(4),675–699.
Nishikawa,W.E.(2014).Modelodeestressemacroeconômicodainadimplência parabancosdeatacado.
Prado,N.,Moya,J.,&Vatopoulos,A.K.(2013).Prospectivescenarioson energyefficiencyandCO2emissionsintheEuropeaniron&steelindustry.
Petten:EuropeanCommission.
Ratcliffe,J.,&Krawczyk,E.(2011).Imagineeringcityfutures:Theuseof prospectivethroughscenarios inurban planning.Futures, 43,642–653. Retrievedfrom:www.elsevier.com/locate/futures
Schwartz,P.(2000).Aartedavisãodelongoprazo:planejandoofuturoemum mundodeincertezas.SãoPaulo:BestSeller.
Sverdrup,H.U.,Ragnarsdottir,K.V.,&Koca,D.(2014).Onmodellingthe globalcopperminingrates,marketsupply,copperpriceandtheendofcopper reserves.Resources,ConservationandRecycling,87,158–174.
Souza, M.N.(2010).Dinâmicadesistemaseamodelagemcomousodo programaSTELLAdosrecursoshídricosdabaciadoRioPreto,afluente doRioParacatu.RevistaIbero-AmericanadeCiênciasAmbientais,1(1), 16–42.