Nonlinear Dynamis Time Series Analysis of Chaoti
Current Osillations in a Semi-insulating GaAs Sample
R.L. daSilva,R.M. Rubinger, A.G. de Oliveira,and G.M. Ribeiro
Universidade Federalde MinasGerais,ICEX,Departamento deF
isia,
CP.702,30123-970, BeloHorizonte MG, Brazil
ReeivedonApril,2001
Wehavearriedoutourexperimentsonasemi-insulatingGaAssamplegrownbylowtemperature
MoleularBeamEpitaxy. Threeparameterswereusedtonetunetheexperiments,namely,
tem-perature,illumination,andappliedbias.Wehaveusedpowerfultoolsoftimeseriesanalysisinorder
toassessthe embeddingdimensionthroughnear falsenearest neighbors. Wehavealso measured
themaximumLyapunovexponentandtheorrelationdimension[1℄. Themainontributionwasin
presentingnewexperimentaldataanditsanalysiswhihpresentsself-generatedhaos.
I Introdution
Thetemporalevolutionofadynamisystemwith
spon-taneous osillations an be measuredand reorded in
the form of a time series. Our work onerns the
ex-perimentalstudyofhargetransportinsemi-insulating
(SI) GaAs samples grown by low temperatures (LT)
moleular beam epitaxy (MBE). As aonsequene of
the low temperature growth, suh samples present a
high density of As anti-site defets(around 10 19
m 3
)
[2℄. Under intense bias these samples exhibit
sponta-neousurrentosillationsandinertainonditionsthey
presenthaotibehavior.
Lowfrequenyosillations(LFO)aredetetedinthe
externalurrentofsemiondutordevies in therange
of sub-Hz to few hundreds Hz. Insidethe devie they
onstitute self-organizedspatio-temporal strutures of
thetypeofeletrielddomainsmovingfromthe
ath-odeto theanode. Theirlowfrequenyosillationsare
easyto observeandanalyzesine nosophistiated
in-strumentationisneededinordertoarryout
measure-ments. Itisalso worthto mentionthatsemiondutor
isoneoftheeasilyreproduiblesystemstothestudyof
nonlineardynamisanddeterministihaoti
phenom-ena. Inthisway,LFOinsemi-insulating (SI)material
areagoodthemeforsuhstudies.
Wehavestudied theI(V)harateristisof aGaAs
samplelookingforLFOandroutetohaosoftheLFO
[3,4,5℄. Semiondutorswithnegativedierential
on-dutivity(NDC)presentosillatorybehaviorassoiated
with movinghigh eletri eld domains that build up
spontaneously. Suhosillationsourduetotheeet
ofeld enhanedtrappingofarriersintrodeep traps.
theeletriurrentofsamplesofGaAs. Inaontextof
nonlineardynamis,ourplanwastoharaterizehaos,
orrelation dimension and the maximal Lyapunov
ex-ponentoftheseseries.
II Experimental Details
ToinvestigatehaotiLFOonthesemi-insulating
har-ateristis of GaAs samples we have arried out I(V)
measurementsin aGaAs epilayergrown byMoleular
BeamEpitaxyatlowtemperatureonthetopofaLEC
GaAs substrate. First,a1m thikbuer layer,
non-intentionallydoped,presentingap-typeharateristi,
wasgrown. After that, the temperature was redued
to 300 o
C and a 2m thik layer was grown [6℄. The
lowtemperaturegrowthisresponsibleforthehigh
den-sityof the anti-site defet, whih wasestimated to be
around10 19
m 3
[2℄. Itiswellknownthatthepresene
of these defets is responsible for the semi-insulating
harateristisofthesample[7℄.
AfterthesamplegrowthtwoInontatswereplaed
500mapart. Thenthesamplewasplaedin asoket
inside ryostat,and lightened with aGaAs LED. The
photonux asmeasuredbyreplaingthesamplewith
a harged-opled devie (CCD) and was found to be
P2,2x10 10
xI (photons/m 2
.s), where I is theurrent
throughtheLEDinmA.Althoughtheassemblyofthe
measurementiruitisquitesimple,itwasneessaryto
takeareofrandomnoise,analogtodigitalonversion
error, andthe line of 60Hz. Themeasurementsof the
I(V)urvewerearriedatmanytemperatureand
illu-mination onditions. For theappearane ofLFO itis
thedloadlineofaproperseriesresistorutstheI(V)
urveinthree dierentpoints. Twoofthemdenethe
boundaries (i.e., the amplitude) of the LFO and the
other,whihstaysintheNDCregion,generatesthe
in-stabilityonditionswhihgivesrisetotheosillations.
Asworktoolinthisharaterizationoftimeseries,
we used a software pakage (freeware) well-known as
projet TISEAN [8, 9℄. This pakage is distributed
freely throughawebsite andit wasdeveloped by
peo-ple withreognized internationalrespetability,being,
in thatway,reliable.
III Results
TheanalysisofaLFOmeasurementwasarriedoutfor
anappliedbiasof35.5V,at200K,andunder
illumina-tion with 40mA through the LED. Figure 1 presents
the false neighbor plot. Figure 2presents the
attra-tor. Figure3presentstheLyapunovexponent. Figure
4 shows the orrelation dimension. Figure 5 presents
thePoinaremap.
Figure1.ResultsofFalseNeighbors.
Fig. 1desribestheminimumembeddingdimension
toreonstruttheattratorwhihisdeterminedbythe
falseneighborsmethod. Forthisexperimentaltime
se-ries,thismethod indiatesanembedding dimensionof
4. Although thesuggestedembedding dimensionis 4,
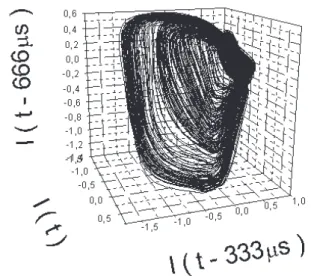
the attrator was represented in a three-dimensional
statespaeinFig. 2. Aredutionintheembedding
di-mensionfrom 4to3isquitereasonablesinethevalue
4 ouldbeinuenedby intrinsinoiseof the sample,
Figure2. Attratorreonstrution ina threedimensional
statespae.
Fig. 2exhibitstheattratorreonstrutedfromthe
timeseriesin athree-dimensionalstatespaewiththe
threevetorsobtainedusing adelayof10stepsin the
timeseries.
Figure3. Lyapunovexponentasafuntionofthe
embeddingdimension.
Fig. 3showsavalue of 1.24for theLyapunov
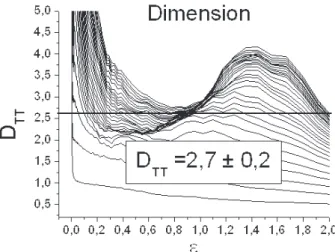
Figure4.Correlation Dimensionestimative.
Figure5. PoinareMap.
Fig. 4 exhibits the orrelation dimension lose to
2.7. The Poinaremappresentedin Fig. 5showstwo
points agglomeratealong the straightline x=y, whih
indiatetwoxedpointsofthesystem. Also,itis
pos-sibletoobserveadispersionofpointsrossingthey=x
line,resemblingaPoinaremapforahaotiattrator.
IV Disussion
Using the TISEAN pakage [8, 9℄, it was possible to
haraterize the experimental time series. The
mu-tual information and the false nearest neighbors
pro-vided us with the orret form for reonstruting the
attrator[1, 10℄. Theembedding dimensionbetween 3
and4representsagoodresult,sineitisverydiÆult
toobtainexperimentalnoisefreedataonahighly
resis-tivesample. Theobtainedvaluefortheembedding
di-mensionsuggestsalearattratorstruture. Thevalue
the experimental system may havethree or four
free-dom degrees. Thevalue of the Lyapunov exponentis
also anindiationthat thesystembehaveshaotially
and,thus,thephysialrelationshipbetweenthesystem
variablesandthefores(orelds)isnonlinear.
V Summary
Low Frequeny osillationsin a semi-insulating GaAs
sample were measured and analyzed with respet to
itsnonlineardynamialharateristis. Dueto areful
measurementsitwaspossibletoreonstrutattrators
from data with low noise. The values we havefound
were1.240.02 bits/sfortheLyapunovexponentand
2.70.2fortheorrelationdimension.
Toourknowledge,therearenomeasurementsoflow
frequenyosillationsinhigh resistivesampleswithso
favorable signal to noise ratio. The good quality of
themeasurementresultsenabledustoobtainaurate
values of the Lyapunov exponent and orrelation
di-mension,andalsoalearPoinaremap. Withsuh
re-sultsit ispossibletoinfertheeetivegenerationand
reombination proesses ourring in this sample and
writedynamialequationforsimulationsofthesample
dynamis. Weintendpursuefurtherinordera
ompar-isonbetweentheexperimentsandthenumerial
simu-lations.
Aknowledgments
WewouldliketoaknowledgetheBrazilianagenies
CNPq, FINEP, CAPES, and FAPEMIG for nanial
support.
Referenes
[1℄ H.D.I.Abarbanel,R.Brown,J.J.Sidorowih,andL.Sh.
Tsimring,Rev.Mod.Phys.65,1331(1993)
[2℄ K.Krambrok,M.Linde,andJ.M.Spaeth,D.C.Look,
D. Bliss,and W.Walukiewiz, Semiond.Si. Tehnol.
7,1037(1992).
[3℄ G.N.MaraasandD.A.Johnson,Appl.Phys.Lett.46,
305(1985).
[4℄ E.Sholl,Phys.Rev.B34,1395(1986).
[5℄ E.Sholl,Phys.Srip.T29,152(1989).
[6℄ R.M.Rubinger,Braz.Jour.Phys.29,797(1999).
[7℄ J.S. Blakemore and S. Rahimi, Semiondutors and
Semimetals(Aademi,NewYork,1984),vol.20,234
[8℄ R.Hegger,H.Kantz, andT.Shreiber,CHAOS9, 413
(1999).
[9℄ TISEAN software in
http://www.mpipks-dresden.mpg.de/tisean
[10℄ H. Kantz and T. Shreiber, Nonlinear Time
Se-ries Analysis. CambridgeUniversity Press, Cambridge