TCD
8, 4581–4617, 2014Surface elevation and mass changes of all
Swiss glaciers
M. Fischer et al.
Title Page
Abstract Introduction
Conclusions References
Tables Figures
◭ ◮
◭ ◮
Back Close
Full Screen / Esc
Printer-friendly Version Interactive Discussion
Discussion
P
a
per
|
Discus
sion
P
a
per
|
Discussion
P
a
per
|
Discussion
P
a
per
|
The Cryosphere Discuss., 8, 4581–4617, 2014 www.the-cryosphere-discuss.net/8/4581/2014/ doi:10.5194/tcd-8-4581-2014
© Author(s) 2014. CC Attribution 3.0 License.
This discussion paper is/has been under review for the journal The Cryosphere (TC). Please refer to the corresponding final paper in TC if available.
Surface elevation and mass changes of all
Swiss glaciers 1980–2010
M. Fischer1, M. Huss1,2, and M. Hoelzle1
1
Department of Geosciences, University of Fribourg, 1700 Fribourg, Switzerland 2
Laboratory of Hydraulics, Hydrology and Glaciology (VAW), ETH Zurich, 8093 Zurich, Switzerland
Received: 14 August 2014 – Accepted: 20 August 2014 – Published: 29 August 2014 Correspondence to: M. Fischer ([email protected])
TCD
8, 4581–4617, 2014Surface elevation and mass changes of all
Swiss glaciers
M. Fischer et al.
Title Page
Abstract Introduction
Conclusions References
Tables Figures
◭ ◮
◭ ◮
Back Close
Full Screen / Esc
Printer-friendly Version Interactive Discussion
Discussion
P
a
per
|
Discus
sion
P
a
per
|
Discussion
P
a
per
|
Discussion
P
a
per
|
Abstract
Since the mid-1980s, glaciers in the European Alps have shown widespread and accel-erating mass losses. This article presents glacier-specific changes in surface elevation, volume and mass balance for all glaciers in the Swiss Alps from 1980 to 2010. Together with glacier outlines from the 1973 inventory, the DHM25 Level 1 Digital Elevation
Mod-5
els (DEMs) for which the source data over glacierized areas was acquired from 1961 to 1991 are compared to the swissALTI3D DEMs from 2008–2011 combined with the new Swiss Glacier Inventory SGI2010. Due to the significant differences in acquisition date of the source data used, resulting mass changes are temporally homogenized to directly compare individual glaciers or glacierized catchments. Along with an in-depth
10
accuracy assessment, results are validated against volume changes from indepen-dent photogrammetrically derived DEMs of single glaciers. Observed volume changes are largest between 2700–2800 m a.s.l. and remarkable even above 3500 m a.s.l. The mean geodetic mass balance is−0.62±0.03 m w.e. yr−1for the entire Swiss Alps over the reference period 1980–2010. For the main hydrological catchments, it ranges from
15
−0.52 to−1.07 m w.e. yr−1. The overall volume loss calculated from the DEM diff
erenc-ing is−22.51±0.97 km3.
1 Introduction
Fluctuations of mountain glaciers are known as a sensitive indicator for climatic changes (e.g. IPCC, 2013). The currently observed atmospheric warming caused
strik-20
ing mass loss of mountain glaciers all over the world (e.g. Zemp et al., 2009; Radićand Hock, 2014), which significantly contributes to present sea-level rise (e.g. Marzeion et al., 2012; Gardner et al., 2013) and affects the runoffregimes of glacierized catch-ments in different regions around the globe (e.g. Kaser et al., 2010; Huss, 2011; Sorg et al., 2012).
TCD
8, 4581–4617, 2014Surface elevation and mass changes of all
Swiss glaciers
M. Fischer et al.
Title Page
Abstract Introduction
Conclusions References
Tables Figures
◭ ◮
◭ ◮
Back Close
Full Screen / Esc
Printer-friendly Version Interactive Discussion
Discussion
P
a
per
|
Discus
sion
P
a
per
|
Discussion
P
a
per
|
Discussion
P
a
per
|
For glaciers of the entire European Alps, rapid mass loss and shrinkage is reported since the mid-1980s (e.g. Paul et al., 2011; Huss, 2012). Glacier area changes are documented by the comparison of consecutive inventories (e.g. Lambrecht and Kuhn, 2007; Diolaiuti et al., 2012). Mass balance data is available either from annual field measurements of individual glaciers using the direct glaciological method (e.g. WGMS,
5
2013), or from the comparison of the glacier surface topography of different years and a density assumption for converting volume to mass change (e.g. Abermann et al., 2009; Carturan et al., 2013). Together with the increasing number of digital elevation models (DEMs) available worldwide and the fact that also inaccessible areas and entire glacier systems can be measured, this so-called geodetic method has become a
pop-10
ular approach to derive surface elevation and mass changes for a large number of glaciers (e.g. Rignot et al., 2003; Larsen et al., 2007; Bolch et al., 2008; Berthier et al., 2010; Nuth et al., 2010; Gardelle et al., 2012a).
Paul and Haeberli (2008) analyzed the spatial variability of glacier elevation changes in the Swiss Alps between 1985 and 1999 by comparing the DHM25 Level 1 DEMs
15
(25 m resolution) created from topographic maps by the Swiss Federal Office of Topog-raphy (swisstopo) with the medium-resolution (90 m) Shuttle Radar TopogTopog-raphy Mis-sion (SRTM) DEM. Several factors that might have an important influence on the ac-curacy of glacier elevation changes derived from DEM differencing have, however, not been conclusively assessed in their study: differences in the reference years of the
sur-20
face elevation information used for individual regions, the problem of radar penetration into snow and ice (Dall et al., 2001; Gardelle et al., 2012b) and/or impacts of down-scaling DEMs to higher resolution (Gardelle et al., 2012b; Carturan et al., 2013). Fur-thermore, applying the medium-resolution SRTM DEMs in high-mountain areas might cause problems (cf. Berthier et al., 2006). In number, these regions are generally
dom-25
TCD
8, 4581–4617, 2014Surface elevation and mass changes of all
Swiss glaciers
M. Fischer et al.
Title Page
Abstract Introduction
Conclusions References
Tables Figures
◭ ◮
◭ ◮
Back Close
Full Screen / Esc
Printer-friendly Version Interactive Discussion
Discussion
P
a
per
|
Discus
sion
P
a
per
|
Discussion
P
a
per
|
Discussion
P
a
per
|
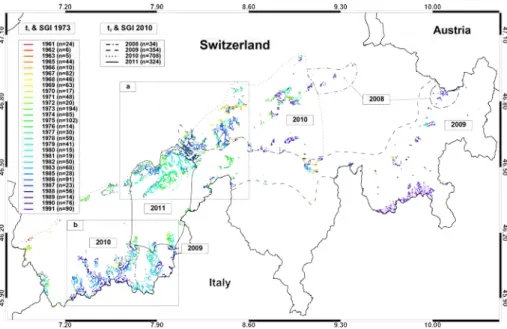
Due to the recent compilation of more detailed source data, we are able to present an extended re-evaluation of glacier-specific changes in surface elevation, volume and geodetic mass balance for every single glacier in Switzerland. We compare the DHM25 Level 1 DEMs dating from 1961 to 1991 over glacierized areas with the swissALTI3D DEMs from 2008–2011 and combine the former with the 1973 inventory (Müller et al.,
5
1976) and the latter with the new Swiss Glacier Inventory SGI2010 (Fischer et al., 2014). For direct comparison between individual glaciers or glacierized catchments, we temporally homogenize resulting mass changes to a consistent period. This is nec-essary due to significant differences in acquisition date of the source data used. We discuss various sources of possible error accompanying studies of this type, perform
10
an in-depth accuracy assessment of our results and validate them using independent volume changes from photogrammetrically derived DEMs. Furthermore, we comment on the controlling factors and the spatial variability of observed glacier mass changes.
2 Study region and datasets
2.1 Study region
15
The study area covers the entire Swiss Alps. In number, small, thin and rather steep ice patches and glacierets dominate (Haeberli and Hoelzle, 1995), but the majority of the ice volume is stored within only some few large valley glaciers (Farinotti et al., 2009). The total glacierized area mapped for 2010 is 944.3±24.1 km2, corresponding to an area change of−362.6 km2(−27.7 %, or−0.75 % yr−1
) since 1973 (Fischer et al.,
20
2014). After a short period of mass gain between the late 1970s and the mid-1980s, the Swiss glaciers generally showed rapid mass loss until today (Huss et al., 2010a).
2.2 Digital elevation models and glacier outlines
TCD
8, 4581–4617, 2014Surface elevation and mass changes of all
Swiss glaciers
M. Fischer et al.
Title Page
Abstract Introduction
Conclusions References
Tables Figures
◭ ◮
◭ ◮
Back Close
Full Screen / Esc
Printer-friendly Version Interactive Discussion
Discussion
P
a
per
|
Discus
sion
P
a
per
|
Discussion
P
a
per
|
Discussion
P
a
per
|
for which digitized contour lines and spot heights from the Swiss national topographic maps 1 : 25 000 were interpolated to a regular grid with 25 m grid spacing. The esti-mated vertical accuracy is reported to range between 3.7 and 8.2 m for rugged high-mountain topography depending on individual map sheets (Rickenbacher, 1999; swis-stopo, 2000). For glacierized areas, the dating of these contour lines is not
consis-5
tent with corresponding specifications given in the DHM25 Level 1 product information (cf. swisstopo, 2000). Therefore, we manually reconstructed the individual reference years of the surface topography att1 for every glacier by comparison of the DHM25
Level 1 contour lines with those from repeated updates of the 1 : 25 000 topographic maps of known reference years (http://s.geo.admin.ch/6f91341db). In addition to the
10
obvious regional differences int1, there is a certain trend towards earliert1 for small glaciers, for which surface contour lines were less frequently updated (Fig. 1). Re-cent glacier surface topography, i.e. at the end of the observation period (hereafter referred to ast2), is provided by the new 2 m resolution swissALTI
3D
DEMs. For areas above 2000 m a.s.l., they were created by stereocorrelation of 2008–2011
SWISSIM-15
AGE Level 2 aerial orthophotographs. For these areas, the vertical accuracy is±1 to 3 m (swisstopo, 2013). Comparisons of the DHM25 Level 1 and the swissALTI3DDEMs with available photogrammetrically derived DEMs of the same acquisition dates fort1
and t2 (Laboratory of Hydraulics, Hydrology and Glaciology (VAW), ETH Zurich,
un-published) show that for glacierized surface topography, the actual vertical accuracies
20
of both the DHM25 Level 1 and the swissALTI3D DEMs is likely much better in the glacier-wide mean (<±1 m) than supposed by the values taken from literature.
The surface area of individual glaciers att1is derived from the finalized digital version
of the Swiss Glacier Inventory 1973 (SGI1973; Maisch et al., 2000; Paul, 2004), which was originally compiled by Müller et al. (1976) from stereophotogrammetry-based
in-25
terpretation of aerial photographs acquired in early September 1973. The considerable time difference between the acquisition of the SGI1973 source data and individual DHM25 Level 1 DEMs used fort1 (Fig. 1) is acceptable as only small area changes
TCD
8, 4581–4617, 2014Surface elevation and mass changes of all
Swiss glaciers
M. Fischer et al.
Title Page
Abstract Introduction
Conclusions References
Tables Figures
◭ ◮
◭ ◮
Back Close
Full Screen / Esc
Printer-friendly Version Interactive Discussion
Discussion
P
a
per
|
Discus
sion
P
a
per
|
Discussion
P
a
per
|
Discussion
P
a
per
|
between 1973 and the mid-1980s (Glaciological Reports, 1960-2013; Paul et al., 2004). Fort2, the glacier outlines originate from the latest Swiss Glacier Inventory SGI2010
derived by manual digitization from high-resolution (25 cm) aerial orthophotographs acquired between 2008–2011 (Fischer et al., 2014). Applying the SGI2010 and the swissALTI3DDEMs as source data fort2is ideal because their acquisition date is mostly 5
identical for individual glaciers.
2.3 Validation data
Time series of surface mass balance for glaciers of different type and size class cov-ering the entire Swiss Alps over the last decades (Huss et al., 2010a, b) are used to validate the geodetic mass balances presented here. These series rely on ice
vol-10
ume changes derived from high-accuracy photogrammetrical DEMs for sub-decadal to multi-decadal time intervals (Bauder et al., 2007). By using a distributed mass balance modelling approach including comprehensive field data (winter accumulation, summer ablation and discharge measurements), annual mass balance series were calculated that agree with the observed geodetic mass changes.
15
3 Methods
3.1 Calculation of glacier volume change and average mass balance
Prior to the calculation of surface elevation changes, the swissALTI3D DEMs were resampled to a grid cell size of 25 m (i.e. equal to the resolution of the DHM25 Level 1). Due to the identical coding scheme applied to both glacier inventories,
el-20
TCD
8, 4581–4617, 2014Surface elevation and mass changes of all
Swiss glaciers
M. Fischer et al.
Title Page
Abstract Introduction
Conclusions References
Tables Figures
◭ ◮
◭ ◮
Back Close
Full Screen / Esc
Printer-friendly Version Interactive Discussion
Discussion
P
a
per
|
Discus
sion
P
a
per
|
Discussion
P
a
per
|
Discussion
P
a
per
|
The glacier-individual total volume change∆V (m3) for the respective survey period was calculated as follows:
∆V = ∆z·A1973, (1)
where ∆z is the average elevation change calculated from the difference between
5
the swissALTI3D and the DHM25 Level 1 DEMs within the perimeter covered by the glacier in 1973 (A1973). Then, the area-averaged specific geodetic mass balance rate
(m w.e. yr−1) was calculated with:
˙ B=
∆V ·f∆ V
A·∆t
, (2)
10
wheref∆V is the density of volume change used to transform∆V into a mass change,
A the average area between 1973 and 2010 calculated as (A1973+A2010)/2, and
∆t the length of the observation period (t2−t1) in years. We hereafter refer to the area-averaged specific geodetic mass balcance rate as average mass balance. The conversion factor f∆V might vary from glacier to glacier, depending on the length of
15
the observation period, the respective mass balance and the firn compaction history (Huss, 2013). Due to the fairly long observation periods, f∆V is set as a constant of
850±60 kg m−3, which is consistent with other studies (Sapiano et al., 1998; Fischer, 2011; Zemp et al., 2013).
The significant regional differences in the length of the observation periods (Fig. 1)
20
imply that glacier-individual average mass balances ˙Bg derived from the DEM diff er-encing can not be directly compared to each other. In order to homogenize the glacier-individual observation periods to one comparable time interval we make use of the dataset by Huss (2012) providing annual mass balance variability extrapolated to the entire European Alps based on a combination of all available mass balance data
cover-25
TCD
8, 4581–4617, 2014Surface elevation and mass changes of all
Swiss glaciers
M. Fischer et al.
Title Page
Abstract Introduction
Conclusions References
Tables Figures
◭ ◮
◭ ◮
Back Close
Full Screen / Esc
Printer-friendly Version Interactive Discussion
Discussion
P
a
per
|
Discus
sion
P
a
per
|
Discussion
P
a
per
|
Discussion
P
a
per
|
˙
Bg from the mountain-range mean (Huss, 2012) over the respective observation pe-riodBt2−t1 is used to temporally homogenize mass changes (Fig. 3). The annual mass
balanceBi,g for yeari and any glaciergis thus calculated with:
Bi,g=Bi,mr+B˙g−Bt2−t1, (3)
5
whereBi,mr is the mean mountain-range mass balance for an individual year i from
Huss (2012). Because 2010 is the reference yeart2for most of the investigated glacier
entities and the mean observation period is ≈30 yr (Fig. 1), the hydrological years 1980/81–2009/10 are defined as the reference observation period over the entire Swiss Alps over which resulting geodetic mass balance rates for individual glaciers are
com-10
pared and analyzed.
3.2 Analysis of controls
Averaged over representative samples and observation periods, glacier area and ele-vation changes are usually in agreement with changes in air temperature and precip-itation recorded over the investigated areas and time intervals (e.g. Abermann et al.,
15
2009; VanLooy and Forster, 2011; Carturan et al., 2013). Within a mountain-range and despite similar climatic changes, the differences in long-term mass balance can however be significant between individual – and even adjacent – glaciers (e.g. Kuhn et al., 1985; Larsen et al., 2007; Huss et al., 2010a; Abermann et al., 2011). Different factors have been identified which can, however, only to a certain extent explain this
20
variability. For instance, the glacier hypsometry, i.e. the distribution of glacier area and volume with altitude, plays an important role (Furbish and Andrews, 1984; Benn and Evans, 2010). Also, the characteristic glacier response time and dynamic adjustment to a certain climatic forcing varies with glacier size and affects the specific mass bal-ance (Jóhannesson et al., 1989; Huss et al., 2012). Larger (and flatter) glaciers are
25
TCD
8, 4581–4617, 2014Surface elevation and mass changes of all
Swiss glaciers
M. Fischer et al.
Title Page
Abstract Introduction
Conclusions References
Tables Figures
◭ ◮
◭ ◮
Back Close
Full Screen / Esc
Printer-friendly Version Interactive Discussion
Discussion
P
a
per
|
Discus
sion
P
a
per
|
Discussion
P
a
per
|
Discussion
P
a
per
|
situated in cirques, niches and below headwalls react faster to climatic changes (Kuhn, 1995), but their individual response to the latter is – in relative terms – even more variable than for larger glaciers (Carturan et al., 2012). Furthermore, local topographic and microclimatic factors are important for the behaviour and dynamics of mountain glaciers in general (e.g. Benn and Lehmkuhl, 2000; Oerlemans, 2010), and for very
5
small glaciers in particular (e.g. DeBeer and Sharp, 2009; Hughes, 2009). These fac-tors can be parameterized with geometrical indices which are related to the observed variability in long-term mass changes (Huss et al., 2012).
In order to identify the controlling factors and to better understand the spatial variabil-ity of the observed surface elevation and mass changes, a correlation analysis between
10
the average mass balance over the reference period 1980–2010 and classes of mean area 1973–2010, median elevation, slope of the glacier terminus (mean slope over the lowermost 25 %), and dominant aspect, hereafter referred to as mean aspect, was per-formed. These four geometrical indices were shown to be able in explaining some of the variability in observed mass balances (e.g. Huss, 2012).
15
4 Accuracy assessment and validation
4.1 Uncertainty
The uncertainty in surface elevation, volume and mass changes presented in this study is mainly given by the uncertainty related to the two DEMs used. The latter, σ∆z, is defined as:
20
σ∆z=±
q
σDEM2
1
+σ2
DEM2. (4)
The uncertainties in the DHM25 Level 1 DEMs, σDEM1, and the swissALTI 3D
DEMs, σDEM2, are independent of each other and given by their vertical accuracies. Based
on the values assigned by swisstopo (2000), the mean estimated vertical accuracies
TCD
8, 4581–4617, 2014Surface elevation and mass changes of all
Swiss glaciers
M. Fischer et al.
Title Page
Abstract Introduction
Conclusions References
Tables Figures
◭ ◮
◭ ◮
Back Close
Full Screen / Esc
Printer-friendly Version Interactive Discussion
Discussion
P
a
per
|
Discus
sion
P
a
per
|
Discussion
P
a
per
|
Discussion
P
a
per
|
reported for each of the individual Swiss national topographic map 1 : 25 000 sheets are taken asσDEM1. They are generally smaller than±10 m in the central Alps and below
±5 m in the Prealps (swisstopo, 2000). For the swissALTI3DDEMs above 2000 m a.s.l.,
the vertical accuracy is between±1 to 3 m (swisstopo, 2013). Therefore, the average of±2 m is assumed as a constant value forσDEM2.
5
The glacier-individual uncertainty in volume changeσ∆V,g is obtained by multiplying σ∆z,gwith the initial glacier areaA1973. The uncertainty in the total volume change over
the entire Swiss Alps is then derived by:
σ∆V,tot=±
v u u t
n
X
g=1
σ∆2V,g (5)
10
and results in±0.97 km3. The uncertainty in the geodetic mass balance of individual glacier entitiesσgeod,g is calculated according to Huss et al. (2009) as:
σgeod,g=±
r
∆z2 g·σf2∆V
+f2
∆V ·σ
2
f∆z,g, (6)
with a mean density of the total volume changef∆V =850 kg m−
3
(cf. Sapiano et al.,
15
1998; Huss, 2013) and a corresponding uncertainty σf∆V =±60 kg m −3
. The mean geodetic elevation change ∆z is assumed to be uncorrelated to f∆V. The resulting values forσgeod,g are then divided by the glacier-individual observation period (∆t) and range between ±0.07 and 0.42 m w.e. yr−1. After the glacier-individual reconstruction of the t1 values, we consider the accuracy of ∆t as robust. Some uncertainty in t2, 20
and hence also in∆t, of maximum two years applies for only a few glaciers for which aerial orthophotographs used as source data for the creation of both the glacier out-lines and DEMs att2were acquired during two or more different survey years (glaciers
TCD
8, 4581–4617, 2014Surface elevation and mass changes of all
Swiss glaciers
M. Fischer et al.
Title Page
Abstract Introduction
Conclusions References
Tables Figures
◭ ◮
◭ ◮
Back Close
Full Screen / Esc
Printer-friendly Version Interactive Discussion
Discussion
P
a
per
|
Discus
sion
P
a
per
|
Discussion
P
a
per
|
Discussion
P
a
per
|
Finally, the uncertainty in the mean and area-weighted average mass balance of 1420 still existing glaciers in the entire Swiss Alps over the reference period 1980– 2010σB
ref is derived with
σB
ref
=±
q
Pn
g=1(σgeod,g·Ag)2
Pn
g=1Ag
, (7)
5
and results in±0.03 m w.e. yr−1.
4.2 DEM comparison over stable terrain
An analysis of possible elevation-, slope-, and aspect-dependent biases in DEM dif-ferencing is carried out by comparing both DEMs over stable terrain. The spatial dis-tribution of surface elevation changes outside the glaciers is calculated within a mask
10
around every entity (Fig. 4). The mean offset between both DEMs is−1.7±5.5 (1σ) m. Thus, on average, the DHM25 Level 1 DEMs are slightly higher over stable terrain compared to the recent swissALTI3D DEMs. The area-weighted mean standard devia-tion over all stable terrain close to glacierized areas of±5.5 m agrees with the nominal uncertaintyσ∆z assessed with literature-based uncertainty estimates. The stochastic
15
uncertainty calculated as:
σ∆z,sto=±
σ∆z
√
n, (8)
with nthe number of pixels for which DEM comparison over stable terrain is carried out, is±0.7 m on average.
20
TCD
8, 4581–4617, 2014Surface elevation and mass changes of all
Swiss glaciers
M. Fischer et al.
Title Page
Abstract Introduction
Conclusions References
Tables Figures
◭ ◮
◭ ◮
Back Close
Full Screen / Esc
Printer-friendly Version Interactive Discussion
Discussion
P
a
per
|
Discus
sion
P
a
per
|
Discussion
P
a
per
|
Discussion
P
a
per
|
However, the scatter significantly increases towards steep slopes. The bias is slightly dependent on aspect. While areas with a mean aspect NE and SW show the same mean offset as the overall value, positive values result for pixels with a mean aspect W–NW–N and negative values for pixels facing E–SE–S, i.e. exposed to the opposite direction (Fig. 4). This points to a slight shift in the elevation information included in
5
the DHM25 Level 1 DEMs in NW–SE-direction. We assume this shift to originate from the creation of the DHM25 Level 1 source data and therefore calculate the influence of its correction via co-registration according to Nuth and Kääb (2011). Because the effect of this correction in average mass balance turns out to be in the order of±10−4 to 10−2m w.e. yr−1 and is always smaller than the uncertainty in the derived average
10
mass balance from 1980 to 2010σB
ref, i.e. smaller than±0.03 m w.e. yr
−1
, we consider the effect of the detected DEM shifts on calculated surface elevation, volume and mass changes as negligible.
4.3 Validation
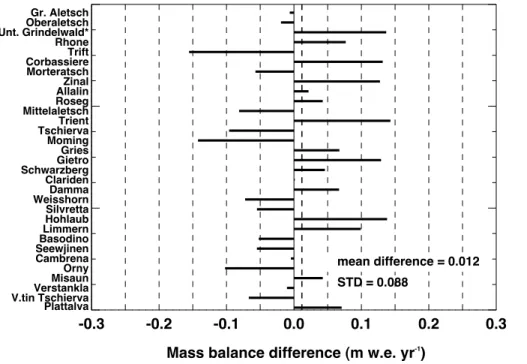
For validation of average mass balances between 1980–2010 we choose 31 glaciers
15
from the datasets of Huss et al. (2010a, b) for which volume changes based on the independent, photogrammetrically derived DEMs show closest temporal accord with our respective measured period.
For individual glaciers, mean mass balance from Huss et al. (2010a, b) partly differs significantly from our results over the same observation period. Nevertheless, these
20
differences do not indicate a systematic error and the mean difference is almost zero (Fig. 5). Hence, when analysing individual glaciers, the uncertainty in the average geodetic mass balance and the temporally homogenized mass balance time series presented in this study has to be considered. Averaged over subsamples of glaciers or individual catchments though, the accuracy of the average geodetic mass balance is
25
TCD
8, 4581–4617, 2014Surface elevation and mass changes of all
Swiss glaciers
M. Fischer et al.
Title Page
Abstract Introduction
Conclusions References
Tables Figures
◭ ◮
◭ ◮
Back Close
Full Screen / Esc
Printer-friendly Version Interactive Discussion
Discussion
P
a
per
|
Discus
sion
P
a
per
|
Discussion
P
a
per
|
Discussion
P
a
per
|
5 Results
5.1 Changes with altitude
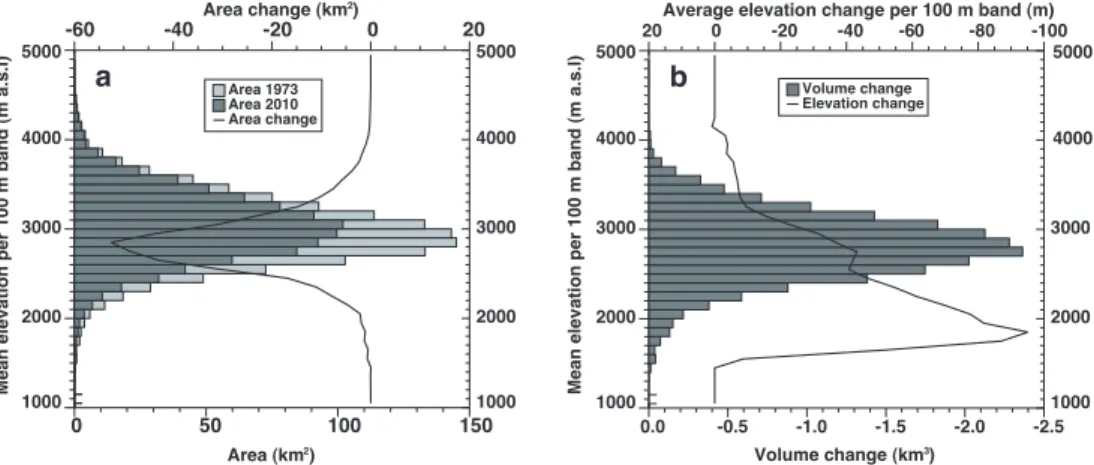
Present-day area-altitude distribution was derived from the combination of the SGI2010 with the swissALTI3D DEMs, for t1 from the SGI1973 and the DHM25 Level 1 DEMs.
Averaged over the entire Swiss Alps, observed area changes between 1973 and 2010
5
were largest between 2800 and 2900 m a.s.l. The most heavily glacierized altitudinal belt rose by approximately 200 m. (Fig. 6a). The overall volume loss for the entire Swiss Alps is −22.51±0.97 km3 for the measured period, whereof glaciers still present in 2010 account for−22.37 km3. Averaged within 100 m elevation bands, volume loss was strongest between 2700 and 2800 m a.s.l. Corresponding average elevation changes
10
continuously decreased from largest changes at lowermost elevations (terminus of val-ley glaciers) towards zero in the accumulation area. No elevation bands with positive volume changes were detected (Fig. 6b). Both surface elevation and area changes were remarkable even above 3500 m a.s.l. (Fig. 6). The observed thinning at high al-titudes and over the accumulation areas of glaciers emphasizes the current state of
15
disequilibrium of glaciers in the Swiss Alps.
5.2 Average mass balance
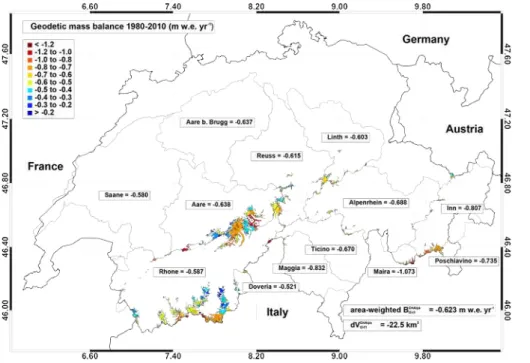
For the entire Swiss Alps, the area-weighted average mass balance of 1420 still ex-isting glaciers was −0.62±0.03 m w.e. yr−1 during our reference period 1980–2010. For the main hydrological catchments, it ranged between−0.52 and−1.07 m w.e. yr−1
20
(Fig. 7, Table 1). Catchments along the north side of the Alps (Aare b. Brugg, Reuss, Linth) showed nearly the same mass changes (−0.63 m w.e. yr−1 on average) as the average for entire Switzerland. In general, glaciers in the Valais Alps (Rhone, Dove-ria) lost comparatively less (−0.59 m w.e. yr−1) and glaciers south of the main Alpine crest (Maggia, Ticino, Maira, Poschiavino) and of the inner-Alpine Inn valley
compara-25
TCD
8, 4581–4617, 2014Surface elevation and mass changes of all
Swiss glaciers
M. Fischer et al.
Title Page
Abstract Introduction
Conclusions References
Tables Figures
◭ ◮
◭ ◮
Back Close
Full Screen / Esc
Printer-friendly Version Interactive Discussion
Discussion
P
a
per
|
Discus
sion
P
a
per
|
Discussion
P
a
per
|
Discussion
P
a
per
|
differences might be attributed to regionally variable changes in the climatic forcing and/or topographic effects.
The close-ups of the eastern Bernese Alps/western Alps of central Switzerland (Fig. 8) and the central/eastern Valais Alps (Fig. 9) show a high spatial variability in the temporally homogenized geodetic mass balance 1980–2010. Individual glaciers
5
showed strongly differing responses to a similar regional climate forcing. For most of the largest valley glaciers with flat termini (e.g. Unteraar- (UAR), Oberaletschgletscher (OAL), and Grosser Aletschgletscher (ALE) in Fig. 8, or Gornergletscher (GOR) and Glacier d’Otemma (OTE) in Fig. 9), mass changes were particularly high. In contrast, Fieschergletscher (FIE in Fig. 8) or Findelengletscher (FIN in Fig. 9) showed smaller
10
mass loss. For small and very small glaciers, the scatter of resulting changes was max-imal. Neighbouring glaciers sometimes exhibited a high local spatial variability in ob-served geodetic mass changes (e.g. glaciers in the vicinity of Grosser Aletsch- (ALE) and Unteraargletscher (UAR) in Fig. 8, or glaciers close to Glacier d’Otemma (OTE) or within the Weissmiesgruppe in Fig. 9), while for other regions the response was
15
quite uniform (e.g. Rotondogruppe or Blüemlisalpgruppe in Fig. 8). Mass losses of the mostly medium-sized mountain and valley glaciers of the Mischabel- and Weisshorn-gruppe were also very uniform and comparatively moderate (Fig. 9). This is likely to a major part due to the continentality of these areas, influenced by one of the coldest and driest climate regimes in the entire Swiss Alps (e.g. Frei and Schär, 1998; Auer
20
et al., 2007). The equilibrium line altitudes (ELAs) are highest for these glaciers (Maisch et al., 2000) and their sensitivity to changes in air temperature and precipitation lowest (cf. Oerlemans and Reichert, 2000). Kanderfirn (KAN in Fig. 8), a medium-sized valley glacier, is a good example to explain the probable influence of both glacier hypsometry and dynamic adjustment on its mass balance evolution. In 1973, Kanderfirn terminated
25
TCD
8, 4581–4617, 2014Surface elevation and mass changes of all
Swiss glaciers
M. Fischer et al.
Title Page
Abstract Introduction
Conclusions References
Tables Figures
◭ ◮
◭ ◮
Back Close
Full Screen / Esc
Printer-friendly Version Interactive Discussion
Discussion
P
a
per
|
Discus
sion
P
a
per
|
Discussion
P
a
per
|
Discussion
P
a
per
|
(cf. Bahr et al., 1998; Haeberli and Beniston, 1998). Then, having lost the majority of its lower-lying part, Kanderfirn showed comparatively less negative average mass budget within the observation period of this study.
5.3 Geometrical indices and long-term mass balance variability
For individual glaciers, the relation between the observed geodetic mass changes
5
1980–2010 and the explaining geometrical indices glacier area, median elevation, mean slope of the glacier terminus, and mean aspect was not straightforward. Both area and mean aspect did not reveal significant correlations with the geodetic mass balance (r =−0.09 for area,r=0.03 for mean aspect, Fig. 10a and d). A weak corre-lation (r =0.22) was found for median elevation (Fig. 10b), and a good one (r =0.42)
10
for mean slope over the lowermost 25 % of the glacier (Fig. 10c). Because parts of the significant scatter in Fig. 10a–c is likely caused by glacier-individual uncertainties and local effects, we also calculated the respective mean values for 5 %-quantiles of the data (triangles in Fig. 10a–c). Then, a more structured relation between the selected geometrical indices and long-term mass balance variability emerges. For average area,
15
the correlation is negative (Fig. 10a). Larger glaciers tend to show more negative mass balance because of their longer response time (cf. Jóhannesson et al., 1989). The higher the median elevation of a glacier, the less negative the average mass budget tends to be (Fig. 10b). Median elevation is a proxy for the balanced-budget equilibrium line altitude (ELA0) (Braithwaite et al., 2013), which in turn depends on continentality. 20
The latter can be approximated as a function of mean annual air temperature and pre-cipitation at the ELA0 (Shumsky, 1964; Haeberli et al., 1989). Glaciers influenced by
more maritime climatic conditions react more sensitively to changes in air temperature and precipitation than more continental glaciers do (Oerlemans and Reichert, 2000). The more gently-sloping the glacier tongue, the more negative the average mass
bud-25
TCD
8, 4581–4617, 2014Surface elevation and mass changes of all
Swiss glaciers
M. Fischer et al.
Title Page
Abstract Introduction
Conclusions References
Tables Figures
◭ ◮
◭ ◮
Back Close
Full Screen / Esc
Printer-friendly Version Interactive Discussion
Discussion
P
a
per
|
Discus
sion
P
a
per
|
Discussion
P
a
per
|
Discussion
P
a
per
|
and Haeberli, 2008) and the effects of albedo and mass-balance vs. altitude act as self-reinforcing mechanisms (Haeberli et al., 2007; Oerlemans et al., 2009). Northeast-exposed glaciers lost most mass, southwest-Northeast-exposed glaciers lost least (Fig. 10d). This is likely due to the different sensitivity to changes in air temperature increase for the respective classes of mean aspect (cf. Evans and Cox, 2005; Evans, 2006): because
5
of the relatively higher influence of the shortwave radiation component, south-exposed glaciers generally react less sensitively to air temperature changes than north-exposed glaciers. Also, south-exposed glaciers are often smaller and therefore generally have a shorter response time and less negative mass balance.
6 Comparison to other studies for the European Alps
10
For the 1420 glaciers mapped in the SGI2010, the average mass balance of−0.62± 0.03 m w.e. yr−1 calculated over the reference period 1980–2010 is comparable to observed mass changes reported for other glacierized regions of the European Alps during the past years. Carturan et al. (2013) find an average mass budget of
−0.69±0.12 m w.e. yr−1 between the early 1980s and the mid-2000s for glaciers of
15
the Ortles-Cevedale group on the southwestern border of South Tyrol, Italy. Apply-ing the same methods as for temporal homogenization of mass changes derived from DEM differencing (cf. Sect. 3.1, Fig. 3), we calculate −0.65 m w.e. yr−1 for the Swiss Alps when averaged over the same time period as analyzed by Carturan et al. (2013). From area and volume changes reported by Abermann et al. (2009) for the
20
Austrian Ötztal Alps between 1969–2006, we calculate a mean mass balance of
−0.40±0.05 m w.e. yr−1 averaged for 81 glaciers. The average mass balance for all
Swiss glaciers is−0.39 m w.e. yr−1
from 1969–2006.
To derive surface elevation and mass changes for the entire Swiss Alps, Paul and Haeberli (2008) compared the DHM25 Level 1 DEMs to the SRTM DEM from
Febru-25
TCD
8, 4581–4617, 2014Surface elevation and mass changes of all
Swiss glaciers
M. Fischer et al.
Title Page
Abstract Introduction
Conclusions References
Tables Figures
◭ ◮
◭ ◮
Back Close
Full Screen / Esc
Printer-friendly Version Interactive Discussion
Discussion
P
a
per
|
Discus
sion
P
a
per
|
Discussion
P
a
per
|
Discussion
P
a
per
|
constant and report an average mass balance of −0.78 m w.e. yr−1 between 1985 and 1999. Over the same reference period, we find an average mass balance of
−0.60 m w.e. yr−1. Both the quality of the different source data used and methodologies
applied can to some extent explain the considerable differences in derived average mass balance.
5
According to Jarvis et al. (2008), the vertical accuracy of the 90 m resolution SRTM DEM is ±30 m. Over glacierized areas in Switzerland, however, it is probably signif-icantly higher (Paul, 2008). Nevertheless, the quality of the SRTM DEM is not com-parable to the recently compiled 2 m swissALTI3D DEMs. If the SRTM DEM is used, the impacts of the penetration of radar waves into snow and ice should be
consid-10
ered (Berthier et al., 2006; Gardelle et al., 2012b), as they can reach up to 10 m for the C-band of SRTM (Dall et al., 2001). This could explain the more negative surface eleva-tion changes over accumulaeleva-tion areas observed by Paul and Haeberli (2008) who com-pared the SRTM DEM to photogrammetrically derived DEMs by Bauder et al. (2007). Moreover, the DEM preprocessing prior to differencing may cause additional
uncer-15
tainty, for instance if source DEMs have to be downscaled to the same gird cell resolu-tion (Carturan et al., 2013). For our study, the 2 m resoluresolu-tion swissALTI3D DEMs were upscaled to 25 m, corresponding to the cell size of the DHM25 Level 1. Not only the quality of the source DEMs but also of the glacier outlines used is important. This espe-cially applies if changes of small and very small glaciers have to be assessed. Fischer
20
et al. (2014) show that the accuracy of glacier outlines derived from semi-automatic satellite remote sensing approaches using medium-resolution satellite imagery does not satisfy change assessments of glaciers<1.0 km2.
Related to the methodological approaches used, the following aspects likely also cause part of the disagreement in calculated average mass balances between Paul
25
TCD
8, 4581–4617, 2014Surface elevation and mass changes of all
Swiss glaciers
M. Fischer et al.
Title Page
Abstract Introduction
Conclusions References
Tables Figures
◭ ◮
◭ ◮
Back Close
Full Screen / Esc
Printer-friendly Version Interactive Discussion
Discussion
P
a
per
|
Discus
sion
P
a
per
|
Discussion
P
a
per
|
Discussion
P
a
per
|
years of the source data are not considered. For Grosser Aletschgletscher, assuming t1 as 1985 instead of 1980 changes the result by 0.14 m w.e. yr−
1
(−0.87 instead of
−0.73 m w.e. yr−1). Definingt1as 1985 for all glaciers of Switzerland would change the
mean geodetic mass balance by 0.03 m w.e. yr−1. Hence, differences in the reference years of the source data account for 17 %, the different assumptions of the density of
5
volume change for 24 %, and the quality of the source data used for 59 % of the dis-agreement in calculated average mass balances between the present study and Paul and Haeberli (2008).
7 Conclusions
In this article we presented glacier-specific changes in surface elevation, volume and
10
geodetic mass balance for all glaciers of the Swiss Alps between 1980 and 2010. The DHM25 Level 1 DEMs acquired from 1961 to 1991 over glacierized areas were combined with the 1973 glacier inventory and then compared to the swissALTI3DDEMs from 2008–2011 and glacier outlines from the new Swiss Glacier Inventory SGI2010. By making use of this recently compiled new source data of improved quality, we were
15
able to reanalyze and extend the dataset of surface elevation changes in the Swiss Alps by Paul and Haeberli (2008). From the DEM differencing, we derive an overall volume loss of−22.51±0.97 km3 for the entire Swiss Alps for the measured period, whereof glaciers still present in 2010 account for−22.37 km3. Observed ice volume changes were strongest between 2700–2800 m a.s.l. and remarkable even above 3500 m a.s.l.
20
No elevation bands with positive volume changes were found. Results were validated against elevation changes from independent photogrammetrical DEMs. An in-depth accuracy assessment of volumetric and mass changes was performed for the analyzed glaciers. Elevation-, slope-, and aspect dependent errors were investigated from the comparison of both source DEMs over stable terrain outside the glaciers. Because of
25
TCD
8, 4581–4617, 2014Surface elevation and mass changes of all
Swiss glaciers
M. Fischer et al.
Title Page
Abstract Introduction
Conclusions References
Tables Figures
◭ ◮
◭ ◮
Back Close
Full Screen / Esc
Printer-friendly Version Interactive Discussion
Discussion
P
a
per
|
Discus
sion
P
a
per
|
Discussion
P
a
per
|
Discussion
P
a
per
|
geodetic mass changes to the comparable reference time interval 1980–2010. Over this period, the area-weighted mean geodetic mass balance is−0.62±0.03 m w.e. yr−1 for the entire Swiss Alps. For the main hydrological catchments of Switzerland, mean balances range from −0.52 to −1.07 m w.e. yr−1. For the study area, comparison of our results to previous studies revealed the manifold possible sources of uncertainty in
5
deriving surface elevation and mass changes from DEM differencing.
To better understand the spatial variability of the observed surface elevation and mass changes, we investigated the relation of observed mass changes to topographic factors. Overall, as shown by several previous studies, the glacier hypsometry can partly explain the general pattern of different glacier responses to changes in climatic
10
forcing. We found strongest correlations for the geometrical indices terminus slope (e.g. mean over lowermost 25 %) and median elevation.
The dataset presented in this article is useful for manifold future studies and applica-tions. For instance, mass balance driven glacier evolution models of the entire Swiss Alps or approaches for the extrapolation of measured mass balance on single glaciers
15
to whole catchments can be validated and improved. This would also imply a reduction in the uncertainty of future runoff projections from glacierized basins in Switzerland. Moreover, it is a valuable starting point for testing more sophisticated methods to ex-plain the spatial variability in long-term mass balance in more detail.
Acknowledgements. This study is supported by the Swiss National Science Foundation 20
(SNSF), grant 200021_137586. The SWISSIMAGE and swissALTI3Ddatasets were purchased from the Swiss Federal Office of Topography (swisstopo), license no. 5704003629. Special thanks to the Laboratory of Hydraulics, Hydrology and Glaciology (VAW) at the ETH Zurich for providing us with photogrammetrically derived DEMs available for selected Swiss glaciers over our period of interest, to M. Rickenbacher (swisstopo), as well as to the University of Zurich 25
TCD
8, 4581–4617, 2014Surface elevation and mass changes of all
Swiss glaciers
M. Fischer et al.
Title Page
Abstract Introduction
Conclusions References
Tables Figures
◭ ◮
◭ ◮
Back Close
Full Screen / Esc
Printer-friendly Version Interactive Discussion
Discussion
P
a
per
|
Discus
sion
P
a
per
|
Discussion
P
a
per
|
Discussion
P
a
per
|
References
Abermann, J., Lambrecht, A., Fischer, A., and Kuhn, M.: Quantifying changes and trends in glacier area and volume in the Austrian Ötztal Alps (1969-1997-2006), The Cryosphere, 3, 205–215, doi:10.5194/tc-3-205-2009, 2009. 4583, 4588, 4596
Abermann, J., Fischer, A., Lambrecht, A., and Geist, T.: On the potential of very high-5
resolution repeat DEMs in glacial and periglacial environments, The Cryosphere, 4, 53–65, doi:10.5194/tc-4-53-2010, 2010. 4583
Abermann, J., Kuhn, M., and Fischer, A.: Climatic controls of glacier distribution and glacier changes in Austria, Ann. Glaciol., 52, 83–90, 2011. 4588
Auer, I., Böhm, R., Jurkovic, A., Lipa, W., Orlik, A., Potzmann, R., Schöner, W., Unbers-10
böck, M., Matulla, C., Briffa, K., Jones, P., Efthymiadis, D., Brunetti, M., Nanni, T., Maugeri, M., Mercalli, L., Mestre, O., Moisselin, J., Begert, M., Müller-Westermeier, G., Kveton, V., Bochnicek, O., Stastny, P., Lapin, M., Szalai, S., Szentimrey, T., Cegnar, T., Dolinar, M., Gajic-Capka, M., Zaninovic, K., Majstorovic, Z., and Nieplova, E.: HISTALP – historical in-strumental climatological surface time series of the Greater Alpine Region, Int. J. Climatol., 15
27, 17–46, 2007. 4594
Bahr, D. B., Pfeffer, W. T., Sassolas, C., and Meier, M. F.: Response time of glaciers as a function of size and mass balance: 1. Theory, J. Geophys. Res., 103, 9777–9782, 1998. 4595 Bauder, A., Funk, M., and Huss, M.: Ice-volume changes of selected glaciers in the Swiss Alps
since the end of the 19th century, Ann. Glaciol., 46, 145–149, 2007. 4586, 4595, 4597 20
Benn, D. I. and Evans, D. J. A.: Glaciers and Glaciation, Hodder Education, London, 802 pp., 2010. 4588
Benn, D. I. and Lehmkuhl, F.: Mass balance and equilibrium-line altitudes of glaciers in high-mountain environments, Quatern. Int., 65/66, 15–29, 2000. 4589
Berthier, E., Arnaud, Y., Vincent, C., and Rémy, F.: Biases of SRTM in high-mountain areas: 25
implications for the monitoring of glacier volume changes, Geophys. Res. Lett., 33, L08502, doi:10.1029/2006GL025862, 2006. 4583, 4597
Berthier, E., Schiefer, E., Clarke, G. K. C., Menounos, B., and Remy, F.: Contribution of Alaskan glaciers to sea-level rise derived from satellite imagery, Nat. Geosci., 3, 92–95, doi:10.1038/ngeo737, 2010. 4583
TCD
8, 4581–4617, 2014Surface elevation and mass changes of all
Swiss glaciers
M. Fischer et al.
Title Page
Abstract Introduction
Conclusions References
Tables Figures
◭ ◮
◭ ◮
Back Close
Full Screen / Esc
Printer-friendly Version Interactive Discussion
Discussion
P
a
per
|
Discus
sion
P
a
per
|
Discussion
P
a
per
|
Discussion
P
a
per
|
Bolch, T., Buchroithner, M., Pieczonka, T., and Kunert, A.: Planimetric and volumetric glacier changes in the Khumbu Himal, Nepal, since 1962 using Corona, Landsat TM and ASTER data, J. Glaciol., 54, 592–600, 2008. 4583
Braithwaite, R. J., Raper, S. C., and Candela, R.: Recent changes (1991–2010) in glacier mass balance and air temperature in the European Alps, Ann. Glaciol., 54, 139–146, 5
doi:10.3189/2013AoG63A285, 2013. 4595
Carturan, L., Baldassini, G. A., Bondesan, A., Calligaro, S., Carton, A., Cazorzi, F., Dalla Fontana, G., Francese, R., Guarnieri, A., Milan, N., Moro, D., and Tarolli, P.: Current be-haviour and dynamics of the lowermost Italian glacier (Montasio Occidentale, Julian Alps), Geogr. Ann. A, 95, 79–96, doi:10.1111/geoa.12002, 2012. 4589
10
Carturan, L., Filippi, R., Seppi, R., Gabrielli, P., Notarnicola, C., Bertoldi, L., Paul, F., Rast-ner, P., Cazorzi, F., Dinale, R., and Dalla Fontana, G.: Area and volume loss of the glaciers in the Ortles-Cevedale group (Eastern Italian Alps): controls and imbalance of the remaining glaciers, The Cryosphere, 7, 1339–1359, doi:10.5194/tc-7-1339-2013, 2013. 4583, 4588, 4596, 4597
15
Dall, J., Madsen, S. N., Keller, K., and Forsberg, R.: Topography and penetration of the Green-land ice sheet measured with airborne SAR interferometry, Geophys. Res. Lett., 28, 1703– 1706, 2001. 4583, 4597
DeBeer, C. and Sharp, M.: Topographic influences on recent changes of very small glaciers in the Monashee Mountains, British Columbia, Canada, J. Glaciol., 55, 691–700, 2009. 4589 20
Diolaiuti, G. A., Bocchiola, D., Vagliasindi, M., D’Agata, C., and Smiraglia, C.: The 1975–2005 glacier changes in Aosta Valley (Italy) and the relations with climate evolution, Progr. Phys. Geogr., 36, 764–785, 2012. 4583
Evans, I. S.: Glacier distribution in the Alps: statistical modelling of altitude and aspect, Geogr. Ann. A, 88, 115–133, 2006. 4596
25
Evans, I. S. and Cox, N. J.: Global variations of local asymmetry in glacier altitude: separation of north-south and east-west components, J. Glaciol., 51, 469–482, 2005. 4596
Farinotti, D., Huss, M., Bauder, A., and Funk, M.: An estimate of the glacier ice volume in the Swiss Alps, Global Planet. Change, 68, 225–231, 2009. 4584
Fischer, A.: Comparison of direct and geodetic mass balances on a multi-annual time scale, 30
TCD
8, 4581–4617, 2014Surface elevation and mass changes of all
Swiss glaciers
M. Fischer et al.
Title Page
Abstract Introduction
Conclusions References
Tables Figures
◭ ◮
◭ ◮
Back Close
Full Screen / Esc
Printer-friendly Version Interactive Discussion
Discussion
P
a
per
|
Discus
sion
P
a
per
|
Discussion
P
a
per
|
Discussion
P
a
per
|
Fischer, M.: Application of a refined perfect-plasticity approach for empirical GIS-based basal shear stress modelling to now ice-free LIA glacier forefields in the Swiss Alps, M.Sc. thesis, Department of Geography, University of Zurich, Zurich, 2012. 4594
Fischer, M., Huss, M., Barboux, C., and Hoelzle, M.: The new Swiss Glacier Inventory SGI2010: relevance of using high-resolution source data in areas dominated by very small glaciers, 5
Arct. Antarct. Alp. Res., in press, 2014. 4583, 4584, 4586, 4597
Frei, C. and Schär, C.: A precipitation climatology of the Alps from high-resolution rain-gauge observations, Int. J. Climatol., 18, 873–900, 1998. 4594
Furbish, D. J. and Andrews, J. T.: The use of hypsometry to indicate long-term stability and response of valley glaciers to changes in mass transfer, J. Glaciol., 30, 199–211, 1984. 4588 10
Gardelle, J., Berthier, E., and Arnaud, Y.: Slight mass gain of Karakoram glaciers in the early twenty-first century, Nat. Geosci., 5, 322–325, doi:10.1038/ngeo1450, 2012a. 4583
Gardelle, J., Berthier, E., and Arnaud, Y.: Impact of resolution and radar penetration on glacier elevation changes computed from DEM differencing, J. Glaciol., 58, 419–422, 2012b. 4583, 4597
15
Gardner, A. S., Moholdt, G., Cogley, J. G., Wouters, B., Arendt, A. A., Wahr, J., Berthier, E., Hock, R., Pfeffer, W. T., Kaser, G., Ligtenberg, S. R. M., Bolch, T., Sharp, M. J., Hagen, J. O., van den Broecke, M. R., and Paul, F.: A consensus estimate of glacier contribution to sea level rise: 2003 to 2009, Science, 340, 852–857, 2013. 4582
Glaciological Reports: The Swiss Glaciers, 1958/1959–2010/11, No. 80–130, Yearbooks of the 20
Cryospheric Commission of the Swiss Academy of Sciences (SCNAT), Laboratory of Hy-draulics, Hydrology and Glaciology (VAW) of ETH Zurich, Zurich, 1960–2013. 4586
Haeberli, W. and Beniston, M.: Climate change and its impacts on glaciers and permafrost in the Alps, Ambio, 27, 258–265, 1998. 4595
Haeberli, W. and Hoelzle, M.: Application of inventory data for estimating characteristics of and 25
regional climate-change effects on moutain glaciers: a pilot study with the European Alps, Ann. Glaciol., 21, 206–212, 1995. 4584
Haeberli, W., Alean, J., Müller, P., and Funk, M.: Assessing risks from glacier hazards in high mountain regions: some experiences in the Swiss Alps, Ann. Glaciol., 13, 96–102, 1989. 4595
30
TCD
8, 4581–4617, 2014Surface elevation and mass changes of all
Swiss glaciers
M. Fischer et al.
Title Page
Abstract Introduction
Conclusions References
Tables Figures
◭ ◮
◭ ◮
Back Close
Full Screen / Esc
Printer-friendly Version Interactive Discussion
Discussion
P
a
per
|
Discus
sion
P
a
per
|
Discussion
P
a
per
|
Discussion
P
a
per
|
Hoelzle, M., Haeberli, W., Dischl, M., and Peschke, W.: Secular glacier mass balances derived from cumulative glacier length changes, Global Planet. Change, 36, 295–306, 2003. 4588 Hughes, P. D.: Twenty-first century glaciers and climate in the Prokletije Mountains, Albania,
Arct. Antarct. Alp. Res., 41, 455–459, 2009. 4589
Huss, M.: Present and future contribution of glaciers to runofffrom macroscale drainage basins 5
in Europe, Water Resour. Res., 47, W07511, doi:10.1029/2010WR010299, 2011. 4582 Huss, M.: Extrapolating glacier mass balance to the mountain-range scale: the European Alps
1900–2100, The Cryosphere, 6, 713–727, doi:10.5194/tc-6-713-2012, 2012. 4583, 4587, 4588, 4589, 4598, 4610
Huss, M.: Density assumptions for converting geodetic glacier volume change to mass change, 10
The Cryosphere, 7, 877–887, doi:10.5194/tc-7-877-2013, 2013. 4587, 4590, 4597
Huss, M., Bauder, A., and Funk, M.: Homogenization of long-term mass balance time series, Ann. Glaciol., 50, 198–206, 2009. 4590
Huss, M., Hock, R., Bauder, A., and Funk, M.: 100-year mass changes in the Swiss Alps linked to the Atlantic Multidecadal Oscillation, Geophys. Res. Lett., 37, L10501, 15
doi:10.1029/2010GL042616, 2010a. 4584, 4586, 4588, 4592, 4612
Huss, M., Usselmann, S., Farinotti, D., and Bauder, A: Glacier mass balance in the south-eastern Swiss Alps since 1900 and perspectives for the future, Erdkunde, 64, 119–140, doi:10.3112/erdkunde.2010.02.02, 2010b. 4586, 4592, 4612
Huss, M., Hock, R., Bauder, A., and Funk., M.: Conventional versus reference-surface mass 20
balance, J. Glaciol., 58, 278–286, 2012. 4588, 4589
IPCC: Climate Change 2013, The Physical Science Basis, Working Group I Contribution to the Fifth Assessment Report of the Intergovernmental Panel on Climate Change, WMO/UNEP, Cambridge University Press, Geneva, 2013. 4582
Jarvis, J., Reuter, H. I., Nelson, A., and Guevara, E.: Hole-filled SRTM for the globe Version 4, 25
available from the CGIAR-CSI SRTM 90 m Database, 2008. 4597
Jóhannesson, T., Raymond, C., and Waddington, E.: Time-scale for adjustment of glaciers to changes in mass balance, J. Glaciol., 35, 233–369, 1989. 4588, 4595
Kaser, G., Grosshauser, M., and Marzeion, B.: Contribution potential of glaciers to water avail-ability in different climate regimes, P. Natl. Acad. Sci. USA, 107, 20223–20227, 2010. 4582 30
TCD
8, 4581–4617, 2014Surface elevation and mass changes of all
Swiss glaciers
M. Fischer et al.
Title Page
Abstract Introduction
Conclusions References
Tables Figures
◭ ◮
◭ ◮
Back Close
Full Screen / Esc
Printer-friendly Version Interactive Discussion
Discussion
P
a
per
|
Discus
sion
P
a
per
|
Discussion
P
a
per
|
Discussion
P
a
per
|
Kuhn, M., Markel, G., Kaser, G., Nickus, U., Obleitner, F., and Schneider, H.: Fluctuations of climate and mass balances: different responses of two adjacent glaciers, Z. Gletscherkd. Glazialgeol., 21, 409–416, 1985. 4588
Lambrecht, A. and Kuhn, M.: Glacier changes in the Austrian Alps during the last three decades, derived from the Austrian glacier inventory, Ann. Glaciol., 46, 177–184, 2007. 4583
5
Larsen, C. F., Motyka, R. J., Arendt, A. A., Echelmeyer, K. A., and Geissler, P. E.: Glacier changes in southeast Alaska and northwest British Columbia and contribution to sea level rise, J. Geophys. Res., 112, F01007, doi:10.1029/2006JF000586, 2007. 4583, 4588
Maisch, M., Wipf, A., Denneler, B., Battaglia, J., and Benz, C.: Die Gletscher der Schweizer Alpen: Gletscherhochstand 1850, Aktuelle Vergletscherung, Gletscherschwundszenarien, 10
Zürich, 2nd Edn., vdf Hochschulverlag, Zurich, 2000. 4585, 4594, 4595
Marzeion, B., Jarosch, A. H., and Hofer, M.: Past and future sea-level change from the sur-face mass balance of glaciers, The Cryosphere, 6, 1295–1322, doi:10.5194/tc-6-1295-2012, 2012. 4582
Müller, F., Caflish, T., and Müller, G.: Firn und Eis der Schweizer Alpen: Gletscherinventar, 15
No. 57, Geographisches Institut der ETH Zürich, Zürich, 1976. 4584, 4585
Nuth, C. and Kääb, A.: Co-registration and bias corrections of satellite elevation data sets for quantifying glacier thickness change, The Cryosphere, 5, 271–290, doi:10.5194/tc-5-271-2011, 2011. 4592
Nuth, C., Moholdt, G., Kohler, J., Hagen, J. O., and Kääb, A.: Svalbard glacier ele-20
vation changes and contribution to sea level rise, J. Geophys. Res., 115, F01008, doi:10.1029/2008JF001223, 2010. 4583
Oerlemans, J.: The Microclimate of Valley Glaciers, Igitur, Utrecht, University, Utrecht, 2010. 4589
Oerlemans, J. and Reichert, B. K.: Relating glacier mass balance to meteorological data using 25
a Seasonal Sensitivity Characteristic (SSC), J. Glaciol., 46, 1–6, 2000. 4594, 4595
Oerlemans, J., Giesen, R. H., and van den Broeke, M. R.: Retreating alpine glaciers: increased melt rates due to accumulation of dust (Vadret da Morteratsch, Switzerland), J. Glaciol., 55, 729–736, 2009. 4596
Paul, F.: The new Swiss glacier inventory 2000: application of remote sensing and GIS, Ph. D. 30
thesis, Department of Geography, University of Zurich, Zurich, 2004. 4585
TCD
8, 4581–4617, 2014Surface elevation and mass changes of all
Swiss glaciers
M. Fischer et al.
Title Page
Abstract Introduction
Conclusions References
Tables Figures
◭ ◮
◭ ◮
Back Close
Full Screen / Esc
Printer-friendly Version Interactive Discussion
Discussion
P
a
per
|
Discus
sion
P
a
per
|
Discussion
P
a
per
|
Discussion
P
a
per
|
Paul, F., and Haeberli, W.: Spatial variability of glacier elevation changes in the Swiss Alps obtained from two digital elevation models, Geophys. Res. Lett., 35, L21502, doi:10.1029/2008GL034718, 2008. 4583, 4595, 4596, 4597, 4598
Paul, F., Kääb, A., Maisch, M., Kellenberger, T., and Haeberli, W.: Rapid disintegra-tion of Alpine glaciers observed with satellite data, Geophys. Res. Lett., 31, L21402, 5
doi:10.1029/2004GL020816, 2004. 4586
Paul, F., Frey, H., and LeBris, R.: A new glacier inventory for the European Alps from Landsat TM scenes of 2003: challenges and results, Ann. Glaciol., 52, 144–152, 2011. 4583
Radić, V. and Hock, R.: Glaciers in the Earth’s hydrological cycle: assessments of glacier mass and runoff changes on global and regional scales, Surv. Geophys., 35, 813–837, 10
doi:10.1007/s10712-013-9262-y, 2014. 4582
Rickenbacher, M.: Die digitale Modellierung des Hochgebirges im DHM25 des Bundesamtes für Landestopographie, Wiener Schr. Geogr. Kartogr., 11, 49–55, 1999. 4585
Rignot, E., Rivera, A., and Casassa, G.: Contribution of the Patagonia Icefields of South Amer-ica to sea level rise, Science, 302, 434–437, doi:10.1126/science.1087393, 2003. 4583 15
Sapiano, J., Harrison, W. D., and Echelmeyer, K. A.: Elevation, volume and terminus changes of nine glaciers in North America, J. Glaciol., 44, 119–135, 1998. 4587, 4590
Shumsky, P. A.: Principles of Structural Glaciology, translated from the Russian by Kraus, D., Dover Publications, Inc., New York, 497 pp., 1964. 4595
Sorg, A., Bolch, T., Stoffel, M., Solomina, O., and Beniston, M.: Climate change impacts on 20
glaciers and runoffin Tien Shan (Central Asia), Nature Climate Change, 2, 725–731, 2012. 4582
Swiss Federal Office of Topography, swisstopo: DHM25 – Das digitale Höhenmodell der Schweiz, Bundesamt für Landestopographie swisstopo, Wabern, 2000. 4585, 4589, 4590 Swiss Federal Office of Topography, swisstop: swissALTI3D, Ausgabebericht 2013, Bundesamt 25
für Landestopographie swisstopo, Wabern, 2013. 4585, 4590
VanLooy, J. and Forster, R. R.: Use of historical elevation data to calculate surface-elevation and volume changes of Ha-Iltzuk Icefield, southwest British Columbia, Canada, 1970 to mid-1980s, Ann. Glaciol., 52, 109–115, 2011. 4588
WGMS (World Glacier Monitoring Service): Glacier Mass Balance Bulletin No. 12 (2010– 30
TCD
8, 4581–4617, 2014Surface elevation and mass changes of all
Swiss glaciers
M. Fischer et al.
Title Page
Abstract Introduction
Conclusions References
Tables Figures
◭ ◮
◭ ◮
Back Close
Full Screen / Esc
Printer-friendly Version Interactive Discussion
Discussion
P
a
per
|
Discus
sion
P
a
per
|
Discussion
P
a
per
|
Discussion
P
a
per
|
Monitoring Service, Zurich, Switzerland, 106 pp., publication based on database version: doi:10.5904/wgms-fog-2013-11, 2013. 4583
Zemp, M., Hoelzle, M., and Haeberli, W.: Six decades of glacier mass-balance observations: a review of the worldwide monitoring network, Ann. Glaciol., 50, 101–111, 2009. 4582 Zemp, M., Thibert, E., Huss, M., Stumm, D., Rolstad Denby, C., Nuth, C., Nussbaumer, S. U., 5
TCD
8, 4581–4617, 2014Surface elevation and mass changes of all
Swiss glaciers
M. Fischer et al.
Title Page
Abstract Introduction
Conclusions References
Tables Figures
◭ ◮
◭ ◮
Back Close
Full Screen / Esc
Printer-friendly Version Interactive Discussion
Discussion
P
a
per
|
Discus
sion
P
a
per
|
Discussion
P
a
per
|
Discussion
P
a
per
|
Table 1.Mean area-weighted geodetic mass balance 1980–2010 for the main hydrological catchments of Switzerland shown in Fig. 7, listed in alphabetic order.
Catchment Glacierized Area Glacierization Bref (km2) (km2) (%) (%) (m w.e. yr−1
) 1973 2010 1973 2010
Alpenrhein 57.2 27.3 1.78 0.84 −0.69
Linth 23.3 16.0 1.09 0.75 −0.60
Reuss 102.5 75.7 3.03 2.23 −0.62
Aare b. Brugg 229.8 174.5 1.97 1.50 −0.64 Rhone 721.5 569.2 13.68 10.79 −0.59
Doveria 14.1 8.8 8.24 5.12 −0.52
Maggia 5.0 3.0 0.39 0.23 −0.83
Ticino 5.9 2.2 0.39 0.14 −0.67
Maira 20.4 13.0 10.76 6.86 −1.07
Poschiavino 9.5 6.9 5.60 4.06 −0.74
Inn 71.9 46.4 3.71 2.39 −0.81
TCD
8, 4581–4617, 2014Surface elevation and mass changes of all
Swiss glaciers
M. Fischer et al.
Title Page
Abstract Introduction
Conclusions References
Tables Figures
◭ ◮
◭ ◮
Back Close
Full Screen / Esc
Printer-friendly Version Interactive Discussion
Discussion
P
a
per
|
Discus
sion
P
a
per
|
Discussion
P
a
per
|
Discussion
P
a
per
|
TCD
8, 4581–4617, 2014Surface elevation and mass changes of all
Swiss glaciers
M. Fischer et al.
Title Page Abstract Introduction Conclusions References Tables Figures ◭ ◮ ◭ ◮ Back Close
Full Screen / Esc
Printer-friendly Version Interactive Discussion Discussion P a per | Discus sion P a per | Discussion P a per | Discussion P a per |
Elevation change (m)
-91 -65 -39 -13 13 39 003 2 004 2 005 2 0 0 6 2 2700 00 82 0 0 8 2 00 82 0 0 9 2 0 0 9 2 0 0 9 2 0 0 0 3 000 3 0 0 0 3 0 0 1 3 0 0 1 3 0 0 1 3 00 23 0 0 2 3 0 0 2 3 0 0 3 3 3300 00
33 3400
006 3 00 73 0 0 8 3 0 0 8 3
Vadret da Tschierva 1991–2009:
Volume change (km³): –0.10 Average mass balance (m w.e. yr⁻¹): –0.78
0 500 1000 1500
m