Abstract— This paper presents the results of measurements of
medium wave received field strength, HD Radio audio quality and maximum coverage distances in a dense urban region. Analog AM and digital HD Radio signals broadcasting the same content were simultaneously transmitted in São Paulo, the largest city in Brazil. The received signal intensity and the reception quality were recorded along radial routes of up to 45 km from the transmitter under both mobile and static conditions, enabling the comparative assessment of the digital and analog system performances.
Index Terms— Digital broadcasting, HD Radio, Medium wave propagation,
Radio propagation.
I. INTRODUCTION
Field trials of digital broadcast radio systems were conducted in urban and suburban regions in Brazil to support the choice of the standard to be adopted in the country. The results of the medium wave trials with the DRM standard [1] and HD Radio standard trials in the VHF band [2] were previously reported.
This letter presents the results of measurements of medium wave field strength, HD Radio reception quality and maximum coverage distances, in daytime and nighttime, in the urban and suburban regions of São Paulo, the largest city in Brazil with 12 million inhabitants.
The Ibiquity Digital Corporation HD Radio system, HD Radio for short, is the standard for digital AM and FM broadcasting in the USA [3]. The system delivers digital audio and data services in both the MF and VHF bands and operates in-band and on-channel within the existing frequency allocations and channel spacing of analog AM and FM systems. This allows simultaneous transmission of analog and digital signals, which can be combined to broadcast the same content.
In the trials described in this paper a hybrid transmitted signal, composed of an AM analog signal and a digital HD Radio signal, was received by a mobile unit along four radial routes extending up to 45 km from the broadcasting station. The digital audio reception quality was quantitatively evaluated by the receiver’s ability to decode each digital audio sample while it moves along these routes.
Static measurements were also made at selected sites to allow a comparison between digital reception quality and the subjective assessment of the analog audio quality. The signal-to-noise ratio (SNR) threshold for good digital reception was obtained, as well as the relation between the received signal level and the SNR. The
Measurements of Medium Wave HD Radio
Reception in a Dense Urban Region
M.P.C. Almeida, L. da Silva Mello
Pontifical Catholic University of Rio de Janeiro ([email protected], [email protected])
J.A.C. Braz, R.P. David
Inmetro - National Institute of Metrology, Quality and Technology ([email protected], [email protected])
P.V.G. Castellanos
Fluminense Federal University ([email protected])
F.F. Lima
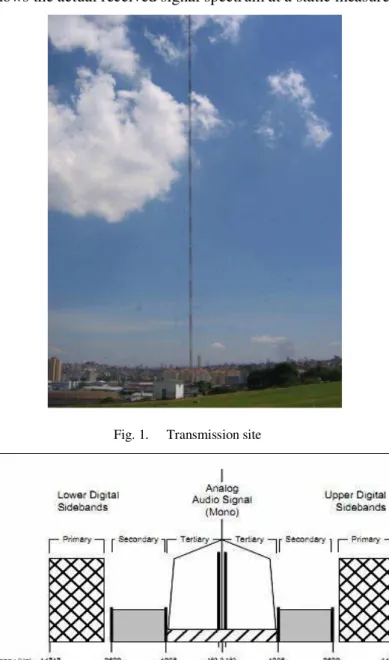
An existing AM station with high transmission power, shown in Fig. 1, was used for the trials. The
omnidirectional antenna is a vertical monopole of 122 meters high. An HD Radio signal was
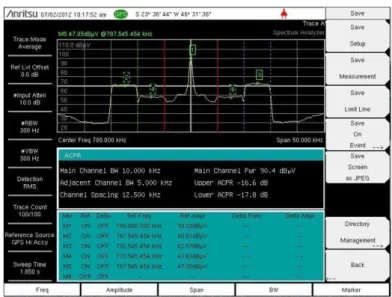
transmitted in hybrid mode with the analog AM signal at 780 kHz. The spectrum allocation of the
hybrid signal is schematically illustrated in Fig. 2. The digital signal is transmitted in primary side
bands (“core mode” data) and secondary side bands (“enhanced mode” data) on both sides of the
tertiary side band used by the host analog signal. The HD Radio 64-QAM modulated signal sidebands
were inserted from ±10.356 kHz to ± 14.716 kHz off the AM analog signal central frequency.
High-level combination was employed, in which the combiner merges the digital and analog signals after
amplification. Fig. 3 shows the actual received signal spectrum at a static measurement site.
Fig. 1. Transmission site
Fig. 3. Received signal spectrum at a static measurement site
During the daytime, the effective isotropic radiated power (EIRP) values of the analog and digital
signals were 43 kW and 430 W, respectively. During the nighttime, the EIRP was reduced to 10 kW
for the analog signal and 100 W for the digital signal. The transmitter configurations for daytime and
nighttime are summarized in Table I.
TABLEI. TRANSMITTER CONFIGURATIONS
Station CBN AM
Period Daytime Nighttime Class High power High power Coordinates 46°32’20.2”23°36’20.8” S
W
23°36’20.8” S
46°32’20.2” W Frequency 780 kHz 780 kHz EIRP Analog/HD Radio 43 kW/430 W 10 kW/100 W
Combination High Level High Level Protection Ratio 20 dB 20 dB Information rate 20 kbps 20 kbps
Code rate 5/12 5/12
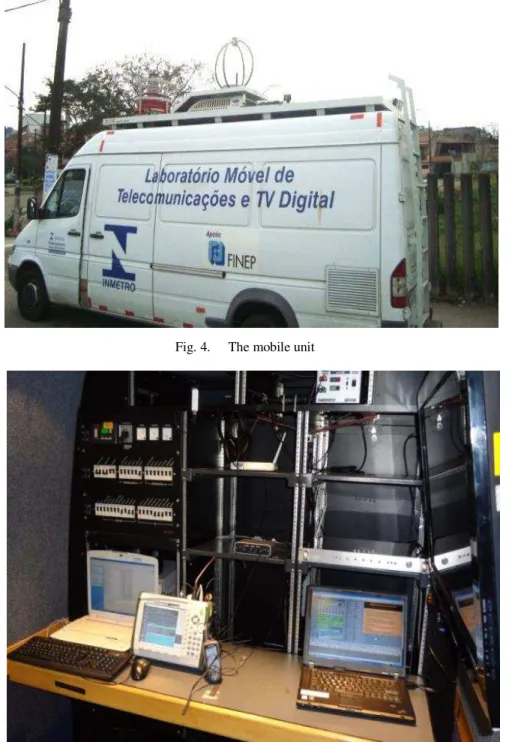
The measurements were performed using a mobile unit, shown in Fig. 4. The receiving antenna was
placed on the vehicle rooftop, approximately 3 meters above the ground. The receiving equipment
included an HD Radio receiver and a spectrum analyzer. The antenna was connected to both
instruments by a two-way 50-ohm power splitter with 0.2 dB insertion loss and 30 dB port isolation,
allowing for simultaneous measurements of the digital audio quality and signal intensity. The
reception setup inside the mobile unit is shown in Fig. 5. All parameters were recorded at a sampling
Fig. 4. The mobile unit
Fig. 5. Reception setup inside the mobile unit
The receiver attempts to decode the data from the “core mode” with monaural quality at first. If it succeeds, the system decodes the data from the “enhanced mode” with stereo quality. If the minimum
digital reception criteria are not met the receiver changes automatically to the analog signal, hosted in
the tertiary band.
The acquisition software was the HD Prospector Field Test System, which runs on a laptop
connected to the digital receiver and to a GPS. The data obtained from the digital receiver are the
received field strength, the signal-to-noise ratio and the parameter Rx_Mode, which indicates the
digital audio quality. The spectrum analyzer was connected to a second laptop. A third laptop was
III. FIELD STRENGTH MEASUREMENTS RESULTS
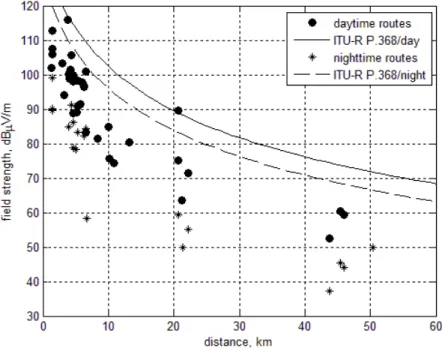
Results of the field strength measurements are shown in Fig. 6, which also shows the field strength
predicted by the method given in ITU-R Rec. P.368 [3]. The predictions consider a ground
conductivity of 1 mS/m, obtained from ITU-R Rec. P.832 [5], and a EIRP of 43 kW during the
daytime and 10 kW during the nighttime.
The predictions using the ITU-R model significantly overestimate the received field, by 10 to 15 dB
during the daytime and by more than 20 dB during the nighttime. This is partly due to the use of a
single value for the ground conductivity, as ITU-R Rec. P.832-3 gives only an estimate for this
parameter, with no information on local variability.
Additionally, the prediction model does not consider the urban clutter, which is significant for a
densely-urbanized area such as this.
Fig. 6. Measured and predicted field strength during the daytime and nighttime.
IV. DIGITAL RECEPTION QUALITY RESULTS
A. Mobile reception
The audio quality and the received signal intensity were measured along the radial routes to
estimate the coverage area and to analyze the signal behavior against the distance to the transmitter.
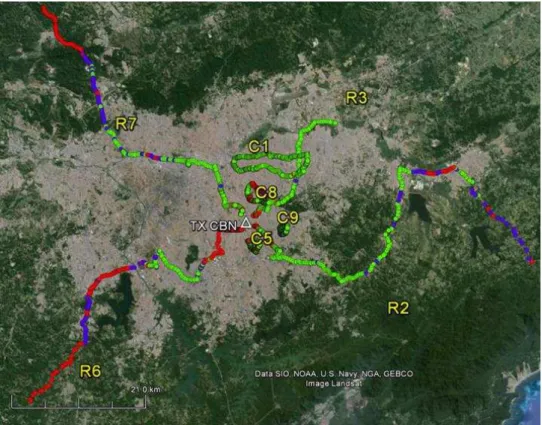
Figures 7 and 8 show the routes and the results of the digital audio quality measurements from the
daytime and nighttime campaigns, respectively. Green dots indicate points of correct stereo audio
decoding (Rx_Mode=1), blue dots correct monaural audio decoding (Rx_Mode=2) and red dots
Fig. 7. Daytime routes and mobile reception audio quality: Rx_Mode=1 (green); Rx_Mode =2 (blue); Rx_Mode=0 (red).
Fig. 8. Nighttime routes and mobile reception audio quality: Rx_Mode=1 (green); Rx_Mode =2 (blue); Rx_Mode=0 (red).
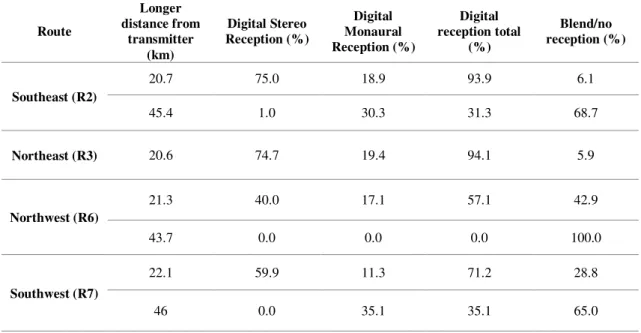
Table II shows, for the daytime measurements, the percentage of points along each routes with
good stereo and monaural decoding of the received signal was achieved, as well as the percentage of
For distances up to about 20 km, digital reception was achieved at 90% of the points in three of the
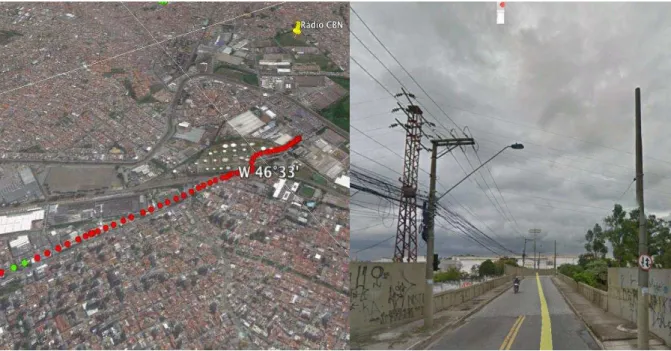
four routes. Only on the Northwest route this figure drops to about 50%.This is due to the fact that, as
illustrated in Fig. 9, the first portion of this route runs through an industrial area that also has dense
aerial power lines, that raises the noise floor making digital decoding difficult.
TABLE II. DAYTIME MOBILE DIGITAL COVERAGE
Route Longer distance from transmitter (km) Digital Stereo Reception (%) Digital Monaural Reception (%) Digital reception total (%) Blend/no reception (%) Southeast (R2)
20.7 85.0 6.4 91.4 8.6 45.4 40.9 38.6 79.5 20.5
Northeast (R3) 20.6 86.4 3.3 89.7 10.3
Northwest (R6)
21.3 37.5 23.6 51.1 48.9 43.7 0.5 28.3 28.3 71.7
Southwest (R7)
22.1 80.1 11.3 91.4 8.6 46 19.6 35.1 35.1 65.0
Fig. 9. First portion of the Southwest route: map view (top) and street view (bottom).
For nighttime, the total percentage of points with digital reception is slightly higher in the three first
routes, although with less points with stereo digital reception, as shown in Table III. In the Southwest
Southeast (R2)
20.7 75.0 18.9 93.9 6.1 45.4 1.0 30.3 31.3 68.7
Northeast (R3) 20.6 74.7 19.4 94.1 5.9
Northwest (R6)
21.3 40.0 17.1 57.1 42.9 43.7 0.0 0.0 0.0 100.0
Southwest (R7)
22.1 59.9 11.3 71.2 28.8 46 0.0 35.1 35.1 65.0
B. Static reception
The Rx_Mode values measured in mobile conditions, shown in the previous section, give an
indication of the digital reception quality and coverage along the measurement routes. However, these
measurements are taken over very short time intervals that do not allow for the evaluation of the
analog reception quality. For a comparison between analog and digital reception quality, static
measurements are needed.
In the static measurements, at each site the received field strength, the parameter Rx_Mode and the
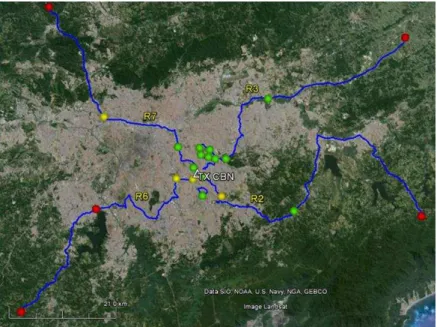
analog audio were recorded for 5 minutes. The positions of the static measurements sites of the
daytime and nighttime trials are shown in Figures 10 and 11, respectively. From a total of 49 fixed
measurements sites, 40 sites are in urban areas.
Fig. 11. Nighttime audio quality static measurements: good reception (green and yellow) and bad reception (red).
Green dots indicate sites with stereo audio reception, yellow dots indicate sites with alternation of
monaural and stereo digital reception, and red dots indicate sites with bad or no digital reception.
Digital reception is considered good when at least 99% of audio frames are correctly decoded at a site
during a measurement period of 5 minutes.
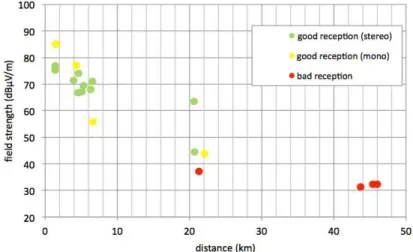
Figures 12 and 13 show the field strength measured at fixed measurement points versus the distance
to the transmitter in the daytime and nighttime, respectively. The reception quality at each site is
indicated using the color code previously defined.
The results indicate a coverage radius of approximately 20 km in both daytime and nighttime,
although the transmission power is reduced at night. Good reception required field strengths above 60
dBµ V/m during the daytime and above 40 dBµV/m during the nighttime when the noise level is
reduced.
Fig. 13. Nighttime received signal strength versus distance: good reception (green and yellow) and bad reception (red).
The SNR threshold was also obtained based on the static measurement results. Figures 14 and 15
show pairs of values of the SNR and the field strength at each site. The SNR threshold for good
reception is approximately 10 dB, a value which is consistent with Rec. ITU-R BS.1114 [6].
Fig. 14. Nighttime received signal strength versus distance: good reception (green and yellow) and bad reception (red).
V. COMPARISON OF ANALOG AND DIGITAL COVERAGES
By taking advantage of the hybrid signal transmission, it was possible to compare the results
obtained for the digital signal with the analog (AM) audio quality and coverage.
The guidelines for this type of evaluation are given in Recommendation ITU-R BS.1284 [7] and
involve grading by 20 listeners, without formal training but with some previous experience. In this
experiment, the listeners gave grades from 5 (excellent quality) to 1 (bad quality) to the AM analog
audio recorded by commercial receivers, which lasted around 2 minutes. The final grade for each site
was the average grade of the listeners. Average grades from 5 to 3 were classified as “Good reception,” average grades between 3 and 2 as “Poor reception” and average grades below 2 as “Bad reception.”
Digital reception was classified as “Good reception” at sites with Rx_Mode=1, “Poor reception” at
sites with Rx_Mode=2, and "Bad reception" at sites with Rx_Mode=0.
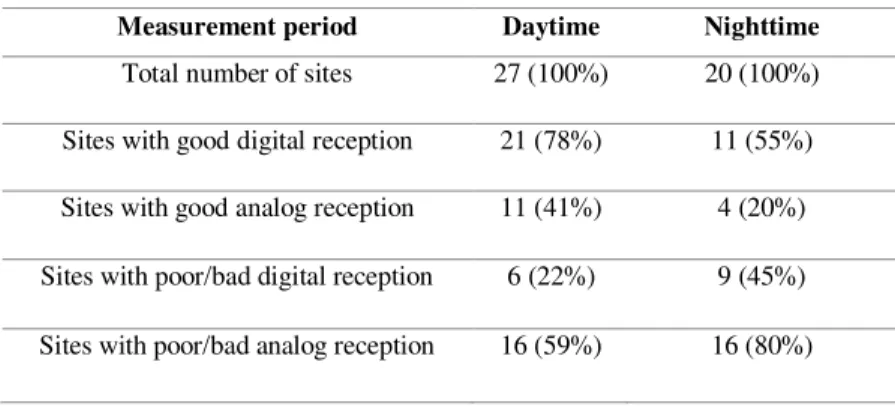
Table IV presents a comparison between analog and digital reception quality for the 47
measurement sites. Good digital reception was achieved at 68% of the locations (32 sites) versus 32%
of the locations (15 sites) for analog reception.
TABLE IV. ANALOG AND DIGITAL RECEPTION QUALITY
Measurement period Daytime Nighttime
Total number of sites 27 (100%) 20 (100%) Sites with good digital reception 21 (78%) 11 (55%) Sites with good analog reception 11 (41%) 4 (20%) Sites with poor/bad digital reception 6 (22%) 9 (45%) Sites with poor/bad analog reception 16 (59%) 16 (80%)
Note that significantly lower transmitter power was used for digital transmission. The digital output
power was 20 dB below the analog output power during both daytime and nighttime.
VI. CONCLUSIONS
Results of measurements of mobile digital audio quality of an HD Radio signal broadcasted in a
dense urban region indicated that good reception can be obtained for distances up to about 20 km
using an effective isotropically radiated power (EIRP) 20 dB below the level normally used to cover
the same region in analog transmission. Along three radial routes successful decoding of the digital
signal, either stereo or monaural, was achieved in more than 90% of the points at distances up to 20
km, in both daytime and nighttime. However, in one route that runs through an industrial area with
has dense aerial power lines digital reception was seriously compromised.
Based on the static reception measurements of the audio reception quality at selected points along
analog signal coverage exhibited shadow regions that were not present in the digital transmission
case. The received field strength threshold for good digital reception was 60 dBµV/m during the
daytime and 40 dBµ V/m during the nighttime. The SNR threshold for digital decoding was
approximately 10 dB.
The measured field strength values at fixed points indicate that ITU-R Rec. P.368-9 significantly
overestimates the measured field in this environment. São Paulo is a huge city, very densely urbanized
with lots of high buildings. This may be one reason for the additional signal attenuation. Another
reason may be the rough estimate of the ground conductivity, a fundamental input parameter in the
prediction model.
ACKNOWLEDGEMENT
This work was supported by the National Institute Metrology, Quality and Technology, Inmetro,
under the Pronametro and Prometro Programs, and by CNPq (National Research Council, Brazil),
under covenant 573939/2008-0 (INCT-CSF).
REFERENCES
[1] M.P.C. Almeida et al., Medium wave DRM field trials in Brazil – Some daytime and nighttime results in urban environment, Measurement (2012), http://dx.doi.org/10.1016/j.measurement.2012.03.012
[2] M.P.C. Almeida et al., Measurements of Field Strength and HD Radio Reception Quality at VHF, IEEE Ant. and Wireless Propagation Letters (2014), http://dx.doi.org/ 10.1109/LAWP.2014.2359001.
[3] Doc. NRSC-5-C, In-band/on-channel Digital Radio Broadcasting Standard. September 2011.
[4] Recommendation ITU-R P.368-9, Ground-wave propagation curves for frequencies between 10 kHz and 30 MHz, 2007.
[5] Recommendation ITU-R 832-2: World atlas of ground conductivities, 2012.
[6] Recommendation ITU-R BS.1114-7, Systems for terrestrial digital sound broadcasting to vehicular, portable and fixed receivers in the frequency range 30-3 000 MHz, 2012.