ADAPTABILITY AND STABILITY OF SUGAR CANE VARIET’S
Gustavo Menezes Gonçalves1, Alexandre Pio Viana1, Geovana Cremonini Entringer1, Livia Marcon Almeida1
1
Universidade Estadual do Norte Fluminense Darcy Ribeiro, Campos dos Goitacazes – RJ. Brasil.
E-mail: [email protected], [email protected], [email protected], [email protected]
ABSTRACT
This study aimed at selecting the most productive clones of sugar cane that constitute the final phase of clone evaluation. This crop has socioeconomic importance, for the production of ethanol as a renewable source of energy and less polluting than petroleum-based fuels. In this context, the release of new varieties can be a factor of greatest expression for the development of the sector. Twenty-four clones were evaluated in each mill, five of which were considered as standard and the other 19, as genotypes with potential for recommendation. The trait tons of pol per hectare (TPH) was assessed. Reduction for TPH was observed between cuts, with drop of where around 31.61% from the first to the third cut. Although differences were detected among the methodologies used, all of them contributed to better understanding of genotype x environment interaction, and are effective in recommending responsive genotypes.
Keywords: Breeding, selection, genotype-environment interaction
ADAPTABILIDADE E ESTABILIDADE DE VARIEDADES DE CANA DE AÇUCAR
RESUMO
O presente estudo teve como objetivo selecionar os clones mais produtivos da cana-de-açúcar. Estes clones estão na fase final de avaliação do programa de melhoramento genético da cana. Esta cultura tem importância socioeconômica, estratégica e ambiental, para a produção de etanol como fonte de energia renovável e menos poluente que os combustíveis à base de petróleo. Vinte e quatro clones foram avaliados em cada fábrica, cinco dos quais foram considerados como padrão e os outros 19 como genótipos com potencial para a recomendação para as regiões avaliadas. Foi observada redução de TPH entre os cortes, com queda aproximadamente 30% do primeiro para o terceiro corte. Embora detectadas diferenças entre as metodologias utilizadas,
todas elas contribuíram para melhor compreensão da interação genótipo x ambiente, e são eficazes em recomendar genótipos responsivos.
Palavras-chave: Melhoramento, seleção, interação genótipos ambiente
INTRODUCTION
The cultivation of sugar cane was one of the first economically important activities and the first agribusiness developed in Brazil (CESNIK & MIOCQUE, 2004; MELLIS & QUAGGIO, 2015). The crop has rapidly been expanding in the country, being produced 72.170 kg/ha in 2014/2015 (CONAB, 2015).
Phenotype is the product of genetic and environment effects, which in most cases are not independent. The assessment of genotype x environment interaction is important in plant breeding since, depending on the degree of plant adaptation, the expression of a new element of the phenotypic trait may occur. This element arises from the interaction between a given genotype and an environmental condition (VENCOVSKY & BARRIGA, 1992). If the interaction exists, the best genotype in one environment may not be the best in another (CRUZ & REGAZZI, 1994). To mitigate the effect of the genotype x environment interaction, cultivars with greater phenotypic stability can be identified, based on the parameters of stability and adaptability (VENCOVSKY & BARRIGA, 1992; RAMALHO et al., 1993; CRUZ et al., 2004).
Several methods have been described to study adaptability and stability mainly methods based on analysis of variance (PLAISTED & PETERSON, 1959; WRICKE, 1965; ANNICCHIARICO, 1992), nonparametric analyses (LIN & BINNS, 1988; HUENH, 1990; NASCIMENTO et al., 2010), simple linear regression analysis (THEIL, 1950; FINLAY & WILKINSON, 1963; EBERHART & RUSSEL, 1966; TAI, 1971), bi-segmented regression (VERMA et al., 1978; SILVA & BARRETO, 1985; CRUZ et al., 1989; STORCK & VENCOVSKY, 1994), quadratic regression (BRASIL & CHAVES, 1994), and multivariate analysis, such as the additive main effects and multiplicative interaction analysis (ZOBEL et al., 1988) and principal components analysis (CROSSA, 1991).
Cruz et al. (1989) proposed a methodology based on the bissegmented regression analysis to study adaptability and stability, characterized by three parameters of adaptability: the average
( ̂β0i)
environments( ̂β1i+ ̂β2i) . Stability is assessed by regression deviation ̂σδi
2
of each cultivar, according to environmental variations. A desirable genotype, by this method, would be the one
presenting high average production( ̂β0i) , loŵβ1i (inferior to 1, ̂β1i+ ̂β2i above 1, and ̂σδi
2
close to zero.
Eberhart & Russell (1966) expanded the method proposed by Finlay and Wilkinson (1963), including a parameter of stability termed deviation of regression. This method assumes that a genotype with regression coefficient greater than 01 behaves better in favorable environments, while the behavior of the one whose value is below 01 is assessed as presenting a performance relatively better than others in unfavorable environments. Thus, genotypes with high
predictability would present ˆσ equal to zero, and those with low predictability di2 ̂σdi
2
higher than zero (CRUZ et al., 2004).
For studies on adaptability and stability, many authors (Raizer & Vencovsky (1999), Lavorenti & Matsuoka (2001), Rosse et al., (2002) and Zeni Neto et al., (2008)) have used the trait tons of pol per hectare (TPH), because it expresses sucrose yield per hectare.
The present study aimed to select the most productive clones of sugar cane for the regions of the Mills Santa Cruz-RJ, Sapucaia-RJ, Disa-ES, Lasa-ES, Paineiras-ES and Dasa-MG, Brazil, through an experiment using clones in the final stage of evaluation by the Sugarcane Genetic Breeding Program (PMGCA) of the “Universidade Federal Rural do Rio de Janeiro (UFRRJ)”.
MATERIAL AND METHODS
Between March and April 2005, one experiment that constitute the final phase of the assessment of clones of the Sugarcane Genetic Breeding Program (PMGCA) of the Universidade Federal Rural do Rio de Janeiro (UFRRJ)/Inter-University Network for Ethanol Sector Development (RIDESA) was installed in each one of six partner mills (local), namely, Mills Santa Cruz – Campos dos Goytacazes-RJ; Sapucaia – Campos dos Goytacazes-RJ; Disa – Conceição da Barra-ES; Lasa – Linhares-ES; Paineiras – Itapemirim-ES; and Dasa – Serra dos Aimorés-MG.
Twenty-four clones were evaluated in each site, five of which were considered standard by PMGCA, while the other 19 clones were genotypes with potential for recommendation for the
regions evaluated and some of those have already been launched as varieties for other regions of the country (Table 1). The clones were grown under rained cultivation and received the cultural treatments, including fertilization, weed control, in accordance with the standard practices of each mill.
Table 1. Environmental Indices (IA) and averages of the variable tons of pol per hectare (TPH) related to the six Brazilian locations (Santa Cruz Mill; Sapucaia Mill; Disa Mill; Lasa Mill; Paineiras Mill; Dasa Mill) in three harvests and for the joint analysis of these harvests in the 2005/2008 growing seasons.
Mill1 1st Harvest 2nd Harvest 3rd Harvest Joint
IA ̄x IA ̄x IA ̄x IA ̄x USC -5.88 ( - ) 7.70 2.84 ( + ) 16.42 -2.47 ( - ) 11.11 -1.85 ( - ) 11.74 USA 1.38 ( + ) 14.97 -2.92 ( - ) 10.67 -4.00 ( - ) 9.58 -1.85 ( - ) 11.74 DIS 3.77 ( + ) 17.36 0.36 ( + ) 13.94 -0.68 ( - ) 12.90 1.16 ( + ) 14.74 LAS 7.08 ( + ) 20.67 -0.87 ( - ) 12.71 0.75 ( + ) 14.33 2.33 ( + ) 15.91 UPA 1.29 ( + ) 14.88 0.44 ( + ) 14.02 -5.69 ( - ) 7.89 -1.33 ( - ) 12.26 DAS 6.27 ( + ) 19.86 2.39 ( + ) 15.98 -4.06 ( - ) 9.52 1.54 ( + ) 15.12 USC: Santa Cruz Mill; USA: Sapucaia Mill; DIS: Disa Mill; LAS: Lasa Mill; UPA: Paineiras Mill; DAS: Dasa Mill. x Average of the environment.
The experiments were conducted in a randomized block design with four replications. Each plot consisted of four 5m-grooves. The experiments were evaluated during three growing seasons, the last one in 2008. The plots were harvested and evaluated after prior cleaning the area, as done in commercial plantations in the mills that participated in the investigations. The trait analyzed was tons of pol per hectare, which was obtained by multiplying the variable ton of cane per hectare by % pol of cane. This trait is the apparent percentage of sucrose contained in the juice expressed in percentage of sugar. In the same samples of stems, the percentage of fiber was evaluated by reading the clarified broth, the polarimeter, and expressed the percentage of sucrose in the juice, the deviation of polarized light.
For ANOVA the effect of treatment (clones) was considered as fixed, and the other sources of variation, as random. The methodologies of Eberhart & Russell (1966) and Cruz et al. (1989) were applied to the data related to tons of pol per hectare (TPH), since it indicates sugar yield per hectare and is considered the most important trait in genotype evaluations.
The sorting of environments into favorable and unfavorable was performed based on the values of the environmental index (IA) which ranks the experiments that resulted in an average higher than the overall average as favorable, positive index, and those with average below the overall average as unfavorable, negative index.
The present study considered the combination of six locations (mills) and three years (growing seasons) as environments, totaling 18 environments. The methodologies of Eberhart & Russel (1966) and Cruz et al. (1989) were conducted as recommended by Cruz et al. (2004), with the aid of the Genes software system (CRUZ, 2013).
RESULTS AND DISCUSSION
The joint analysis of variance of the 18 environments showed that there were a significant effect on genotypes, environments and the interaction between genotypes and environments (p <0.01). The effect of environment on tons of pol per hectare was not the same for all clones (Table 2). Therefore, it is possible to select superior genotypes. According to Barbosa et al., (2002), strong genotype x environment interaction in sugar cane is a common fact, both in breeding programs and commercial crops in our case we use in this work different
By the environmental index, the experiments that resulted in an average higher than the overall average are classified as favorable, positive index, while those with an average below the overall average, as unfavorable, negative index. The variation in productivity observed between environments reveals instability in environmental conditions during clone evaluation (Table 2). It is possible to observe that, for most mills, this index was positive in the first cut, with tendency to become more negative over the years, due to the decreasing trend from cane-plant plantation to cane ratoon. Besides the difference in productivity commonly observed between crops, other unpredictable factors, such as rain, pests, diseases, and temperature also affect the environmental index rate.
This index should not be used to evaluate whether an environment is better than another because its behavior results only from the genotypes evaluated in that location in that period. Thus it may not reflect the true environmental divergence. However, it is useful to give a sense of how genotypes will respond to environmental changes and which of them are the most sensible to these changes. That is why they have been used in studies on adaptability and stability.
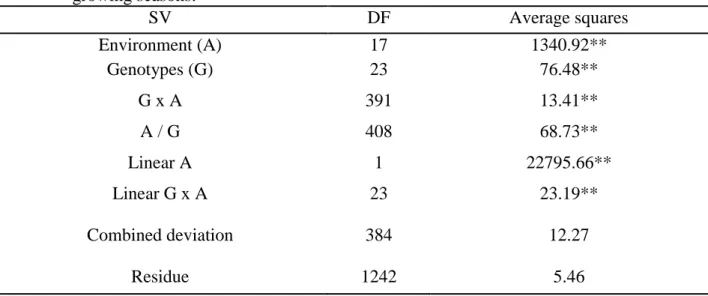
Table 2. Summary of the analysis of variance of the trait tons of pol per hectare, with the
decomposition of the sum of squares of environments/genotypes, according to the methodology of Eberhart and Russell, at six Brazilian locations (Santa Cruz Mill; Sapucaia Mill; Disa Mill; Lasa Mill; Paineiras Mill; Dasa Mill) in the 2005/2008 growing seasons. SV DF Average squares Environment (A) 17 1340.92** Genotypes (G) 23 76.48** G x A 391 13.41** A / G 408 68.73** Linear A 1 22795.66** Linear G x A 23 23.19** Combined deviation 384 12.27 Residue 1242 5.46 **, significant at > 0.001 by F test
For the TPH averages for the 24 clones, ten environments classified as favorable and the eight classified as unfavorable. The group of environments classified as favorable obtained an average 58.28 % higher than the unfavorable. It reveals a very significant difference between the environments.
The decomposition of environmental effects for different genotypes was significant in all sources of variation at (Table 2). Significant effects were also observed for linear environment, genotype x linear environment interaction and combined deviation. The significance found for the effect of linear environment indicates that environments allowed significant variations in genotype averages. For the G x linear A interaction, differences were observed between the coefficients of linear regression of the genotypes evaluated and the significance was also found in the regression combined deviations. Hence, we concluded that at least one of the genotypes assessed showed non-linear response to productivity in TPH.
The estimates of the regression coefficients for the adaptability parameter for most genotypes did not differ significantly from 1 ( ̂β1i= 1 ) indicating that they had wide adaptability,
Regarding stability, measured by the variance of regression deviations ( ̂σ2di
), only 8 out of the 24 genotypes showed no significant ̂σ2di
, which demonstrates instability in response to environmental variations. Thus, most genotypes (67%) presented unstable response to environmental changes.
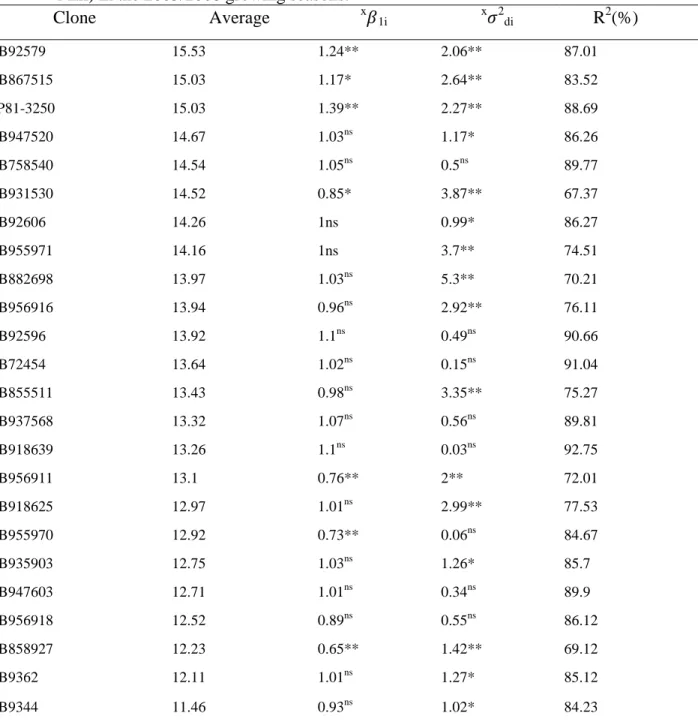
According to the methodology of Eberhart & Russell (1966), ideal genotypes are those with high productivity, wide adaptability (regression coefficient equal to 1) and high stability (non- significant regression deviation), the RB758540, RB92596 and RB72454 genotypes were classified as ideal since they reached yields above the average and the regression coefficients were statistically equal to 1, indicating wide adaptability, and non-significant regression, which suggests high stability of response (Table 3).
The RB931530, RB956911, RB955970 and RB858927 genotypes presented ̂β1i value
significantly less than 1. Therefore they were considered genotypes with adaptation to unfavorable environments, and consequent low capacity to respond to improvement in environmental conditions. The RB92579, RB867515 and SP81-3250 genotypes obtained ̂β1i
value statistically higher than 1 and significantσ2di
. They were considered as adapted to favorable environments and responsive to environmental improvements, but their productivity was low in lower quality environments.
For all the others, the regression coefficient was not statistically different from 1. The RB947520, RB955971, RB956916, RB92606 and RB882698 genotypes presented yields higher than the average and wide adaptability, but they were considered of low phenotypic stability.
Many genotypes can present high productivity and an estimated ̂σ2di
statistically different from zero, indicating low predictability. In these cases, Cruz et al., (2004) described that the coefficient of determination (R2) can be used as an auxiliary measure for comparing genotypes.
Thus, although RB947520 and RB92606 clones presented ̂σ2di
different from 1, they can be recommended, since they presented a coefficient of determination of the regression equation above 80 %.
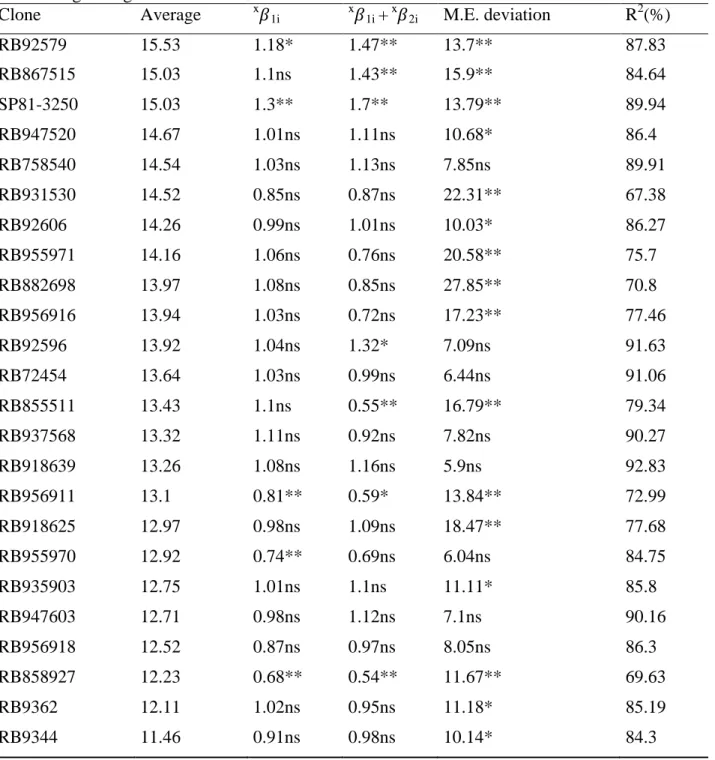
By the methodology of Cruz et al. (1989), with estimates presented (Table 4), none of the genotypes showed the ideal response, i.e., high average, low sensitivity to unfavorable environments ( ̂β1i <1), responsiveness to environmental improvement ( ̂β1i+ ̂β2i >1) and high
recommendation of genotypes by this methodology should be specific to favorable and unfavorable environments. Many other authors found no genotype classified as ideal by this methodology, including Pereira et al. (2009) and Oliveira et al. (2006).
Table 3. Estimates of adaptability and stability parameters of tons of pol per hectare performed
by the linear regression method of Eberhart and Russell (1966), at six Brazilian locations (Santa Cruz Mill; Sapucaia Mill; Disa Mill; Lasa Mill; Paineiras Mill; Dasa Mill) in the 2005/2008 growing seasons.
Clone Average x 1i x 2di R2(%) RB92579 15.53 1.24** 2.06** 87.01 RB867515 15.03 1.17* 2.64** 83.52 SP81-3250 15.03 1.39** 2.27** 88.69 RB947520 14.67 1.03ns 1.17* 86.26 RB758540 14.54 1.05ns 0.5ns 89.77 RB931530 14.52 0.85* 3.87** 67.37 RB92606 14.26 1ns 0.99* 86.27 RB955971 14.16 1ns 3.7** 74.51 RB882698 13.97 1.03ns 5.3** 70.21 RB956916 13.94 0.96ns 2.92** 76.11 RB92596 13.92 1.1ns 0.49ns 90.66 RB72454 13.64 1.02ns 0.15ns 91.04 RB855511 13.43 0.98ns 3.35** 75.27 RB937568 13.32 1.07ns 0.56ns 89.81 RB918639 13.26 1.1ns 0.03ns 92.75 RB956911 13.1 0.76** 2** 72.01 RB918625 12.97 1.01ns 2.99** 77.53 RB955970 12.92 0.73** 0.06ns 84.67 RB935903 12.75 1.03ns 1.26* 85.7 RB947603 12.71 1.01ns 0.34ns 89.9 RB956918 12.52 0.89ns 0.55ns 86.12 RB858927 12.23 0.65** 1.42** 69.12 RB9362 12.11 1.01ns 1.27* 85.12 RB9344 11.46 0.93ns 1.02* 84.23
For most genotypes, the adaptability parameters ̂β1i and ̂β1i+ ̂β2i were non-significant,
which demonstrates that many of these genotypes presented a simple linear response and did not deviate from the average response of environments, i.e., productivity increases as environmental index increases, as observed for RB947520, RB931530 and RB92606 clones, among others.
The RB92579 and SP81-3250 clones presented significant ̂β1i and ̂β1i+ ̂β2i , which were
above 1. It means that these clones presented good response to better conditions and are less adequate to unfavorable conditions. This indication corroborates the averages found in for SP81-3250, which had the second highest average in favorable environments and dropped to the ninth position in unfavorable environments. However, the RB92579 was highly productive in both favorable and unfavorable environments, and presented the highest average in both.
The estimates of ̂β1i and ̂β1i+ ̂β2i for RB867515 were non-significant and significant,
respectively, which demonstrates that the clone has an average responsiveness in the set of environments and responds well to better environmental conditions.
Two other clones, RB956911 and RB858927 showed significant ̂β1i and ̂β1i+ ̂β2i , but
they were lower than 1, which indicates that they are not responsive to better environments. These results were similar to those achieved by the methodology of Eberhart & Russel (1966), by which RB92579, RB867515 and SP81-3250 clones were considered adapted to favorable environments and responsive to environmental improvements, while RB956911 and RB858927 clones presented lower productivity and low capacity to respond to improved environmental conditions.
As observed in the methodology of Eberhart & Russell for stability, only eight out of the 24 genotypes presented average squares of the non-significant deviations.
It demonstrates that 67% of the genotypes showed little predictable response to environmental changes, by the methodology of Cruz et al., (1989). However, 16 out of the 24 (67 %) genotypes presented R2 above 80 %, which reveals a good adjustment in the regression equations.
Table 4. Averages, estimates of the coefficients ̂β1i and ̂β1i+ ̂β2i , regression deviations and
coefficients of determination (R2), for tons of pol per hectare, according to the methodology of Cruz et al. (1989), at six Brazilian locations (Santa Cruz Mill; Sapucaia Mill; Disa Mill; Lasa Mill; Paineiras Mill; Dasa Mill) in the2005/2008 growing seasons.
Clone Average x 1i x 1i + x 2i M.E. deviation R2(%)
RB92579 15.53 1.18* 1.47** 13.7** 87.83 RB867515 15.03 1.1ns 1.43** 15.9** 84.64 SP81-3250 15.03 1.3** 1.7** 13.79** 89.94 RB947520 14.67 1.01ns 1.11ns 10.68* 86.4 RB758540 14.54 1.03ns 1.13ns 7.85ns 89.91 RB931530 14.52 0.85ns 0.87ns 22.31** 67.38 RB92606 14.26 0.99ns 1.01ns 10.03* 86.27 RB955971 14.16 1.06ns 0.76ns 20.58** 75.7 RB882698 13.97 1.08ns 0.85ns 27.85** 70.8 RB956916 13.94 1.03ns 0.72ns 17.23** 77.46 RB92596 13.92 1.04ns 1.32* 7.09ns 91.63 RB72454 13.64 1.03ns 0.99ns 6.44ns 91.06 RB855511 13.43 1.1ns 0.55** 16.79** 79.34 RB937568 13.32 1.11ns 0.92ns 7.82ns 90.27 RB918639 13.26 1.08ns 1.16ns 5.9ns 92.83 RB956911 13.1 0.81** 0.59* 13.84** 72.99 RB918625 12.97 0.98ns 1.09ns 18.47** 77.68 RB955970 12.92 0.74** 0.69ns 6.04ns 84.75 RB935903 12.75 1.01ns 1.1ns 11.11* 85.8 RB947603 12.71 0.98ns 1.12ns 7.1ns 90.16 RB956918 12.52 0.87ns 0.97ns 8.05ns 86.3 RB858927 12.23 0.68** 0.54** 11.67** 69.63 RB9362 12.11 1.02ns 0.95ns 11.18* 85.19 RB9344 11.46 0.91ns 0.98ns 10.14* 84.3
CONCLUSION
According to Eberhart and Russell methodology, the clones RB758540, RB92596 and RB72454 were the ideal, while by the methodology of Cruz et al. (1989) there are no ideal genotypes. Thus, recommendation of clones by Eberhart and Russell methodology was carried out specifically for favorable and unfavorable environments. All of them contributed to better understanding of genotype x environment interaction, and are effective in recommending responsive genotypes.
REFERENCES
CESNIK, R; MIOCQUE, J. 2004 Melhoramento da cana-de-açúcar. Embrapa Informação
Tecnologia, Brasília, 2004, 307p.
CONAB. 2015. Companhia Nacional de Abastecimento, Acompanhamento de safra brasileira: cana-de-açúcar, primeiro levantamento Brasília, abril/2015. Companhia Nacional de
Abastecimento. Available in:
<http://www.conab.gov.br/OlalaCMS/uploads/arquivos/15_12_17_09_03_29_boletim_cana_ portugues_-_3o_lev_-_15-16.pdf>. Acess in: 11 May.2016.
CROSSA, J; FOX P.N; PFEIFFER, W.H; RAJARAM S; GAUCH JR, H.G. 1991. AMMI adjustment for statistical analysis of an international wheat yield trial. Theoret. Applied
Genet, v.81 n.1 p.27-37, Available in:
<http://link.springer.com/article/10.1007/BF00226108> Acess in: 29 Out. 2016.
CRUZ, C.D. 2013. GENES - a software package for analysis in experimental statistics and quantitative genetics. Acta Scientiarum, v.35 n.3 p.271-276. Available in: <http://www.scielo.br/pdf/asagr/v35n3/v35n3a01>. Acess in: 19 Out. 2016.
CRUZ, C. D.; TORRES, R. A.; VENCOVSKY, R.1989. An alternative approach to the stability analysis proposed by Silva and Barreto. Revista Brasileira de Genética. Ribeirão Preto, v.
12, n. 2, p. 567-580. Available in:
<https://eurekamag.com/research/007/005/007005700.php>. Acess in: 19 Out. 2016.
CRUZ, C.D; REGAZZI, A.J. 1994. Modelos biométricos aplicados ao melhoramento
genético. Viçosa: UFV, 390p.
CRUZ, C.D; REGAZZI, A.J; CARNEIRO, P.C.S. 2004. Modelos biométricos aplicados ao
melhoramento genético. UFV, Viçosa, 480p.
EBERHART, S.A; RUSSEL, W. A. 1996. Stability parameters for comparing varieties. Crop
Science. Madison - WI v.6 p.36-40. Available
in:<http://www.sap.uchile.cl/descargas/fisiogenetica/Stability%20parameters%20for%20com paring%20varieties_Eberhart_Russell1966.pdf> Acess in: 29 Out. 2016.
FINLAY, K.W; WILKINSON, G.N. 1963 .The analysis of adaptation in a plant breeding programme. Australian Journal of Agricultural Research, Australia v.14 p.742-754.
<http://citeseerx.ist.psu.edu/viewdoc/download?doi=10.1.1.452.8169&rep=rep1&type=pdf> Acess in:14 Mai.2015.
GARBUGLIO, D.D; ANTÔNIO, C.G; ARAÚJO, P.M; JÚNIOR, N.S.F; SHIOGA, O.S. 2007. Análise de fatores e regressão bissegmentada em estudos de estratificação ambiental e adaptabilidade em milho. Pesquisa Agropecuária Brasileira, Brasília – DF. v.42 n.2 p.183-191. Available in: < https://seer.sct.embrapa.br/index.php/pab/article/view/7553> Acess in:10 Jan. 2016.
LAVORENTI, N.A; MATSUOKA, S. 2001. Combinação de métodos paramétricos e não paramétricos na análise de estabilidade e cultivares de cana-de-açúcar. Pesquisa
Agropecuária Brasileira, Brasília – DF. v.36 n.4 p.653-658. Available in: <
http://www.scielo.br/pdf/pab/v36n4/5147.pdf> Acess in: 17 Set. 2015.
MELLIS, E.V; QUAGGIO, J.A. Uso de nutrientes na cana de açúcar. IPNI International Plant
Nutrition Institute. Informações Agronômicas, Número149. 2015. Available in: <
http://ptdocz.com/doc/1125388/jornal-149.indd---international-plant-nutrition-institute> Acess in: 26 Mar. 2016.
OLIVEIRA, G.V; CARNEIRO, P.C.S; CARNEIRO, J.E.S; CRUZ C.D. 2006. Adaptabilidade e estabilidade de linhagens de feijão comum em Minas Gerais. Pesquisa Agropecuária
Brasileira, Brasília – DF. v.41 n.2 p. 257-265 Available in: < https://seer.sct.embrapa.br/index.php/pab/article/view/7132/4177> Acess in: 06 Abr. 2015. RAMALHO, M.A.P; SANTOS, J;ZIMMERMANN, M.J.O. 1993. Genética quantitativa em
plantas autógamas: aplicações ao melhoramento do feijoeiro. UFG, Goiânia, p. 271.
RAIZER, A.J; VENCOVSKY, R.1999. Estabilidade fenotípica de novas variedades de cana-de-açúcar para o Estado de São Paulo. Pesquisa Agropecuária Brasileira, Brasília – DF. v.34 n.12 p.2241-2246. Available in: < http://www.scielo.br/pdf/pab/v34n12/6927.pdf> Acess in: 15 Jul. 2015.
ROSSE, L.N; VENCOVSKY, R; FERREIRA, D.F. 2002. Comparação de métodos de regressão para avaliar a estabilidade fenotípica em cana-de-açúcar. Pesquisa Agropecuária Brasileira,
Brasília – DF v.1 n. 1 p.25-32. Available in: <
http://www.scielo.br/pdf/pab/v37n1/7544.pdf> Acess in: 11 Ago. 2015.
FERREIRA, B.H; PEREIRA, H.S; MELO, L.C; MAGALDI, M.C.S; WENDLAND, A; COSTA, C.G.C; GUIMARÃES, C.M; MELO, C.C; FERREIRA, S.B; BRAZ, A.L.B.R; CARGNIN, A. 2009. Adaptabilidade e estabilidade de genótipos de feijoeiro-comum com grãos tipo carioca na Região Central do Brasil. Pesquisa Agropecuária Brasileira, Brasília – DF v.44 n.1 p.29-37. Available in: < http://www.scielo.br/pdf/pab/v44n1/05.pdf> Acess in:30 Mai. 2015.
VENCOVSKY, R; BARRIGA, P. 1992. Genética biométrica no fitomelhoramento. Revista
Brasileira de genética, Ribeirão Preto, 469p.
ZENI-NETO, H; OLIVEIRA, R.A; DAROS, E; BESPALHOK FILHO, J.C; ZAMBON, J.L.C; IDO, O.T; AND WEBER, H. 2008. Seleção para produtividade, estabilidade e adaptabilidade de clones de cana-de-açúcar em três ambientes no estado do Paraná via modelos mistos.
Scientia Agraria, Curitiba- PR. v.9 n.4 p.425-430. Available in:< http://revistas.ufpr.br/agraria/article/view/12475> Acess in: 29 Jul. 2016.
Recebido em: 18/01/2017 Aceito para publicação em: 27/5/2017