www.biogeosciences.net/3/521/2006/ © Author(s) 2006. This work is licensed under a Creative Commons License.
Biogeosciences
Reconciling surface ocean productivity, export fluxes and sediment
composition in a global biogeochemical ocean model
M. Gehlen1, L. Bopp1, N. Emprin1, O. Aumont2, C. Heinze3, and O. Ragueneau4
1LSCE/IPSL, Laboratoire des Sciences du Climat et de l’Environnement, CEA-CNRS-UVSQ Orme des Merisiers, Bˆat. 712, CEA/Saclay 91198 Gif-sur-Yvette Cedex, France
2LOCEAN/IPSL, Centre IRD de Bretagne, BP 70, 29280 Plouzan´e, France
3University of Bergen, Geophysical Institute & Bjerkness Centre for Climate Research, Allegaten 70, 5007 Bergen, Norway 4Institut Universitaire Europ´een de la Mer, Place Copernic, Technopˆole Brest-Iroise, 29280 Plouzan´e, France
Received: 24 April 2006 – Published in Biogeosciences Discuss.: 28 June 2006
Revised: 26 October 2006 – Accepted: 6 November 2006 – Published: 9 November 2006
Abstract. This study focuses on an improved representa-tion of the biological soft tissue pump in the global three-dimensional biogeochemical ocean model PISCES. We com-pare three parameterizations of particle dynamics: (1) the model standard version including two particle size classes, aggregation-disaggregation and prescribed sinking speed; (2) an aggregation-disaggregation model with a particle size spectrum and prognostic sinking speed; (3) a mineral ballast parameterization with no size classes, but prognostic sink-ing speed. In addition, the model includes a description of surface sediments and organic carbon early diagenesis. Model output is compared to data or data based estimates of ocean productivity, pe-ratios, particle fluxes, surface sedi-ment bulk composition and benthic O2fluxes. Model results suggest that different processes control POC fluxes at differ-ent depths. In the wind mixed layer turbuldiffer-ent particle coagu-lation appears as key process in controlling pe-ratios. Param-eterization (2) yields simulated pe-ratios that compare well to observations. Below the wind mixed layer, POC fluxes are most sensitive to the intensity of zooplankton flux feeding, indicating the importance of zooplankton community com-position. All model parameters being kept constant, the ca-pability of the model to reproduce yearly mean POC fluxes below 2000 m and benthic oxygen demand does at first order not dependent on the resolution of the particle size spectrum. Aggregate formation appears essential to initiate an intense biological pump. At great depth the reported close to con-stant particle fluxes are most likely the result of the combined effect of aggregate formation and mineral ballasting.
Correspondence to:M. Gehlen ([email protected])
1 Introduction
There are two pathways for the drawdown of carbon from the surface ocean and its removal from the ocean reservoir: the production of particulate organic carbon (POC) during photosynthesis and the formation of carbonate shells (PIC) during biomineralization, followed by the sinking of these particles out of surface ocean waters and their incorporation to surface sediments. Both pathways affect the surface ocean carbonate system and thus air-sea exchanges of CO2in con-trasting ways. During photosynthesis dissolved inorganic carbon (DIC) is consumed together with nutrients to form POC thereby decreasing the pCO2of surface ocean waters. The resulting DIC deficit is filled by CO2released by res-piration of POC either in surface waters or mixed up from deeper layers and exchanged with the atmosphere. The time scales at which C bound into POC is subtracted to air-sea exchange depends on its depth of remineralization. Concep-tually, time scales range from days for shallow remineraliza-tion in well mixed waters to geological time scales for the fraction buried in marine sediments. The production and ex-port of POC is referred to as “the biological pump” (Volk and Hoffert, 1985). The precipitation of PIC as hard parts of carbonate shells increases the pCO2of surface waters (car-bonate counter-pump). Particulate inorganic C penetrates deeper in the water column compared to POC. Its dissolu-tion releases alkalinity which in turn titrates part of the CO2 released during POC respiration. Moreover, recent studies suggest that PIC is the main carrier phase of POC to the deep ocean (Armstrong et al., 2002; Francois et al., 2002; Klaas and Archer, 2002).
awareness of the role of biology in the shaping of biogeo-chemical fluxes and its potential evolution in response to global climate change is at the origin of increasingly complex descriptions of the surface ocean ecosystem up to the first level of consumers. State-of-the-art models (Aumont and Bopp, 2006; Le Qu´er´e et al., 2005; Moore et al., 2004) now distinguish between different plankton functional types (sili-cifiers, N-fixing plankton, cal(sili-cifiers, zooplankton of different size-classes) and co-limitation by macro- and micronutrients (Fe). Despite these advances, the fate of export production is still mostly described in a rather simplified way by impos-ing empirical functions (e.g. Suess, 1980; Betzer et al., 1984; Martin et al., 1987; Armstrong et al., 2002) to describe the distribution of particulate matter across the water column.
While export fluxes are differentiated by their chemical composition (e.g. POC, PIC and biogenic opal), marine parti-cles are of diverse origin and composition. They range from individual plankton cells or fecal pellets to complex aggre-gates made of different types of primary particles trapped in a mucilaginous matrix. Fluxes of marine particles display strong regional and temporal variability in response to pro-duction regimes and their seasonality. There is growing ev-idence that upper ocean ecosystems contrasting in terms of primary productivity, f-ratio, seasonality etc. are character-ized by quite different efficiencies in terms of C transfer to the meso- and bathypelagos. These relationships need to be taken into account in order to correctly assess effects of fu-ture changes in ecosystem strucfu-ture and export fluxes on at-mospheric CO2exchange, as well as to quantify the potential of artificial Fe fertilization as a sink for CO2.
In this paper, we compare and evaluate three differ-ent schemes of particle flux parameterizations for their use in biogeochemical global circulation models: The PISCES standard version (two size classes, disaggregation, prescribed sinking speed), an aggregation-disaggregation model (particle size spectrum, prognostic sinking speed), a mineral ballast parameterization (no size classes, prognostic sinking speed). We aim at an integrated representation of material fluxes from the productive surface ocean down to the sediment-water interface. This enables to take advantage of the variety of observations available for model output – data comparison.
2 Model description
2.1 The biogeochemical global ocean model
The biogeochemical model used in the study is PISCES mont and Bopp, 2006), which is based on HAMOCC5 (Au-mont et al., 2003). It simulates the biogeochemical cycles of oxygen, carbon and of the three main nutrients control-ling marine phytoplankton growth: phosphate, silicate and iron. The model is built on the assumption that phytoplank-ton growth is limited by the external availability in nutrients.
A complete description of the model, as well as a basic vali-dation of the main model output can be found in Aumont and Bopp (2006).
The model distinguishes two phytoplankton size-classes/functional types corresponding to nanophytoplank-ton and diatoms, and two zooplanknanophytoplank-ton size-classes which are microzooplankton and mesozooplankton. For all species, the C/N/P ratios are assumed constant. Prognostic variables of phytoplankton are total biomass in carbon, iron, chlorophyll and silicon (for diatoms). As a consequence, the internal Fe/C, Chl/C, and Si/C ratios are fully prognosed by the model. For zooplankton, all these ratios are supposed constant and thus, the total biomass in carbon is the only prognostic variable. The bacterial pool is not modeled explicitly.
The PISCES standard version distinguishes three non-living organic carbon compartments: semi-labile dissolved organic carbon (DOC) with timescales of several weeks to several years, two size classes of particulate organic carbon (small particles = POCsand big particles = POCb). While the C/N/P composition of dissolved and particulate matter is tied to Redfield stochiometry, the iron, silicon and carbonate con-tents of the particles are computed. Next to the three organic detrital pools, carbonate and biogenic siliceous particles are modeled.
In addition to the ecosystem description, PISCES simu-lates dissolved inorganic carbon and total alkalinity (carbon-ate alkalinity + bor(carbon-ate + w(carbon-ater). The carbon chemistry is computed following the OCMIP protocols (http://www.ipsl. jussieu.fr/OCMIP). Finally, the phosphorus and the nitrogen cycles are decoupled in the model by nitrogen fixation and denitrification. These two processes are modeled in PISCES according to simplified parameterizations, which are fully described in Aumont and Bopp (2006).
2.2 Particle flux parameterizations
All model versions share the same description of processes producing or consuming particles, including aggregation (Kriest and Evans, 1999, 2000). Particulate organic detri-tus is produced by mortality, fecal pellet production, grazing and aggregation between dissolved and particulate organic carbon pools. Mineralization of particulate organic carbon together with excretion contributes to the semi-labile pool of dissolved organic carbon. Mineralization of POC is temper-ature dependent.
dissolution rates above the lysocline (e.g. Milliman et al., 1999; Iglesias-Rodriguez et al., 2002). Dissolution of PIC occurs in response to undersaturation with respect to calcite following the kinetic expression proposed by Maier-Reimer (1993). Mortality and grazing on diatoms contribute to the pool of biogenic Si (BSi). The dissolution of BSi is described as a function of temperature and undersaturation following Ridgwell et al. (2002).
The aggregation model which is implemented in PISCES is based on Jackson (1990) and Kriest and Evans (1999, 2000). This approach relies on the assumption that the parti-cle number distributionp(θ) can be represented by a power law as a function of particle diameterθ(McCave, 1984):
p(θ )=dN
dθ =Aθ
−ε m < θ <∞
(1) where:dN, number concentration of particles in a given size rangeθtoθ+dθ;
ε, dimensionless power value of particle size spectra. Aggregation is promoted by turbulent shear and differen-tial settling of particles. The equation governing the rate of collision (ζ) between particles described by number distribu-tionsp(θ) andp(2)over the size range frommto∞is
ξ=0.5α
Z∞
m
Z ∞
m
(βshear(θ, 2)+βsett(θ, 2)) p (θ ) p (2) dθ d2 (2) where:α, parameter of particle stickiness (non dimensional);
β (θ, 2) , rectiliniear collision kernel for turbulent (shear) and differential settling (sett);
p(θ),p(2), particle number distributions.
The stickiness corresponds to the probability of two par-ticles to stick together after collision. The collisions due to shear and differential settling are evaluated following Kriest (2002).
Biological and physical processes modify mass and num-ber of particles either one by one or both together. For in-stance, aggregation among particles will modify their num-ber without modifying total mass, while fecal pellet produc-tion will in turn add numbers and mass. Flux feeding (Jack-son, 1993) is yet another example of the complex interac-tions between particle fluxes and biology (Stemmann et al., 2004a). Flux feeding is a feeding type attributed to meso-zooplankters in which the rate of particle collecting scales with the concentration of falling particles and their sink-ing speed, thus their flux. Flux feedsink-ing modifies the mass and the number of particles, along with changing their size through particle fragmentation. A model study by Stem-mann et al. (2004b) suggests that the decrease of flux in the mesopelagos is largely controlled by flux feeding meso-plankton. The process is implemented to the PISCES model based on the following parameterization:
gmeso(POC)=gF FmesowPOC [POC]
KPOCF F +[POC] (3) wheregmesoF F , maximum rate of flux feeding, 1/m
KPOCbF F , half saturation constant for flux feeding,µmol C/l
wPOCb, sinking velocity of POC, m/d POC, concentration of POC,µmol C/l
Flux feeding does not increase infinitively with flux. This behaviour is accounted for by a Michaelis-Menten type func-tion. Flux feeding varies in time and space in response to the changing abundance of mesozooplankton computed by the model. Details on how the interactions between flux feed-ing and the sinkfeed-ing flux of POC are described in the different model version are given below.
2.2.1 Standard version: two particle size classes, pre-scribed sinking speed
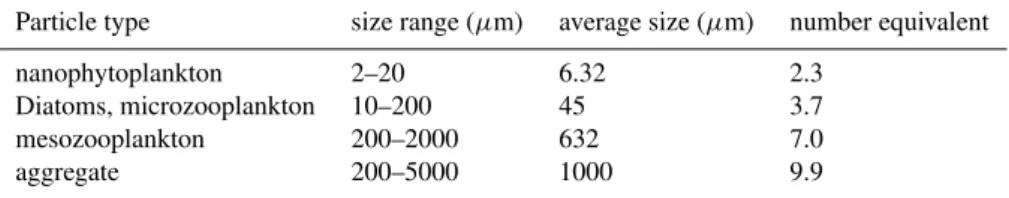
In the PISCES standard version, the two POC size classes POCs (= small) and POCb (= big) are fueled by mortality of nanophytoplankton and diatoms, fecal pellet production, grazing and aggregation between DOC, POCs and POCb. Aggregation transfers carbon from the semi-labile DOC pool to the small particles (φaggDOC→POCs)and to the big particles (φDOCagg →POCb). While Eq. (2) applies to continuous distribu-tions described by a particle size spectrum, the model stan-dard version distinguishes large and small POC produced by large, respectively small plankton. We grouped modelled particles into 4 discrete classes of particles: nanophytoplank-ton, diatoms and microzooplanknanophytoplank-ton, mesozooplanknanophytoplank-ton, ag-gregates. For each particle class the corresponding size range and average size are summarized in Table 1. The correspond-ing aggregation terms write:
φDOCagg →POCs= φ1DOCsh·DOC2+φ2DOCsh·DOC·POCs
φDOCagg →POCb= φ3DOCsh·DOC·POCb
φPOCsagg →POCb=φ1POCssh·POC2s+φ2POCssh·POCb·POCs
+φPOCs
3 POC2s +φ4POCssh·POCb·POCs (4)
The shear rate (sh) is set to 1 s−1 in the mixed layer and 0.01 s−1 below. The coefficients φ
(φDOC1 , φ2DOC, φ3DOC, φ1POCs, φ2POC for turbulence co-agulation; φ3POCs, φ4POCsfor differential settling) were computed by integrating the standard rectilinear kernels for collisions (Kriest, 2002) over the size range of each organic matter pool. The power value of the number spectra (Eq. 1) was set to 3.28 (Kriest, 2002). This number was derived assuming a fractal dimension of 2.28 for the aggregates and a constant mass distribution over the size range of the corresponding particle size class.
The sinking speed is prescribed in this model version. To account for the reported increase with depth of sinking speed (Berelson, 2002), the following parameterisation is applied to the sinking speed of POCb(wPOC, m/d):
wPOC=wminPOC+wPOCmax −wminPOCmax
0,z−zm
2000
(5) where:wminPOC, minimum sinking speed of POCb, 50 m/d; wPOCmax, maximum sinking, 200 m/d;
Table 1.Size range of particle classes identified in the model and corresponding average size. The number equivalent of size class in terms of single cells.
Particle type size range (µm) average size (µm) number equivalent
nanophytoplankton 2–20 6.32 2.3
Diatoms, microzooplankton 10–200 45 3.7
mesozooplankton 200–2000 632 7.0
aggregate 200–5000 1000 9.9
Hard shell remains (PIC and BSi) fall with the same sink-ing speed as the fraction of large organic particles. The frac-tion of POCs sinks at a constant speed of 3 m/d. Flux feed-ing by mesozooplankton occurs preferentially on fast fallfeed-ing particles (Jackson, 1993). This preference was taken into account by limiting it to POCb. It decreases the flux of fast sinking larger particles and modifies the average sinking speed of POC in the model.
2.2.2 Parameterization of size spectrum: number and mass of particles, prognostic sinking speed
In comparison to the standard version of PISCES, we have implemented a more advanced description of particle dynam-ics based on the work by Kriest and Evans (1999, 2000). This approach models the size distribution of particles of the detri-tal pool and their mean sinking speed based on the assump-tion that the particle size spectrum can be fully described by the number and the mass of particles. The sinking speed is computed as a function of the particle size spectrum. The number concentration of particles in a size classθ toθ+dθ
follows from the particle size distribution (Eq. 1). The cumu-lative size distribution is derived from Eq. (1) as the integral over the range of particle sizes m to∞. It yields the total number of particlesP (m)larger thanmand reads:
P (m)=A
Z ∞
m
θ−εdθ =Am
1−ε
ε−1 providedε >1. (6) Let the massC of a particle be related to its diameterθ by
C(θ )=Cθζ andCm=Cmζ be the mass of a single cell. The total mass of particles follows from the cumulative mass dis-tributionM(θ) as
M (m)=AC
Z ∞
m
θζ−εdθ =ACm
m1+ζ−ε (ε−ζ−1)
providedε > ζ+1. (7)
The exponent ε, the shape of the size distribution, is ex-pressed as a function ofN, the average number of cells in an aggregate
N = M (m)
P (m) Cm
= ε−1
ε−1−ζ thusε=
(1+ζ ) N−1
N−1 . (8)
Sinking modifies the number and the mass of particles in a given parcel of water. The sinking flux of numbers and mass are
φ (z)=
Z ∞
m
p (z, θ ) ω (θ ) dθ , respectively (9)
ψ (z)=C
Z ∞
m
p (z, θ ) θζω (θ ) dθ (10)
whereω (θ )=Bθη is the sinking speed of a particle of size
θ.
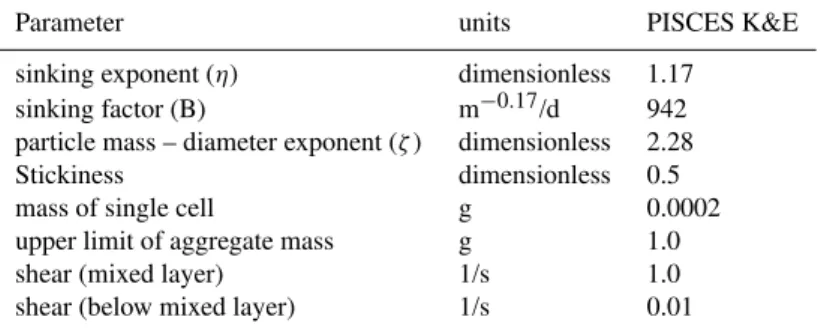
Aggregation changes the size spectrum, but does not affect particle mass. As in the PISCES standard version, aggrega-tion results from turbulent shear and differential settling. The rate of particle collision (ζ) follows from Eq. (2). In contrast to the PISCES standard version which distinguishes four dis-crete particle size classes, a continuous particle number spec-trum is computed in this case. Equations (2), (9) and (10) are solved over the finite size spectrum used in this study and their implementation in a vertically resolved model follow Kriest and Evans (2000). Parameter values are summarized in Table 2.
Table 2.Parameter values of PISCES-K&E.
Parameter units PISCES K&E
sinking exponent (η) dimensionless 1.17
sinking factor (B) m−0.17/d 942
particle mass – diameter exponent (ζ ) dimensionless 2.28
Stickiness dimensionless 0.5
mass of single cell g 0.0002
upper limit of aggregate mass g 1.0
shear (mixed layer) 1/s 1.0
shear (below mixed layer) 1/s 0.01
2.2.3 Mineral ballast model: no information on particle size, prognostic sinking speed
This model version does not distinguish between particle size classes. Aggregation is described as detailed under Sect. 2.2.1. The sinking speed is prognostic and follows from the average excess density of the particle pool com-puted from its mean composition in terms of biogenic silica, carbonate and organic matter. The excess density is given by
ρexcess= (11)
mPOC[POC]+mCaCO3[CaCO3]+mBSi[BSi] mPOC
ρPOC[POC]+ mCaCO3ρ
CaCO3[CaCO3]+ mBSi
ρBSi[BSi]
−ρSW
where: mPOC, mCaCO3, mBSi, molecular weight of POC (32.7 g), CaCO3(100 g) and biogenic silica (72.8 g);
[POC], [CaCO3], [BSI], molar concentration of POC, CaCO3and biogenic silica;
ρPOC, ρCaCO3, ρBSi, ρSWi, density of POC (1.06 g/cm3), CaCO3 (2.71 g/cm3), biogenic silica (2.10 g/cm3)and den-sity of seawater (1.027 g/cm3).
The sinking speed follows from
wballast=3
ρexcess
ρPOC−ρSW
, where the lower limit of sinking speed is set to 3 m/d. All particles sink at the same calculated sinking speed.
2.3 The surface sediments
The fluxes of POCs, POCb, BSi and CaCO3 reaching the sediment-water interface are incorporated to the bioturbated sediment layer and undergo early diagenesis as described by Heinze et al. (1999). Within the sediment compartment the two size classes of POC are no longer distinguished. In the original model by Heinze et al. (1999), POC is mineralized solely by oxygen reduction. We added denitrification to the set of early diagenetic reactions. In the model set-up selected for this study, the sediment compartment is not coupled in-teractively to the water column, but run in an off-line mode. Parameter values are as in Heinze et al. (1999).
3 Methodology
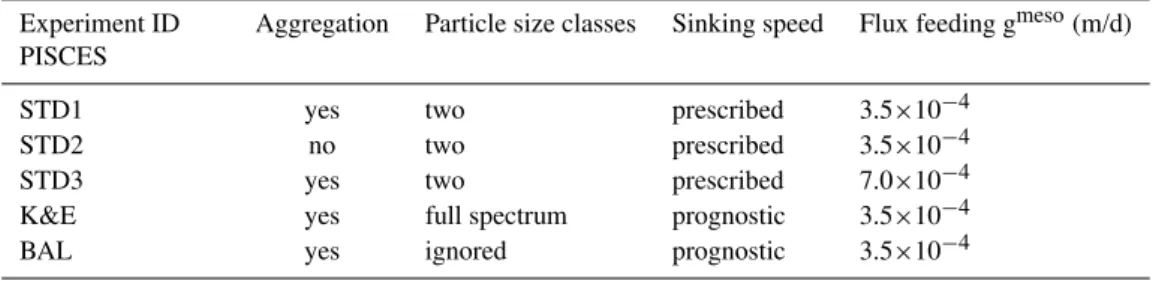
3.1 Set-up of model experiments
Table 3.Model experiments.
Experiment ID PISCES
Aggregation Particle size classes Sinking speed Flux feeding gmeso(m/d)
STD1 yes two prescribed 3.5×10⁻⁴
STD2 no two prescribed 3.5×10⁻⁴
STD3 yes two prescribed 7.0×10⁻⁴
K&E yes full spectrum prognostic 3.5×10⁻⁴
BAL yes ignored prognostic 3.5×10⁻⁴
3.2 Model evaluation
The biogeochemical model PISCES was tested over differ-ent time ranges and in various studies: paleoclimatology (Bopp et al., 2003), iron fertilization experiments (Aumont and Bopp, 2006), climate change (Bopp et al., 2005). For this study we selected remote sensing data (SeaWIFS, average surface chlorophyll in mg/m3over 1997–2004), estimates of the pe-ratio (primary production over export production) at the base of the euphotic zone (Dunne et al. (2004), data avail-able as auxiliary material), sediment trap POC fluxes (refer to Fig. 3 for location and depth of sediment traps; data are available under http://www.pangea.de, Dittert et al., 2005), surface sediment bulk composition (% dry weight CaCO3, SiO2, Corg from http://www.pangea.de, Dittert et al., 2005) and oxygen fluxes at the sediment-water interface (Jahnke, 1996) for model evaluation. Sediment trap data were not Th-corrected. We selected only data from traps deployed over at least a year and at depths greater than 1000 m, but at least 500 m above the seafloor. While the trapping efficiency of traps deployed in the mesopelagic zone is in general lower than 1, the corresponding efficiency fluctuates around 1 in the bathypelagos (depth>1200 m) (Yu et al., 2001).
4 Results and discussion
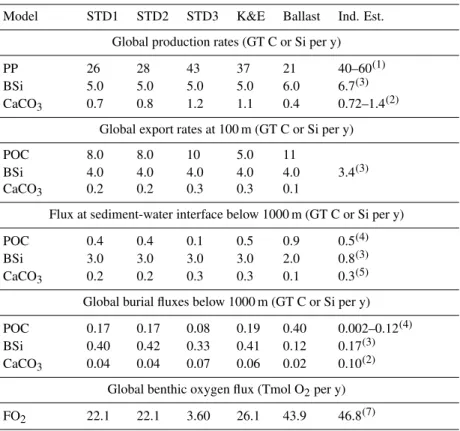
Model results are presented and compared to data on Figs. 1 to 6: chlorophyll distributions for May and November (Fig. 1), pe-ratios (Fig. 2), POC fluxes across the water col-umn (Fig. 3), surface sediment bulk composition (Figs. 4 and 5) and benthic O2fluxes (Fig. 6). Table 4 summarizes global numbers (primary production, export fluxes, etc.) for each model scenario and presents available independent estimates. These bulk numbers allow a first evaluation of model perfor-mance. A detailed discussion of individual model scenarios follows later.
Model derived annual primary production range from 21 GT C/y (PISCES-BAL) to 43 GT C/y (PISCES-STD3). Carr et al. (2006) compared global values of net primary production computed from ocean color. A total of 24 algo-rithms were compared and corresponding estimates ranged
from below 40 GT C/y to over 60 GT C/y, with an average of 50.7 GT C/y. Taking into account the spread of remote sensing based estimates, modeled annual primary production compares favorably to the later in the case of PISCES-STD3 and PISCES-K&E. To the contrary, model versions STD1, STD2 and BAL underestimate global annual primary pro-duction.
Global carbonate production in the model ranges between 0.4 to 1.1 GT C/y. It falls within the range of published es-timates (Iglesias-Rodriguez et al., 2002). In the model, be-tween 26 to 29% of the carbonate production is exported at 100 m. The low export flux results from the prescribed rout-ing of carbonate production, where half of the potential pro-duction is routed to the sinking particles. Grazing further reduces the sinking carbonate flux by imposing that 50% of grazed shells will dissolve. The model predicts global depo-sition, as well as burial fluxes of CaCO3 in line with pub-lished estimates.
Global BSi production ranges between 5 to 6 GT Si per year. These numbers are comparable to the recent estimate published by Tr´eguer (2002). Eighty, respectively 67% of production is exported at 100 m. These exported fluxes are higher than the 50% quoted in Tr´eguer (2002). Similarly, the BSi flux reaching the sediment-water interface is too large (Tr´eguer, 2002). The model underestimates the dissolution of BSi in the upper ocean and in the deeper water column. As a result, the global burial flux of BSi is overestimated as well.
Table 4. Comparison between global fluxes predicted by the different model versions and independent estimates. Units are in GT carbon (POC and CaCO3), silicon (BSi) and Tmol O2(O2fluxes) per year.
Model STD1 STD2 STD3 K&E Ballast Ind. Est.
Global production rates (GT C or Si per y)
PP 26 28 43 37 21 40–60(1)
BSi 5.0 5.0 5.0 5.0 6.0 6.7(3)
CaCO3 0.7 0.8 1.2 1.1 0.4 0.72–1.4(2)
Global export rates at 100 m (GT C or Si per y)
POC 8.0 8.0 10 5.0 11
BSi 4.0 4.0 4.0 4.0 4.0 3.4(3)
CaCO3 0.2 0.2 0.3 0.3 0.1
Flux at sediment-water interface below 1000 m (GT C or Si per y)
POC 0.4 0.4 0.1 0.5 0.9 0.5(4)
BSi 3.0 3.0 3.0 3.0 2.0 0.8(3)
CaCO3 0.2 0.2 0.3 0.3 0.1 0.3(5)
Global burial fluxes below 1000 m (GT C or Si per y)
POC 0.17 0.17 0.08 0.19 0.40 0.002–0.12(4)
BSi 0.40 0.42 0.33 0.41 0.12 0.17(3)
CaCO3 0.04 0.04 0.07 0.06 0.02 0.10(2)
Global benthic oxygen flux (Tmol O2per y)
FO2 22.1 22.1 3.60 26.1 43.9 46.8(7)
(1)Carr et al. (2006);(2)Iglesias-Rodriguez et al. (2002);(3)Tr´eguer (2002);(4)Seiter et al. (2005);(5)flux at 1000 m after Milliman and
Droxler (1996);(6)Jahnke (1996).
Oxygen fluxes predicted by PISCES-BAL are of the same order of magnitude as Jahnke (1996). PISCES-STD1, STD2 and K&E yield benthic respiration rates a factor two below observations. Model version PISCES-STD3 largely under-estimates benthic O2uptake. For PISCES-STD1, STD2 and K&E, particulate organic C fluxes at 1000 m are in agree-ment with independent estimates, while burial fluxes are at the upper end of the latter, and oxygen fluxes are too low. Results of PISCES-BAL provide a contrasting picture with overestimated POC fluxes at 1000, as well as too large burial fluxes, but O2fluxes in line with Jahnke (1996). This sug-gests that the model underestimates benthic respiration rates. Increasing the respiration rate will lower the burial flux of POC, while increasing O2 uptake. While model versions PISCES-STD1, STD2 and K&E are expected to be improved with respect to predicted burial fluxes and benthic O2 con-sumption, we anticipate an overestimation of O2 fluxes by PISCES-BAL in response to higher respiration rates. 4.1 Ocean productivity and export
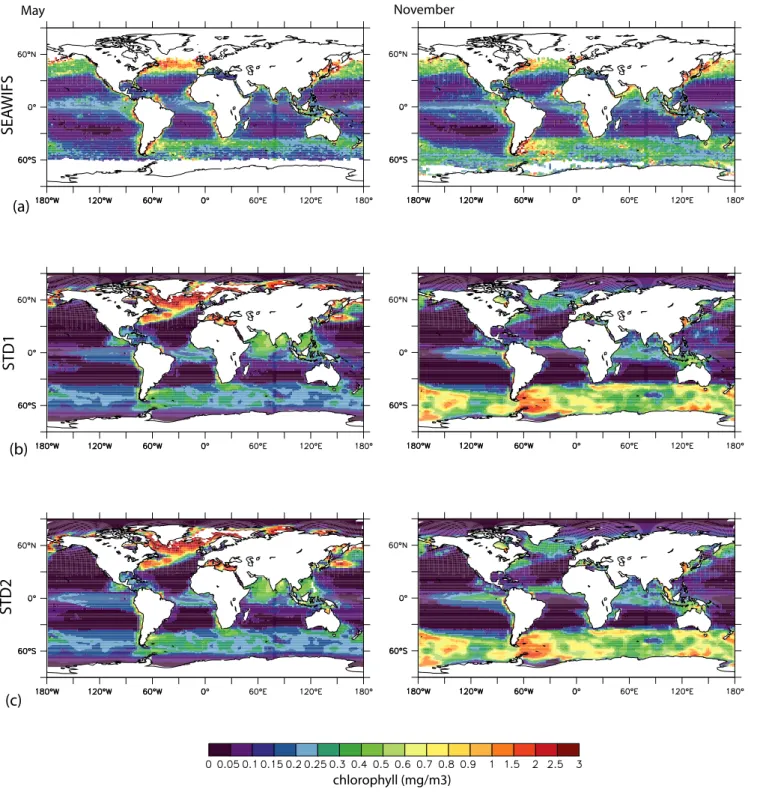
The biogeochemical model PISCES in its standard version (STD1 to STD3) reproduces to a large degree the observed
large-scale distributions of chlorophyll (Fig. 1). The model overestimates the area of the oligotrophic gyres. The same tendency is found in the model versions PISCES-K&E and PISCES-BAL. In particular in the Northern hemisphere, the transition between the oligotrophic regions and the produc-tive latitudes has a North-South and West-East trend not present in the remote sensing data. This trend in biogeo-chemical tracer distribution reflects the characteristics of the hydrodynamic forcing fields provided by the model OPA (Madec et al., 1998).
May November
SEA
WIFS
STD1
STD2
chlorophyll (mg/m3)
(a)
(b)
(c)
Fig. 1. Comparison between mean chlorophyll concentrations (mgChl/m3)for May and November from SeaWifs and model output. (a)
SeaWifs,(b)PISCES-STD1,(c)PISCES-STD2,(d)PISCES-STD3,(e)PISCES-K&E,(f)PISCES-BAL.
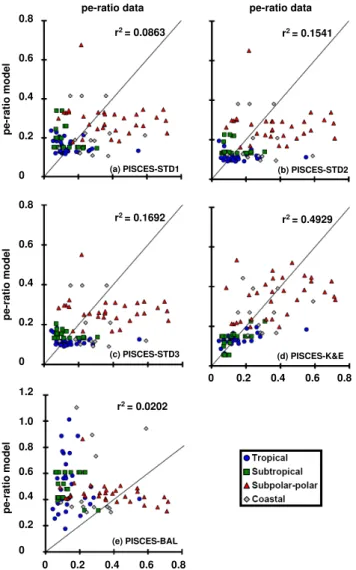
Modeled pe-ratios are compared to the observed ones in Fig. 2. They are weakly correlated to the observations for PISCES-STD1 (Fig. 2a). The model fails to reproduce the spatial variability present in the data set. In the subpolar and polar regions, data-based pe-ratios range from<0.1 to>0.7,
November May
STD3
K&E
BAL
chlorophyll (mg/m3)
(d)
(f )
(e)
Fig. 1.Continued.
particles is changed in comparison to PISCES-STD1: aggre-gation shifts mass from small to large particles (STD2), flux feeding consumes large particles (STD3). This will affect the mean sinking speed and ultimately the flux. This effect is however small and the scatter plots of Fig. 2 suggest no significant difference between the three simulations.
0 0.2 0.4 0.6 0.8
(a) PISCES-STD1
r2= 0.0863
pe-ra
tio
model
pe-ratio data
(d) PISCES-K&E
r2= 0.4929
0 0.2 0.4 0.6 0.8
r2= 0.1541
(b) PISCES-STD2
pe-ratio data
pe-ra
tio
model
pe-ra
tio
model
r2= 0.1692
(c) PISCES-STD3
0 0.2 0.4 0.6 0.8
0 0.2 0.4 0.6 0.8
(e) PISCES-BAL
r2= 0.0202
0 0.2 0.4 1.0 1.2
0.8
0.6
Fig. 2.Comparison of pe-ratios computed by the model and the data synthesis of Dunne et al. (2005). (a)PISCES-STD1,(b) PISCES-STD2,(c)PISCES-STD3,(d)PISCES-K&E,(e)PISCES-BAL.
essential for the satisfying reproduction of pe-ratios by the model. To the contrary, model output and observation are anti-correlated (negative r) in the case of PISCES-BAL. The model largely overestimates the variability of pe-ratios in the tropics, while underestimation it in the subpolar and polar regions.
4.2 Particulate organic carbon fluxes below 1000 m The comparison between sediment trap data and model de-rived POC fluxes is displayed on Fig. 3. The model ver-sion PISCES-STD1 predicts a wider spread in POC fluxes between 1000 and 2000 m than present in the data set with a tendency towards overestimation. Modeled deep water fluxes are of the right order of magnitude. Their variability below 3800 m is underestimated by the model. POC fluxes across the water column (Fig. 3b) predicted by PISCES STD2 are
strikingly similar to the reference version STD1. The same holds for the mean sinking speed (Fig. 8a). Both model ver-sions differ with respect to aggregation-disaggregation which is not represented in STD2. The lack of differences between both versions suggests that processes of aggregation and dis-aggregation are only of second order importance in control-ling yearly averaged fluxes of POC across the water column in the standard model formulation.
The impact of flux feeding intensity on mid- and deep-water POC fluxes is shown in Fig. 3c. Modeled POC fluxes correspond to trap data over the 1000 to 2000 m depth range. Deep water fluxes are, however, largely underestimated by the model with values below 10 mmolC/m2/y. Increasing flux feeding intensity in PISCES-STD3 deteriorates the rep-resentation of deepwater POC fluxes. Flux feeding impacts the flux of big POC particles. Increasing flux feeding in the model standard version, decreases the flux of fast sink-ing POCb and thereby lowers the average sinking speed (Fig. 8a). It translates into a more intense POC recycling in the mesopelagos and thus an overall shallower penetration of POC in the water column.
The comparison between modeled POC fluxes and our data base, suggests that updating the standard version of PISCES to take into account the particle size spectrum and a prognostic sinking speed (PISCES-K&E, Fig. 3d) does not significantly improve the fit of model output to data com-pared to the reference version PISCES-STD1 (Fig. 3a). The correspondence between modeled POC fluxes and trap data is slightly improved in PISCES-BAL (Fig. 3e). Similar to model versions PISCES-STD1 and PISCES-K&E, the model overestimates fluxes between 1000 and 2000 m. They are of the right order of magnitude below 2000 m.
The tendency of the model to overestimate POC fluxes between roughly 1000 and 3000 m is present in all model versions, but PISCES-STD3. An evaluation of trapping ef-ficiency of sediment traps (Yu et al., 2001) suggests a low and erratic efficiency in the mesopelagic. This is also con-firmed by a comparison between sediment trap data and in-verse modeling results (Usbeck et al., 2003). The low trap-ping efficiency of sediment traps at mid-depth might explain the systematic off-set between modeled fluxes and trap re-sults. On the other hand, the overestimation of POC fluxes at mid depth by the model goes along with an underestima-tion below 3000 m. While it is true that trap data carry large uncertainties, the systematic bias of the evolution of POC fluxes with depth predicted by the PISCES suggests that es-sential controlling processes or not or badly represented in the model.
4.3 Surface sediment composition and benthic oxygen de-mand
Modelled POC fluxes (mmol/m2/yr)
Obser
ve
d
POC
flux
es
(mmol/m2/yr)
1000 3000
2000 4000 5000 1000 3000
2000 4000 5000
1000 3000
2000 4000 5000 Deployment depth (m)
(a) STD1 (b) STD2
(c) STD3
(e) BAL
(d) K&E
(f ) trap location
Fig. 3. Comparison between POC fluxes (mol C/m2/y) estimated from sediment traps and modeled fluxes. The color code corresponds to the depth of deployment of sediment traps. Values<10 mmol C/m2/y are excluded from the graph.
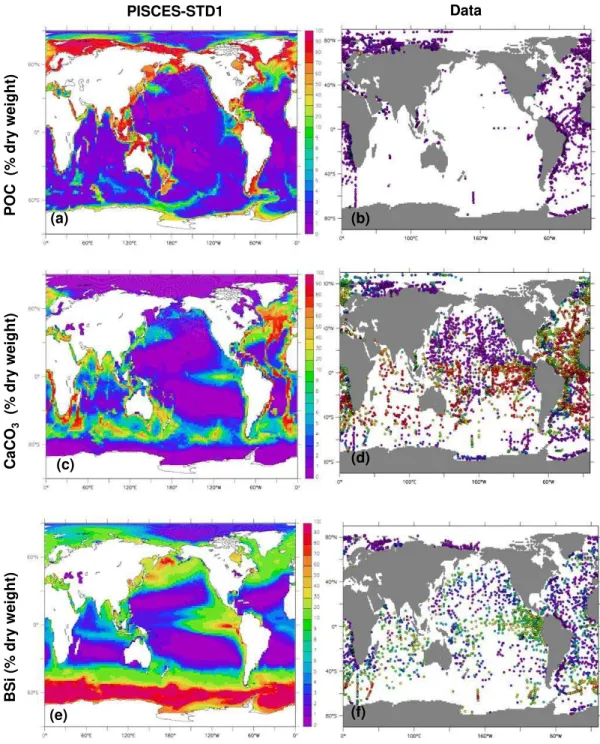
sediment composition was obtained by forcing the sediment with yearly averaged particle fluxes and bottom water con-centrations. The resulting distributions of BSi, CaCO3 and POC are compared to observations in Fig. 4 for PISCES-STD1. Model results are averaged over the first cm of sed-iment (0–1 cm). The model predicts POC levels between 1 and 2% per sediment dry weight in large areas of open ocean sediments (Fig. 4a). Unrealistic high levels of POC are
BSi
(%
dr
y
w
e
ight)
C
aCO
3
(%
dry
w
e
ight)
P
O
C (
%
dry
weight)
PISCES-STD1 Data
(c)
(e) (f)
(b) (a)
(d)
Fig. 4.Modelled and observed bulk composition (%-dry weight) of surface sediments: POC, CaCO3, BSi. Model output corresponds to the mean composition of the top first cm computed for PISCES-STD1. Data reported for the same depth interval (0–1 cm) are plotted as dots. Model output and data are on the same colour scale.
high POC areas mentioned above. The misfit between model and data in areas with seasonal ice cover, respectively con-tinental margins in part reflects the fact that model does not fully resolve the corresponding characteristic dominant phys-ical and biogeochemphys-ical processes. While the high POC lev-els in northern North Atlantic pelagic sediments follow sur-face ocean productivity (Fig. 1b), their magnitude is unreal-istic and can at present not be explained.
surface ocean the diatom productivity: e.g. high values in the Pacific Equatorial upwelling region, low values in the olig-otrophic gyres, BSi-rich belt centered at 60◦South.
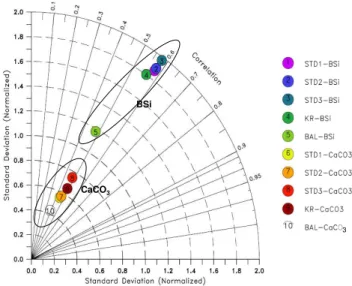
Model output is evaluated statistically for BSi and CaCO3 by subsampling the model at the locations of the data base. Measured and simulated sediment compositions are com-pared for the top first cm of sediment. For each model ver-sion the standard deviation and the correlation coefficient (r) are calculated. The standard deviation of model output is normalized with respect to the data. Statistics are summa-rized on the Taylor diagram (Taylor, 2001) given in Fig. 5. The correlation between model output and data is interme-diate (0.55<r<0.60, BSi, PISCES-STD and K&E) to weak (0.5<r, CaCO3, all model versions; BSi, PISCES-BAL). The normalized standard deviation greater than 1 for BSi suggests that the model in general overestimates of the variability BSi levels. This is consistent with an overestimation of latitu-dinal gradients in BSi in particular in the Southern Ocean and across the Eastern Pacific Equatorial upwellinng. The PISCES-BAL simulation is a noteworthy exception, but it has a weaker correlation coefficient than the other model ver-sions. The modeled CaCO3composition correlates weakly to data. The normalized standard deviation suggests an under-estimation of spatial gradients. The comparison of different model versions does not reveal significant differences.
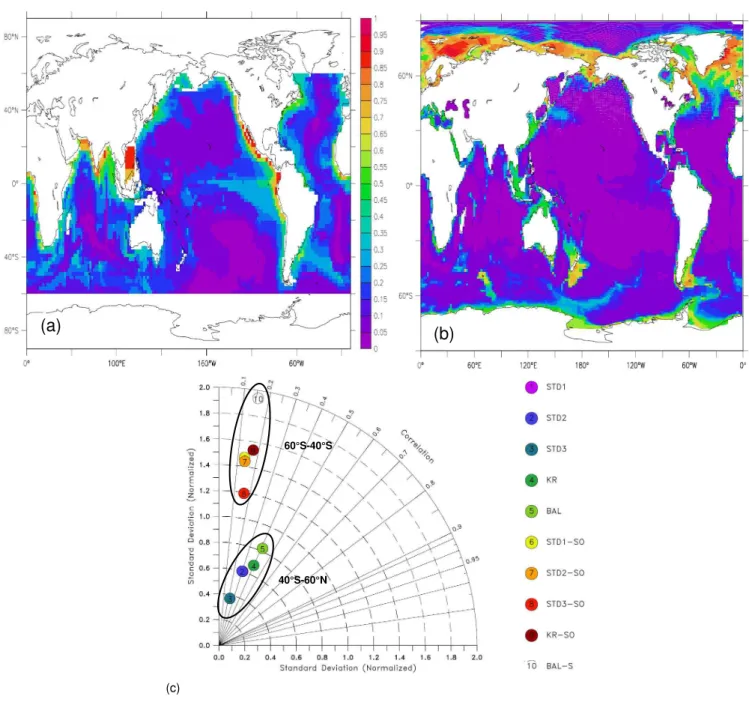
The benthic O2fluxes provide an integrated measurement of the metabolic activity of surface sediments. Figure 6 presents the comparison between the data based estimate by Jahnke (1996) (Fig. 6a) and model output for STD1 (Fig. 6b). While PISCES-STD1 reproduces the spatial distribution of O2fluxes, it underestimates its absolute value in sediments overlain by productive waters. This is consistent with an in-tegrated flux (Table 4) roughly 50% of that calculated from Jahnke (1996).
Benthic O2 fluxes predicted by different model versions are compared with respect to normalized standard devia-tion and correladevia-tion to Jahnke (1996) in Fig. 6c. All model versions, but PISCES-STD3 predict a belt of high O2 be-tween 60◦S and 40◦S. We computed the corresponding statistics for two latitudinal bands: 60◦S to 40◦S and 40◦S to 60◦N. While in the Southern Ocean, model output and data are not significantly correlated, the correlation is weak from 40◦S northwards to 60◦N. PISCES-BAL yields an in-tegrated O2 flux of 43.9 Tmol O2/y closely corresponding 46.8 Tmol O2/y computed for the data base estimate (Ta-ble 4). However, based on the statistical criteria plotted in Fig. 6c PISCES-BAL is not superior to the other model ver-sions. The Southern Ocean latitudinal gradient across areas of low and high O2 fluxes is overestimated by the model. Model version PISCES-STD3 stands out with the lowest nor-malized standard deviation (<0.4) and correlation coefficient for the area northward of 40◦S. This and the underestimation of the integrated O2flux by an order of magnitude suggest a starving of the benthos due to insufficient delivery of POC to the sediment water interface. Neither the spatial pattern nor
3
BSi
CaCO3
Fig. 5. Taylor diagram comparing modelled distributions of BSi and CaCO3in the top first cm of sediments for all 5 experiments.
Model output is subsampled at the location of observations. Model standard deviation is normalized to the data. Symbols for PISCES-STD1 and STD2 are superposed.
the intensity of O2fluxes present in the large scale distribu-tion of Jahnke (1996) is reproduced by PISCES-STD3. 4.4 Representing pelagic-benthic coupling in a global
bio-geochemical ocean model
Model experiments were set-up in order to isolate the ef-fect of different particle flux parameterization on POC fluxes across the water column, while keeping the effect on the dis-tribution of dissolved properties minimal. Changes in ocean productivity (Table 4 and Fig. 1) suggest the reorganization of nutrient fields in the upper ocean in response to particle flux parameterizations. While these changes are a transient feature, their analysis provides insight in the coupling be-tween surface ocean productivity and particle export. This is illustrated in Fig. 7 by the changes in nitrate concentra-tion between the reference simulaconcentra-tion PISCES-STD1 and ex-periments STD3 (Figs. 7a, b), K&E (Figs. 7c, d) and BAL (Figs. 7e, f). Model version STD2 is not included since it is close to identical to STD1. To complete the analysis, we present global mean sinking speed (Fig. 8a) and global mean POC fluxes (Fig. 8b) as a function of depth.
(a)
(b)
(c)
40°S-60°N 60°S-40°S
Fig. 6. Oxygen fluxes (mol/m2/y) at the sediment water interface: (a)independent estimate by Jahnke (1996); (b)fluxes computed by PISCES-STD1,(c)Taylor diagram comparing modelled distributions of O2fluxes. Model standard deviation is normalized to data. Two
regions are distinguished: between 60◦S and 40◦S (label SO) and North of 40◦S. Symbols for PISCES-STD1 and STD2 are superposed.
of flux feeding. The latter is twice as high in STD3. Increas-ing the flux feedIncreas-ing intensity deteriorates the representation of deepwater POC fluxes (Figs. 3 and 8a) and leads to a starv-ing of the benthos (Table 4, O2fluxes). Flux feeding impacts the flux of large POC particles. Increasing flux feeding in the model standard version, decreases the flux of fast sinking POCband thereby lowers the average sinking speed (Fig. 8b) at mid-depth. It translates into a more intense POC recycling in the mesopelagos and thus an overall shallower
penetra-tion of POC in the water column. This fuels the productivity (Fig. 1) at the boundary, as well as in the oligotrophic gyres, giving rise in turn to a higher POC flux at 100 m. Our results corroborate previous studies reporting the importance of flux feeding as a control on mesopelagic POC fluxes (Stemmann et al., 2004a, b).
PISCE
S
-BAL –
P
IS
CES-S
T
D1
PISCE
S
-K&E
–
P
IS
CES-S
T
D1
PISCE
S
-STD3 –
P
ISCE
S-STD1
Atlantic (30°W) Pacific (160°W)
Depth
(m
)
Depth
(m
)
Depth
(m
)
10 6
-2 2
1.5
1 0.5
0 -10 -6
4
-1
8 1.5 -0.5
-4 -8
ΔNO3(μmol/l)
Fig. 7.Changes in NO3concentrations (µmol/l) after 100 years of
integration relative to the reference version PISCES-STD1. Left: Atlantic basin; Right: Pacific basin.
parameterization of a full particle size spectrum and prognos-tic sinking speed. Differences in NO3levels are small, sug-gesting a tendency towards higher, respectively lower con-centration rather than a significant change. Slightly higher NO3levels are confined to a narrow depth interval (Figs. 7c, d). Below 500 m, the NO3concentration is slightly lower. The depth penetration of POC fluxes is 1111 m and thus comparable to STD1. Differences between the two model versions become apparent in Fig. 8. The depth evolution of
0 50 100 150 200 250
0
1000
2000
3000
4000
5000
(a)
w (m/d)
dept
h
(m)
0 1 2 3
0
1000
2000
3000
4000
5000
(b)
mean POC flux (molC/m2/y)
Fig. 8. (a)Global mean sinking speed (m/d) as a function of depth of water column predicted by different model versions.(b)Global mean POC fluxes (mol C/m2/y) as a function of depth of water col-umn.
sinking speed (Fig. 8a) in PISCES-K&E reveals values be-low 3 m/d down to 100 m, folbe-lowed by a rapid increase up to 50 m/d between 100 and 500 m. The strong increase in sink-ing speed occurs at the base of the mixed layer where high concentration of particles and high turbulence promote par-ticle coagulation. The low sinking speeds at shallow depth implies a longer particle residence time and enhanced recy-cling. Both translate into higher NO3levels, especially at the latitude of oligotrophic gyres. Below this depth, aggrega-tion promotes higher sinking speeds and particles are rapidly exported to greater depth (Fig. 8b). Particulate organic C fluxes peak around 100 m in all model versions, but maxi-mum fluxes are lowest for K&E. Consistent with the greater penetration depth of POC flux, its decrease with depth is less pronounced in PISCES-K&E. This explains the tendency to-wards lower NO3levels below 500 m in this model version.
The comparison between NO3 levels between PISCES-STD1 and PISCES-BAL (Figs. 7e, f) reveals large changes. Particulate organic C fluxes are highest in PISCES-BAL (Fig. 8b). An e-folding depth of 1250 m was computed from the mean global POC profile. In this model version a large fraction of POC is transferred to greater depth. Nutrients are transferred from shallow to mid-depth, leading to an impov-erishment for surface waters over large areas. This in turn explains the low global yearly rate of primary production of 21 GT C/y.
5 Conclusion
PISCES-STD3 simulates a rapid loss of POC flux at shallow depth. The penetration depth of POC is however too shallow and the deeper water column and the benthos are starved. To the contrary, PISCES-BAL delivers greater amounts of POC to the sediment water interface, while overestimating POC fluxes at mid-depth. This study suggests that different pro-cesses control POC fluxes at different depths.
In order to capture the link between surface ocean pro-ductivity and POC export at the base of the euphotic zone, a prognostic sinking speed computed from the continuous particle size spectrum (PISCES-K&E) is essential (Fig. 2). Particle coagulation driven by turbulence in the wind mixed layer and associated changes in particle size spectrum and thus sinking speed appears as a key process in controlling pe-ratios. The fit between modeled pe-ratios and observa-tions yielded by PISCES-STD, K&E and BAL is signifi-cantly different. In terms of its capability for reproducing the observed variability of pe-ratios across different oceanic regimes, PISCES-K&E is superior to the two other parame-terizations.
The fate of POC fluxes leaving the well-mixed surface ocean is most sensitive to the intensity of zooplankton flux feeding and thus to the composition of the zooplankton com-munity. All model parameters being kept constant and for a given intensity of flux feeding, the capability of the model to reproduce yearly averaged POC fluxes below 1000 m and benthic oxygen demand does in first order not dependent on the resolution of the particle size spectrum. Model results obtained with the PISCES standard version PISCES-STD1 (2 particle size classes and sinking speed prescribed for each size class) and with PISCES-K&E (particle size spectrum and prognostic sinking speed) are similar.
While our model study does not allow to conclusively identify whether particle aggregation or mineral ballasting is the key mechanism controlling POC fluxes in the ocean in-terior (Passow, 2004), it suggests that aggregate formation is essential to initiate an intense biological pump. High parti-cle fluxes down to the bathypelagos are most likely the result of the combined effect of aggregate formation and mineral ballasting (Passow and DeLaRocha, 2006).
Acknowledgements. This work was supported through grants EVK2-CT-2001-00100 (EU FP5 RTD project ORFOIS) and GOCE-511176 (EU FP6 RTP project CARBOOCEAN) by the European Commission and by the French national program PROOF/OCEVAR. We acknowledge the constructive comments by J. Sarmiento, G. Jackson and an anonymous reviewer. We thank B. Schneider for her help. This is publication number #2402 from LSCE and No. A 148 from the Bjerkness Centre for Climate Research.
Edited by: J. Middelburg
References
Alldredge, A. L. and Gotschalk, G.: In situ settling behaviour of marine snow, Limnol. Oceanogr., 33, 339–351, 1988.
Andersson, J. H., Wijsman, J. W. M., Herman, P. M. J., Mid-delburg, J. J., Soetaert, K., and Heip, C.: Respiration pat-terns in the deep ocean. Geophys. Res. Lett., 31, L03304, doi:10.1029/2003GL018756, 2004.
Armstrong, R. A., Lee, C., Hedges, J. I., Honjo, S., and Wakeham, S. G.: A new, mechanistic model for organic carbon fluxes in the ocean based on the quantitative association of POC with ballast minerals, Deep Sea Res. I, 49, 219–236, 2002.
Aumont, O., Maier-Reimer, E., Monfray, P., Blain, S., and Pon-daven, P.: An ecosystem model of the global ocean including Fe, Si, P co-limitations. Global Biogeochem. Cycles, 17(2), 1060, doi:10.1029/2001GB001745, 2003.
Aumont, O. and Bopp, L.: Globalizing results from ocean in situ iron fertilization studies, Global Biogeochem. Cycles, 20, GB2017, doi:10.1029/2005GB002591, 2006.
Berelson, W. M.: Particle settling rates increase with depth in the ocean. Deep Sea Res. II, 49, 237–251, 2002.
Betzer, P. R., Showers, W. J., Laws, E. A., Winn, C. D., DiTullio, G. R., and Kroopnick, P. M.: Primary productivity and particle fluxes on a transect of the equator at 153◦W in the Pacific Ocean, Deep Sea Res., 31, 1–11, 1984.
Bopp, L., Kohfeld, K. E., Le Qu´er´e, C., and Aumont, O.: Dust impact on marine biota and atmospheric CO2during glacial peri-ods, Paleoceanogr., 18, 1046, doi:10.1029/2002PA000810, 2003. Bopp, L., Aumont, O., Cadule, P., Alvain, S., and Gehlen, M.: Re-sponse of diatoms distribution to global warming and potential implications: A global model study, Geophys. Res. Lett., 32, L19606, doi:10.1029/2005GL023653, 2005.
Carr, M.-E., Friedrich, M. A. M., Schmeltz, M., Aita, M. N., An-toine, D., Arrigo, K. R., Asanuma, I., Aumont, O., Barber, R., Behrenfeld, M., Bidigare, R., Buitenhuis, E. T., Campbell, J., Ciotti, A., Dierssen, H., Dowell, M., Dunne, J., Esaias, W., Gentili, B., Gregg, W., Groom, St., Hoepffner, N., Ishizaka, J., Kameda, T., Le Qu´er´e, C., Lohrenz, St., Marra, J., M´elin, F., Moore, K., Morel, A., Reddy, T. E., Ryan, J., Scardi, M., Smyth, T., Turpie, K., Tilstone, G., Waters, K., and Yamanaka, Y.: A comparison of global estimates of marine primary production from ocean color, Deep-Sea Res., 53, 741–770, 2006.
Dittert, N., Corrin, L., Bakker, D., Bendtsen, J., Gehlen, M., Heinze, C., Maier-Reimer, E., Michalopoulos, P., Soetaert, K. E. R., and Tol, R. J. S.: Integrated Data Sets of the FP5 Research Project ORFOIS: Origin and fate of biogenic particle fluxes in the ocean and their interactions with atmospheric CO2
concen-trations as well as the amrine sediment (Vol. 1), WDC-MARE Reports 0002, 2005.
Dunne, J. P., Armstrong, R. A., Gnanadesikan, A., and
Sarmiento, J. L.: Empirical and mechanistic models for the particle export ratio, Biogeochem. Cycles., 19, GB4026, doi:10.1029/2004GB002390, 2005.
Franc¸ois, R., Honjo, S., Krishfield, R., and Manganini, S.: Fac-tors controlling the flux of organic carbon to the bathypelagic zone of the ocean, Global Biogeochem. Cycles, 16, 1087, doi:10.1029/2001GB001722, 2002.
Iglesias-Rodriguez, M. D., Armstrong, R., Feely, R., Hood, R., Kleypas, J., Milliman, J. D., Sabine, C., and Sarmiento, J.: Progress made in study of ocean’s calcium carbonate budget, Eos Trans. AGU, 83, 365, 2002.
Jackson, G. A.: A model for the formation of marine algal flocs by physical coagulation processes, Deep Sea Res., 37, 1197–1211, 1990.
Jackson, G. A.: Flux feeding as a mechanism for zooplankton graz-ing and its implications for vertical particulate flux, Limnol. and Oceanogr., 38, 1328–1331, 1993.
Jahnke, R. A.: The global flux of particulate organic carbon: Areal distribution and magnitude, Global Biogeochem. Cycles, 10, 71– 88, 1996.
Klaas, C. and Archer, D. E.: Association of sinking organic mat-ter with various types of mineral ballast in the deep sea: Impli-cations for the rain ratio, Global Biogeochem. Cycles, 16, 116, doi:10.1029/2001GB001765, 2002.
Kriest, I.: Different parameterizations of marine snow in a 1D-model and their influence on representation of marine snow, ni-trogen budget and sedimentation, Deep Sea Res., 49, 2133–2162, 2004.
Kriest, I. and Evans, G. T.: Representing phytoplankton aggregates in biogeochemical models, Deep Sea Res. I, 46, 1841–1859, 1999.
Kriest, I. and Evans, G. T.: A vertically resolved model for phyto-plankton aggregation, Proc. Indian Acad. Sci. Earth Planet. Sci., 109, 453–469, 2000.
Le Qu´er´e, C., Harrison, S. P., Prentice, I. C., Buitenhuis, E. T., Au-mont, O., Bopp, L., Claustre, H., Da Cunha, L. C., Geider, R., Giraud, X., Klaas, C., Kohfeld, K. E., Legendre, L., Manizza, M., Platt, T., Rivkin, R. B., Sathyendranath, S., Uitz, J., Wat-son, A. J., and Wolf-Gladrow, D.: Ecosystem dynamics based on plankton functional types for global ocean biogeochemistry models, Global Change Biology, 11, 2016–2040, 2005. Madec, G., Delecluse, P., Imbard, M., and L´evy, C.: OPA8.1 Ocean
general circulation model reference manual, Notes du pˆole de mod´elisation, IPSL, 1998.
Maier-Reimer, E.: Geochemical cycles in an ocean general cir-culation model. Preindustrial tracer distributions, Global Bio-geochem. Cycles, 7, 645–677, 1993.
Martin, J. H., Knauer, G. A., Karl, D. M., and Broenkow, W. W.: VERTEX: carbon cycling in the northeast Pacific, Deep Sea Res., 34, 267–285, 1987.
McCave, I. N.: Size spectra and aggregation of suspended particles in the deep ocean, Deep-Sea Res., 31(4), 329–352, 1984. Milliman, J. D. and Droxler, A. W.: Neritic and pelagic carbonate
sedimentation in the marine environment: ignorance is not bliss, Geologische Rundschau, 85, 496–504, 1996.
Milliman, J. D., Troy, P. J., Balch, W. M., Adams, A. K., Li, Y.-H., and Mackenzie, F. T.: Biologically mediated dissolution of calcium carbonate above the chemical lysocline, Deep Sea Res. I, 46, 1653–1669, 1999.
Moore, K. J., Doney, S. C., and Lindsay, K.: Upper ocean ecosystem dynamics and iron cycling in a global three-dimensional model, Global Biogeochem. Cycles, 18, GB4028, doi:10.1029/2004GB002220, 2004.
Passow, U.: Switching perspectives: Do mineral fluxes determine particulate organic carbon fluxes or vice versa?, Geochem. Geo-phys. Geosyst., 5, Q04002, doi:10.1029/2003GC000670, 2004. Passow, U. and De La Rocha, C. L.: Accumulation of mineral
ballast on organic aggregates, Global Biogeochem. Cycles, 20, GB1013, doi:10.1029/2005GB002579, 2006.
Seiter, K., Hensen, C., and Zabel, M.: Benthic carbon mineraliza-tion on a global scale, Global Biogeochem. Cycles, 19, GB1010, doi:10.1029/2004GB002225, 2005.
Stemmann, L., Jackson, G. A., and Ianson, D.: A vertical model of particle size distributions and fluxes in the midwater column that includes biological and physical processes – Part I: model formulation, Deep Sea Res. I, 51, 865–884, 2004a.
Stemmann, L., Jackson, G. A., and Gorsky, G.: A vertical model of particle size distributions and fluxes in the midwater column that includes biological and physical processes – Part II: application to a three year survey in the NW Mediterranean Sea, Deep Sea Res. I, 51, 885–908, 2004b.
Suess, E.: Particulate organic carbon flux in the oceans – Surface productivity and oxygen utilization, Nature, 288, 258–263, 1980. Taylor, K. E.: Summarizing multiple aspects of model performance in a single diagram, J. Geophys. Res., 106, 28 033–28 059, 2001. Tr´eguer, P., Nelson, D. M., van Bennekom, A. J., DeMaster, D. J., Leynaert, A., and Qu´eguiner, B.: The balance of silica in the world ocean: a re-estimate, Science, 268, 375–379, 1995. Tr´eguer, P.: Silica and the cycle of carbon in the ocean, C. R.
Geo-science, 334, 3–11, 2002.
Usbeck, R., Schlitzer, R., Fischer, G., and Wefer, G.: Particle fluxes in the ocean: Comparison of sediment trap data with results from inverse modeling, J. Mar. Sci., 39, 167–183, 2003.
Volk, T. and Hoffert, M. I.: Ocean carbon pumps, analysis of rel-ative strengths and efficiencies in ocean-driven atmosphere CO2
changes, in: The Carbon Cycle and Atmospheric CO2: Natural
Variations Archean to Present, edited by: Sundquist, E. T. and Broecker, W. S., Geophys. Monogr., AGU, Washington, D.C., 32, 99–110, 1985.