A numerical investigation into the effects of parabolic curvature
on the buckling strength and behaviour of stiffened plates under
in-plane compression
Abstract
The main targets of this research are mainly divided in to two parts: (1) identifying the effects of parabolic curvature on the buckling strength and behaviour of stiffened plates under in-plane compression, (2) generating practical graphs for extracting eigenvalue buckling stress of parabolic curved stiffened plate to dimensionless parameters. A parametric model for study of the problem is created. The model in-cludes different parameters related to plate, stiffeners and also parabolic curvature. Three distinct sensitivity cases are assumed. In each sensitivity case, many different models are analysed and their buckling strengths are obtained us-ing a finite element commercial program (ANSYS). Bucklus-ing strength and behaviour of all models with different ratios of parabolic curvature are compared to each other.
Keywords
curved stiffened plate, parabolic curvature, eigenvalue buck-ling, Finite Element Method (FEM), heavy and light stiffen-ing.
Mohammad Reza Khedmatia,∗
and Pedram Edalatb
a
Associate Professor, Faculty of Marine Tech-nology, Amirkabir University of TechTech-nology, Tehran 15914 – Iran
b
PhD Candidate, Faculty of Marine Tech-nology, Amirkabir University of TechTech-nology, Tehran 15914 – Iran
Received 9 Feb 2010; In revised form 12 Apr 2010
∗Author email: [email protected]
1 INTRODUCTION
Un-stiffened and stiffened plates are the primary supporting elements in the construction of thin-walled structures. There are many different combinations of plates and stiffeners, depending on the types of structures and also loads applied to them. Stiffeners may be attached to the plate in either one direction or orthogonal directions, and as a result, unidirectional or orthogonal stiffened plates are produced.
NOTATION
{R}ref Arbitrary reference level of external load
[Kσ]ref Stress stiffness matrix
[K] Conventional stiffness matrix λ Load factor
[δD] Buckling displacements / mode
[D]ref Displacements of the reference configuration
[K]net Total (or) net stiffness
a Plate length
b Projected plate width t Plate thickness
c Maximum height of curvature from the base plane
d Distance between cross-sectional centers of any two neighboring longi-tudinal stiffeners
A Cross-sectional area of longitudinal stiffeners l Sectional modulus of longitudinal stiffeners E Young’s modulus
ν Poisson’s ratio σY Material yield stress
β, α Dimensionless stiffening intensity factor
σCRCurved Critical buckling stress for curved stiffened plate σF lat
CR Critical buckling stress for flat stiffened plate
R Radius Parameter, b2/4c D Flexural rigidity of plate
on this problem applying the finite element method. Experimentally validated numerical simulations were applied by Ghavami and Khedmati, [9] to derive the full-range strength behaviour of stiffened plates.
Above-mentioned literature survey was a representative selection of extensive research works that are done on flat stiffened plates. Flat stiffened plates are commonly used in the most parts of thin-walled structures. In addition to flat configuration, the stiffened plates may be produced also in curved way. In curved regions of thin-walled structures, curved stiffened plates are to be fitted. Some examples of thin-walled structures with applications of curved stiffened plates are submarines, ships and semi-submersibles.
The curved stiffened plates that are mostly used in the constructions of submersibles and submarines have a cylindrical form of curvature. On the contrary, deck and side structures of ships have generally complex curvatures. For instance, the deck plate of the ships is curved in one direction at both fore and aft regions of ship, while it is curved in two directions at the mid-length region, Figure 1. The curvature of stiffened plates in the ship deck structures is of parabolic type in either longitudinal or transverse directions. Transverse and longitudinal curvatures of ship deck plating are so-called ’camber’ and ’sheer’, respectively.
Figure 1 Curvature of ship deck plate.
Since the deck is distant from sectional neutral axis of ship, the state of stresses created in it would be critical. That is why special attention should be paid to the strength evaluation of deck structures. The need to this attention is magnified when remembering the fact that the curvature of deck plate is of parabolic type. To the knowledge of the authors, it can be definitely stated that study of the effects of parabolic curvatures on the strength of stiffened plates is left un-assessed and thus outside the scope of extensive works made by previous researchers. That is why, the present research may be assumed as a starting point to get insights into above-mentioned problem of interest to structural designers.
2 FORMULATION OF EIGENVALUE BUCKLING ANALYSIS
Eigenvalue buckling analysis is performed in this study. The necessary steps in performing eigenvalue buckling analysis or linear bifurcation analysis are briefly explained in the following [6].
The first step is to load the structure by an arbitrary reference level of external load,{R}ref and perform a standard linear analysis to determine element stresses within the models like the membrane stresses in a plate. For stresses associated with load{R}ref, the stress stiffness matrix [Kσ]ref can be evaluated. The effects of membrane stresses on the lateral deflection
are accounted for by the matrix [Kσ]ref which augments the conventional stiffness matrix
[K]. The matrix[Kσ]ref is a function of the elements’ geometry, displacement field and state of membrane stresses.
For a generic load level, obtained by multiplying the reference load by the scalar λ, the stress stiffness matrix can be written
[Kσ]=λ[Kσ]ref when {R}=λ{R}ref (1)
Equations (1) imply that multiplication of all loads Riin {R} by λ also multiplies the
intensity of the stress field by λ but does not alter the distribution of stresses. Because the problem is presumed linear, the conventional stiffness matrix[K] does not depend on loading. Let buckling displacements {δD} take place relative to displacements{D}ref of the reference configuration.
Then because the external loads do not change at a bifurcation point, we have
{ ([K]+λCr[Kσ]ref) {D}ref =λCr{R}ref
([K]+λCr[Kσ]ref) ({D}ref+{δD})=λCr{R}
ref
(2)
Subtraction of the first equation from the second yields
([K]+λCr[Kσ]ref) {δD}=0 (3)
Eq. (3) is an eigenvalue problem whose smallest root λCr defines the smallest level of
external load for which there is a bifurcation, namely
{R}Cr =λCr{R}
ref (4)
The eigenvector {δD} associated with λCr is the buckling mode. Because the magnitude
of {δD} is indeterminate in a linear buckling problem, it defines shape but not amplitude. Actually the terms in the parentheses in Eq. (3) comprise a total or net stiffness [K]net. Because forces [K]net{δD} are zero, it can be said the stresses of critical intensity reduce net stiffness to be singular with respect to buckling mode{δD}. Mathematically,[K]nethas a zero determinant. So the linear bifurcation problem reduces to the following eigenvalue problem
3 FINITE ELEMENT MODELLING
3.1 General
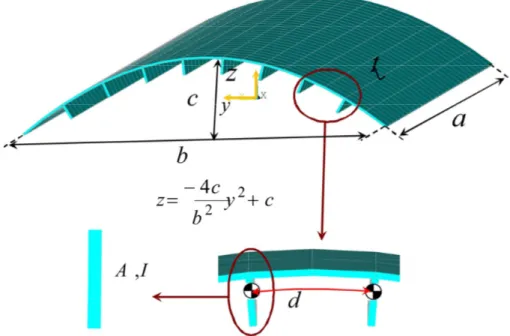
Figure 2 shows the finite element model adopted for study of buckling strength of curved stiffened plates. Different parameters are incorporated into the model in order to clarify the effects of making some variations in them on the buckling strength of curved stiffened models. These parameters include
• plate length,
• projected plate width,
• plate thickness,
• maximum height of curvature from the base plane,
• distance between cross-sectional centres of any two neighbouring longitudinal stiffeners,
• cross-sectional area of longitudinal stiffeners,
• sectional modulus of longitudinal stiffeners
Figure 2 Finite Element model of curved stiffened plate and incorporating parameters.
projected plate width and maximum height of curvature from the base plane. In order to generalise the results, all parameters are transformed to dimensionless forms.
The list of dimensionless parameters and their ranges of variation are given in Table 1. In this table, Zc, c/b and b2/ (4ct) are respectively representing stiffened plate length, stiffened
plate curvature and stiffened plate thickness. Finally, α and β are dimensionless parameters defining the stiffening weight or intensity of curved stiffened plate. Since there is not any design graph in the literature, to the knowledge of the authors, about buckling strength of stiffened plates having parabolic curvature, thus such dimensionless coefficients are defined in similar formats to those for stiffened plates having cylindrical curvatures. For a rapid review of research works performed on the elastic buckling of stiffened plates with cylindrical curvature, reference [5] may be used.
Table 1 Dimensionless parameters and the range of their values.
Value Dimensionless Parameters
10, 20, 40, . . . , 10240 Zc= a
2C
b2t
√
(1−ν2) 0.01,0.03, 0.05, 0.1 C
b
555.56, 625, 714.29, 833.33, 1000 4bct2
0.5, 2 α= A
dt
20, 80 β= EI
Dd
The ranges of variations for the values of these dimensionless parameters in Table 1 are so carefully defined that all probable cases are covered. In order to reach these ranges, statistical data of deck structures in many different merchant ships are gathered and according to them and also other aspects, some logical ranges are assumed.
A combination ofα=0.5 andβ =20 could represent a state of light stiffening for the curved
stiffened plates, while another combination ofα=2 andβ =80 may be relevant to the state of
heavy stiffening for them.
The material used has a modulus of elasticityE=210 GPa, Poisson’s ratioυ=0.3 and yield
stressσY=250 MPa.
The effects of welding residual stresses on the buckling/ultimate strength of welded stiffened curved plates built in steel are negligible. They may reduce the buckling/ultimate strength of welded structures by few percents. In practice, these effects are not considered in modeling and analysis of welded stiffened steel plates.
On the other hand, in the case of welded stiffened curved plates in aluminum alloys, such affects are considerable and thus they have to be considered when modeling and analysis.
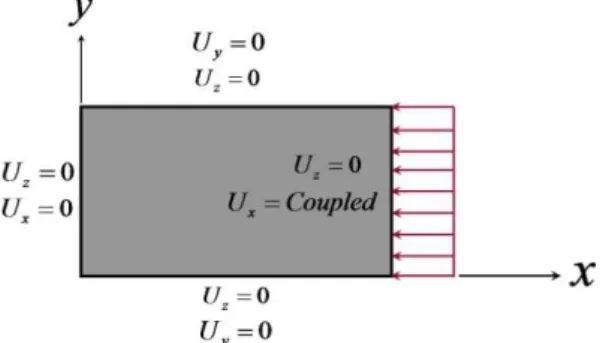
are represented in Figure 3. In the figure 3, x-axis and y-axis are respectively representing the longitudinal and transverse directions of the deck structure. Also, the longitudinal in-plane compression is applied to one of the edges of the model, while keeping the opposite edge un-moved, Figure 3.
Figure 3 Boundary and loading conditions on the model.
3.2 Cases studied for sensitivity analysis
Because of the large number of variable parameters involved in the problem, only three different cases are considered:
Case 1. The dimensionless stiffened plate thickness parameter is assumed constant and
light stiffening condition is considered. Then, the sensitivity of the buckling stress ratio (curved/flat) is studied for different dimensionless stiffened plate curvature parameter and dimensionless stiffened plate length parameter.
Case 2. The dimensionless stiffened plate curvature parameter is assumed constant and
light stiffening condition is considered. Then, the sensitivity of the buckling stress ratio (curved/flat) is studied for different dimensionless stiffened plate thickness parameter and dimensionless stiffened plate length parameter.
Case 3. The dimensionless stiffened plate curvature parameter and dimensionless
stiff-ened plate thickness parameter are both assumed constant. Then, the sensi-tivity of the buckling stress ratio (curved/flat) is studied for different stiffening intensity and dimensionless stiffened plate length parameter.
3.3 Model verification
(a) Verification example (b) Comparison of results for verification example
Figure 4 Verification of the method for analysis. Table 2 Geometric dimensions of verification example. a[mm] b[mm] r[mm] t[mm] I[mm4] A[mm2]
90 90 78 10 16524 271
128 128 155 10 46737 383
156 156 233 10 85862 469
180 180 311 10 132193 541
207 207 408 10 198774 620
255 255 621 10 373899 766
4 RESULTS AND DISCUSSIONS
An extensive number of models as described above, was analysed using the MACRO code run within ANSYS environment. The code enables the user to perform all pre-processing and post-processing activities in a very simple and fast way. In what follows, the results for three sensitivity cases are explained and relevant interpretations are supplied. For a more complete set of finite element results, see Edalat [8].
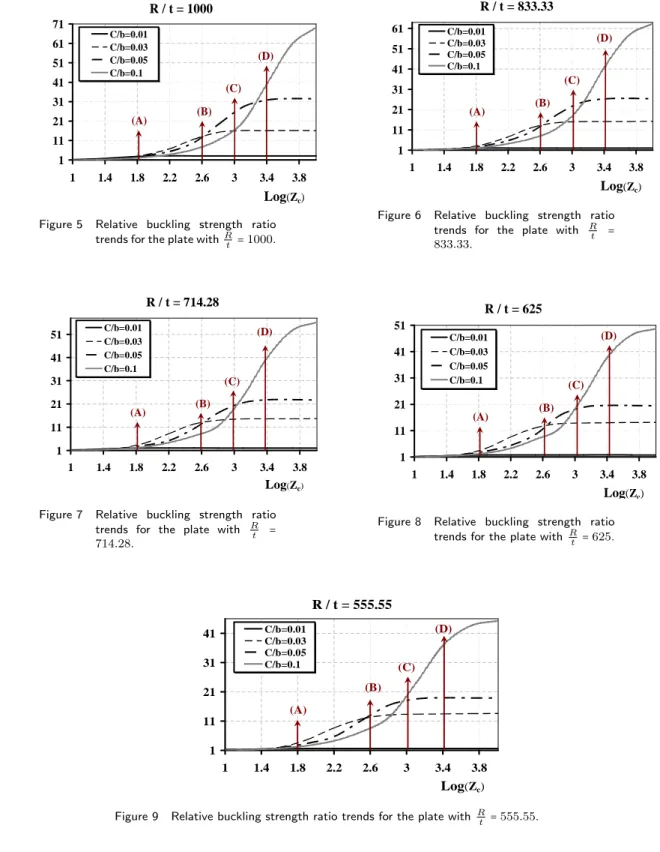
4.1 Sensitivity case study No. 1
Obtained results for this sensitivity case study are all shown in the Figs. 5 to 9. Vertical axis in these figures represents the relative buckling strength ratio. This ratio is calculated by dividing the critical buckling strength of any curved stiffened plate to the critical buckling strength of its corresponding flat stiffened plate obtained through expansion, i.e. σCurvedCR /σF latCR .
R / t = 1000 1 11 21 31 41 51 61 71
1 1.4 1.8 2.2 2.6 3 3.4 3.8 Log(Zc) C/b=0.01 C/b=0.03 C/b=0.05 C/b=0.1 (A) (B) (C) (D)
Figure 5 Relative buckling strength ratio trends for the plate withRt =1000.
R / t = 833.33
1 11 21 31 41 51 61
1 1.4 1.8 2.2 2.6 3 3.4 3.8 Log(Zc) C/b=0.01 C/b=0.03 C/b=0.05 C/b=0.1 (A) (B) (C) (D)
Figure 6 Relative buckling strength ratio trends for the plate with Rt = 833.33.
R / t = 714.28
1 11 21 31 41 51
1 1.4 1.8 2.2 2.6 3 3.4 3.8
Log(Zc) C/b=0.01 C/b=0.03 C/b=0.05 C/b=0.1 (A) (B) (C) (D)
Figure 7 Relative buckling strength ratio trends for the plate with R
t =
714.28.
R / t = 625
1 11 21 31 41 51
1 1.4 1.8 2.2 2.6 3 3.4 3.8 Log(Zc) C/b=0.01 C/b=0.03 C/b=0.05 C/b=0.1 (A) (B) (C) (D)
Figure 8 Relative buckling strength ratio trends for the plate with R
t =625.
R / t = 555.55
1 11 21 31 41
1 1.4 1.8 2.2 2.6 3 3.4 3.8 Log(Zc) C/b=0.01 C/b=0.03 C/b=0.05 C/b=0.1 (A) (B) (C) (D)
Figure 9 Relative buckling strength ratio trends for the plate with R
T
ab
le
3
Bu
cklin
g
m
o
d
es
at
select
ed
p
oin
ts
in
F
igu
re
6.
c
/
b
P
os
ition
(A)
P
os
ition
(B)
P
os
ition
(C
)
P
os
ition
(D
)
0.01
0.03
0.05
From the viewpoint of the curvature effects on the buckling strength of stiffened plate, five different regions may be recognised on the curves shown in Figs. 5 to 9. These regions are explained below
First region: from the origin to the line A in Figs. 5 to 9. In this region, the curvature of any magnitude has more or less similar effects on the buckling strength of curved stiffened plate. It should be noted that due to existing relations among the dimensionless parameters, models with the same values ofZc but having different values of c/bwould
have completely different overall dimensions.
Second region: from the vertical line A to the vertical line B in Figs. 5 to 9. This region accommodates some type of irregularities among the curves. Clearly speaking, the upper and lower bounds in this region are the curves corresponding toc/b=0.03 andc/b=0.01,
respectively. Other curves are located in between.
Third region: from the vertical line B to the vertical line C in Figs. 5 to 9. This region also again accommodates some type of irregularities among the curves. This time, the upper and lower bounds in this region are the curves corresponding toc/b=0.05 andc/b=0.01,
respectively. Other curves are located in between.
Fourth region: from the vertical line D to the end in Figs. 5 to 9. In this region, the curves are arranged from bottom to top regularly as their corresponding curvature is increased.
All of the curves in the Figs. 5 to 9 show similar trends. They have initially a convex regime upwards with slight rates of variations, then they get rapid increases and finally they become concave with a descending tendency. The inflexion points on these curves have different locations; generally their longitude is increased with the increase in the curvature of stiffened plate. It can be understood from these set of figures that the longer the stiffened plates, the greater the effects of parabolic curvature on their buckling strength.
4.2 Sensitivity case study No. 2
Figures 10 to 13 show the obtained results for this sensitivity case study. These sets of curves show how the relative buckling strength ratio of stiffened plates is affected by changing the R/t parameter when thec/bparameter is kept constant. In this part of sensitivity studiesR is constant and thus, the change in R/t means change in thicknesst.
The results that are obtained in this sensitivity case study can be categorised into two different groups. A group of the stiffened plates with low parabolic curvature (c/b=0.01) that
it’s corresponding set of curves is shown in Fig. 10 and another group of the stiffened plates with more increased parabolic curvature (c/b=0.03, 0.05, 0.1) for which the sets of curves are
given in Figs. 11, 12 and 13. This type of division is rising from the trends of the curves showing the effects of curvature on the buckling strength of stiffened plates.
C / b = 0.01 1.0 1.6 2.2 2.8 3.4 4.0
1 1.4 1.8 2.2 2.6 3 3.4 3.8 Log(Zc)
R / t = 1000 R / t = 833.33 R / t = 714.28 R / t = 625 R / t = 555.55
Figure 10 Relative buckling strength ratio trends for the plate with C
b =
0.01.
C / b = 0.03
1.0 5.0 9.0 13.0 17.0
1 1.4 1.8 2.2 2.6 3 3.4 3.8
Log(Zc)
R / t = 1000
R / t = 833.33
R / t = 714.28
R / t = 625
R / t = 555.55
Figure 11 Relative buckling strength ratio trends for the plate with Cb = 0.03.
C / b = 0.05
1.0 7.0 13.0 19.0 25.0 31.0
1 1.4 1.8 2.2 2.6 3 3.4 3.8 Log(Zc) R / t = 1000
R / t = 833.33
R / t = 714.28
R / t = 625
R / t = 555.55
Figure 12 Relative buckling strength ratio trends for the plate with C
b =
0.05.
C / b = 0.1
1.0 11.0 21.0 31.0 41.0 51.0 61.0
1 1.4 1.8 2.2 2.6 3 3.4 3.8 Log(Zc) R / t = 1000
R / t = 833.33
R / t = 714.28
R / t = 625 R / t = 555.55
Figure 13 Relative buckling strength ratio trends for the plate withCb =0.1.
4.3 Sensitivity case study No. 3
In this group of sensitivity studies, the effects of change in the magnitude of parabolic curvature on the increase of the relative buckling strength ratio is investigated for the stiffened plates of the same overall dimensions and boundary conditions but with different stiffening intensities. To achieve this objective, two different sets of curves are derived. The thickness of the plate is changed in these two sets as it isR/t=714.28 andR/t=555.55. In each set, the curvature
is changed among the values of c/b=0.01, c/b=0.05 and c/b=0.1. Two stiffening intensities
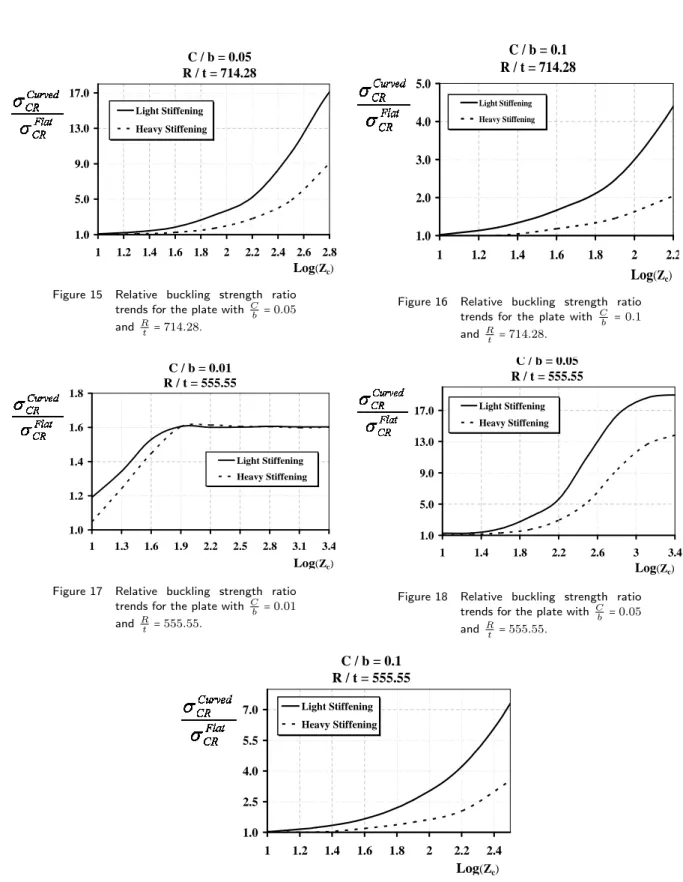
as described in Section 3.1 are applied in both sets of the curved stiffened plate calculations. As summary to above sentences, it should be simply stated that the Figs. 14, 15 and 16 are to be compared with each other, while on the other side, the Figs. 17, 18 and 19 may also be checked against each other.
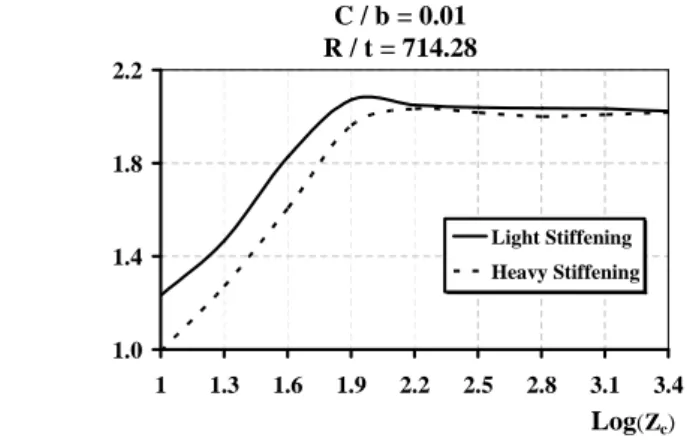
Figure 14 shows the trends of the relative buckling strength ratio versus the length for curved stiffened plates of c/b= 0.1 and R/t= 714.28. Two different cases of light and heavy
stiffening intensities are considered. As can be seen, the effects of parabolic curvature on the relative buckling strength ratio of curved stiffened plates, for which Log(Zc)≤2.2, in case of
light stiffening is much higher than that in case of heavy stiffening. For the curved stiffened plates of larger length parameter, the stiffening intensity does not have any significant effect on the relative buckling strength ratio.
C / b = 0.01 R / t = 714.28
1.0 1.4 1.8 2.2
1 1.3 1.6 1.9 2.2 2.5 2.8 3.1 3.4 Log(Zc) Light Stiffening
Heavy Stiffening
Figure 14 Relative buckling strength ratio trends for the plate with Cb =0.01and
R
t =714.28.
With increasing the parabolic curvature of stiffened plates while keeping their thickness parameter unchanged (Figs. 15 and 16), it is observed that as the length parameter is increased, the relative buckling strength ratio gets a rapid ascending trend versus the length parameter in both cases of light and heavy stiffening arrangements. The ascending rate of the curve is much higher when light stiffening intensity is adopted. Simply speaking, the larger the length parameter, the more increased the relative buckling strength ratio. Also the larger the length parameter, the greater the strengthening effect of light stiffening intensity on the relative buckling strength ratio.
C / b = 0.05 R / t = 714.28
1.0 5.0 9.0 13.0 17.0
1 1.2 1.4 1.6 1.8 2 2.2 2.4 2.6 2.8 Log(Zc) Light Stiffening
Heavy Stiffening
Figure 15 Relative buckling strength ratio trends for the plate with Cb =0.05
and R
t =714.28.
C / b = 0.1 R / t = 714.28
1.0 2.0 3.0 4.0 5.0
1 1.2 1.4 1.6 1.8 2 2.2
Log(Zc) Light Stiffening
Heavy Stiffening
Figure 16 Relative buckling strength ratio trends for the plate with Cb =0.1
and R
t =714.28. C / b = 0.01
R / t = 555.55
1.0 1.2 1.4 1.6 1.8
1 1.3 1.6 1.9 2.2 2.5 2.8 3.1 3.4
Log(Zc) Light Stiffening
Heavy Stiffening
Figure 17 Relative buckling strength ratio trends for the plate with C
b =0.01
and R
t =555.55.
C / b = 0.05 R / t = 555.55
1.0 5.0 9.0 13.0 17.0
1 1.4 1.8 2.2 2.6 3 3.4 Log(Zc) Light Stiffening
Heavy Stiffening
Figure 18 Relative buckling strength ratio trends for the plate with C
b =0.05
and R
t =555.55.
C / b = 0.1 R / t = 555.55
1.0 2.5 4.0 5.5 7.0
1 1.2 1.4 1.6 1.8 2 2.2 2.4
Log(Zc) Light Stiffening
Heavy Stiffening
Figure 19 Relative buckling strength ratio trends for the plate with C
b =0.1and
R
5 CONCLUSION
Buckling strength and behaviour of stiffened plates with parabolic curvature was investigated in details. Different parameters were changed systematically and the effects rising due to their variation on the buckling strength and behaviour of curved stiffened plates were studied. The following conclusions were reached
• Parabolic curvature has significant strengthening effect on the buckling strength of
stiff-ened plates. The magnitudes of such effects are dependent on both plate and stiffener dimensional parameters.
• It was understood that the longer the stiffened plates, the greater the effects of parabolic
curvature on their buckling strength.
• Neglecting a short range of stiffened plate dimensions, generally with the increase in the
plate thickness, the strengthening effect of parabolic curvature on the buckling strength of stiffened plates is decreased.
• The effects of parabolic curvature on the relative buckling strength ratio of curved
stiff-ened plates, for whichLog(Zc)≤2.2, in case of light stiffening is much higher than that
in case of heavy stiffening.
• With increasing the parabolic curvature of stiffened plates while keeping their thickness
parameter unchanged, the relative buckling strength ratio gets a rapid ascending trend versus the length parameter in both cases of light and heavy stiffening arrangements. The ascending rate of the curve is much higher when light stiffening intensity is adopted.
References
[1] ANSYS Inc. ANSYS 11.0 Reference Manual, 2008.
[2] M.A. Bonello, M.K. Chryssanthopouls, and P.J. Dowling. Ultimate strength design of stiffened plates under axial compression and bending.Mar Struct, 6:533–552, 1993.
[3] D. Bushnell. Computerized buckling analysis of shells. Martinus Nijhoff, The Netherlands, 1985.
[4] E. Byklum, E. Steen, and J. Amdahl. A semi-analytical model for global buckling and post buckling analysis of stiffened panels.Thin-Walled Structures, 42:701–717, 2004.
[5] Column Research Committee of Japan, editor. Handbook of structural stability. Corona Publishing Co. Ltd., Tokyo, 1971.
[6] R.D. Cook et al.Concepts and applications of finite element analysis. John Wiley and Sons, New York, 2nd edition, 1981.
[7] P.K. Das, A. Thavalingam, and Y. Bai. Buckling and ultimate strength criteria of stiffened shells under combined loading for reliability analysis. Thin-Walled Structures, 41:69–88, 2003.
[9] K. Ghavami and M.R. Khedmati. Numerical and experimental investigations on the compression behaviour of stiffened plates.J Construct Steel Res, 62(11):1087–1100, 2006.
[10] G.Y. Grondin, A.E. Elwi, and J.J.R. Cheng. Buckling of stiffened steel plates—a parametric study. J Constr Steel Res, 50(2):151–175, 1999.
[11] S.Z. Hu, Q. Chen, N. Pegg, and T.J.E. Zimmerman. Ultimate collapse tests of stiffened-plate ship structural units. Mar Struct, 10:587–610, 1997.
[12] M.R. Khedmati, M.J. Mazaheri, and A.R. Karimi. Parametric instability analysis of stringer stiffened circular cylindrical shells under axial compression and external hydrostatic pressure. InEighth International Conference on Computational Structures Technology, page 163, Canary Islands, Spain, 2006.
[13] N.W. Murray. Buckling of stiffened panels loaded axially and in bending. Struct Eng, 51(8):285–301, 1973.
[14] P. Rigo, T. Moan, P.A. Frieze, and M. Chryssanthopoulos. Benchmarking of ultimate strength rediction for longi-tudinally stiffened panels. InThe Sixth International Symposium on Practical Design of Ships and Mobile Units, page 2, Seoul, Korea, 1995.