Brazilian Microwave and Optoelectronics Society-SBMO received 4 Mar 2013; for review 5 Mar 2013; accepted 5 Sept 2013
Brazilian Society of Electromagnetism-SBMag © 2013 SBMO/SBMag ISSN 2179-1074
Abstract— In this paper, we present an analysis of the resonant
response of modified triangular metallic nanoparticles with polynomial sides. The particles are illuminated by an incident plane wave and the method of moments is used to solve numerically the electromagnetic scattering problem. We investigate spectral response and near field distribution in function of the length and polynomial order of the nanoparticles. Our results show that in the analyzed wavelength range (0.5-1.8) μm these particles possess smaller number of resonances and their resonant wavelengths, near field enhancement and field confinement are higher than those of the conventional triangular particle with linear sides.
Index Terms— Plasmonics, metal nanoparticles, spectral response, resonant properties, near field analysis.
I. INTRODUCTION
The electromagnetic scattering of metals in optical frequency region possesses special
characteristics. At these frequencies, there are electron oscillations in the metals called plasmons with
distinct resonant frequencies, which produce strongly enhanced near fields at the metal surface. The
science of the electromagnetic optical response of metal nanostructures is known as plasmonics or
nanoplasmonics [1].
One of the possible applications of plasmonics is design of nanoantennas which are metal
nanostructures used to transmit, receive, confine and enhance optical electromagnetic fields [2-3].
Several geometries of nanoantennas have been discussed in literature: monopole [4], bowtie [5],
dipole [6] and sphere ones [7]. A detailed analysis of bowtie nanoantenna with different length, bow
angle, thickness, gap distance and radius of its apex curvature is presented in [8]. Examples of
applications of these antennas are ultrahigh-density data storage, super-resolution microscopy,
integrated nano-optical devices and surface-enhanced Raman scattering [1]. Realization of these
nanoantennas in experiments is nowadays possible due the development of modern techniques of
micro- and nanofabrication tools such as focused ion beam milling (FIB), which can reach a
resolution in the fabrication of about 2nm in the curvature radius of metallic tips. Experimental
analysis of nanoantennas is presented in [9]-[13].
Most of these nanoantennas are composed of coupled metal nanoparticles. To understand the
electromagnetic behavior of these nanoantennas is important to investigate the resonances and field
distributions of individual particles. The electromagnetic resonances and field distributions of
Resonant Properties of Modified Triangular
Plasmonic Nanoparticles with Higher Field
Concentration
Karlo Q. da Costa and Victor A. Dmitriev
Brazilian Microwave and Optoelectronics Society-SBMO received 4 Mar 2013; for review 5 Mar 2013; accepted 5 Sept 2013
Brazilian Society of Electromagnetism-SBMag © 2013 SBMO/SBMag ISSN 2179-1074
individual particles depend on their dimensions, material properties and geometry. Some common
metal nanoparticles such as sphere, circular disk and triangular disk have been analyzed in [7, 14-22].
In the conventional triangular nanoparticles, the sides are straight lines. In this paper, we suggest
and analyze triangular nanoparticles which have two of their sides in the form of polynomial curves.
We shall call them modified triangular nanoparticles with polynomial sides. We investigate the
optical response of the proposed gold nanoparticles and the dependence of this response on the length
and polynomial order of the side curves. Near field distributions of electric field are also calculated.
Numerical analysis is fulfilled by our computational code based on the method of moments (MoM)
[23]. The Lorentz-Drude formula with one interband term is used to describe the complex permittivity
of the gold.
We show below that in the analyzed wavelength range (0.5-1.8) μm, modified triangular
nanoparticles with polynomial sides have smaller number of resonances, longer resonant wavelength,
near field enhancement and confinement in comparison with those of the conventional triangular
particles with straight sides.
II. THEORY
The geometries of the investigated nanoparticles are shown in Fig. 1. The polynomial function used
to model the curvature of the lower side is x = (y/k), where k = L/2h1/, h = 0.5L(3)0.5, L is the length
of the conventional equilateral triangle. The upper side is obtained by symmetry reflection of the
lower side in the plane y=0 and the left side is a straight line with length L. The conventional particle
with the linear sides corresponds to the case α = 1. For higher values of α, the tips of the particles are
more acute.
Fig. 1. Geometries of the modified triangular nanoparticles with polynomial sides.
The particles are centered in the origin of the rectangular coordinate system with one tip oriented
along the x-axis. The thickness of the particles is w (it is not shown in Fig. 1). With these parameters,
the right tip on the x-axis is positioned at the point (0.5h; 0; 0). In what follows, we shall investigate
the particles made of gold (Au) with four values α = 1,2,3,4 of the polynomial order of the side
Brazilian Microwave and Optoelectronics Society-SBMO received 4 Mar 2013; for review 5 Mar 2013; accepted 5 Sept 2013
Brazilian Society of Electromagnetism-SBMag © 2013 SBMO/SBMag ISSN 2179-1074
We used Ex polarization because this field excites more efficiently the resonant modes with larger
charge oscillations along the x direction. These oscillations produce strong charge accumulation in the
right tip of the nanoparticles, and consequently higher field concentration near this tip. This behavior
is similar to that observed in RF-microwave dipole antennas in the receiving mode, where the
polarization of the incident wave along the axis of the dipole leads to a larger resonant response.
The numerical analysis of the scattering problem is fulfilled by our MoM code based on the model
proposed in [23], where the equivalent polarization current inside the volume of the particles is
determined by solving the tensor integral equation for the electric field. In this model, the volume of a
particle is divided in the N small cubic subvolumes, where the total electric field is approximately
constant. With this approximation, the integral equation is transformed into a linear system with
Nt=3N equations because there are three electric field components in each subvolume, i.e. Nt is the
total matrix size of the linear system. This MoM code was validated by comparison with the results
obtained by the exact Mie solution for sphere [16] and with the simulations performed by commercial
softwares [17]. The Lorentz-Drude model with one interband term was used to describe the complex
permittivity =0r of the gold particles, where 0 is permittivity of the vacuum and r is defined by
j j p pr22
0 2 2 2 2 1
. (1)
The parameters of this equation are ∞=8, p1=13.8×10 15
s−1, =1.075×10¹⁴s−1, 0=2c/0, 0=450nm,
p2=45×10 14
s−1, and =9×10¹⁴s−1 [1].
III. NUMERICAL RESULTS
Using the developed computational code we simulated the electromagnetic response of the
nanoparticles with different sizes and parameter α. The discretization of the nanoparticles with α = 1,
2, 3, 4 are Nt = 4380, 5310, 4410 and 5328, respectively. With these discretizations we obtained a
good accuracy of the results.
For each nanoparticle with a given α, eight simulations with different values of length L, namely,
L=50, 100, 150, 200, 250, 300, 350 and 400 (all in nanometers) were performed. The thickness w of
the particles with L=50nm are w=Nz×L=4×2nm=8.0nm (Nt=4380), w=Nz×L=5×1.65nm=8.3nm
(Nt=5310), w=Nz×L=5×1.55nm=7.8nm (Nt=4410) and w=Nz×L=6×1.41nm=8.5nm (Nt=5328) for
the particles with α = 1, 2, 3, 4, respectively, where L=x=y=z is the size of the cubic subvolumes
and Nz the number of cubic subvolumes in the z direction. In this discretization, for the particles with
higher values of α, we used finer mesh (smaller L) and higher Nz in order to discretize better the
geometries with more acute tips. The other particles with higher L possess higher thicknesses with
values proportional to the thickness of the case L=50nm. For example, the particle with α = 1 and
Brazilian Microwave and Optoelectronics Society-SBMO received 4 Mar 2013; for review 5 Mar 2013; accepted 5 Sept 2013
Brazilian Society of Electromagnetism-SBMag © 2013 SBMO/SBMag ISSN 2179-1074
It is important to note here that the particles with different α and the same dimension L have the
thickness slightly different because we used in our MoM code cubic discretization (L=x=y=z)
and different values of L and Nz for each case of α. To make the particles with the same thickness,
one can use, for example, a discretization like L=x=y≠z and choose the number of subvolumes
in the z direction Nz and the size z in order to maintain the thickness w=Nz×z constant.
A. Spectral Responses
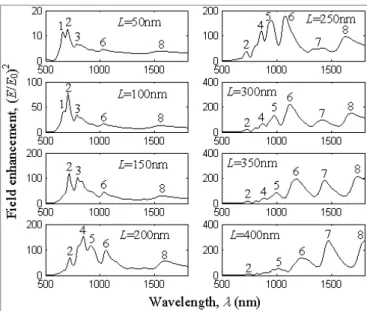
Figs. 2-5 present the spectral responses of the particles. The field enhancement in these figures is
defined by (E/E0) 2
, where E is the total electric field (incident and scattered) near the particle and E0 is
the amplitude of the incident plane wave. In all these results, the field enhancement is calculated at the
distance 10nm from the tip’s particles along the-x axis, i.e. at the point (x = 0.5h+10nm; y = 0; z = 0). We observe in these figures some characteristic resonances where the respective resonant
wavelengths are λi, i = 1, 2, ..8. Some of these resonances for determined values of L are very weak,
for example in Fig. 2 the resonance λ1 is significant only for L = 50nm and L = 100nm and practically
zero for other values of L. These weak resonances are not shown in the figures.
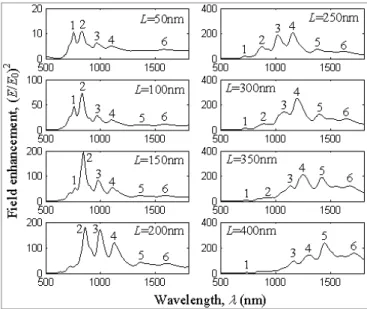
In the investigated frequency band, the number of resonances varies with α. For α = 1, 2, 3, 4 we
have 8 (Fig. 2); 6 (Fig. 3); 6 (Fig. 4); and 2 (Fig. 5) resonances, respectively, so the larger value of α
the smaller is the number of resonances. In general, these resonances are red-shifted for larger lengths
L and polynomial order α.
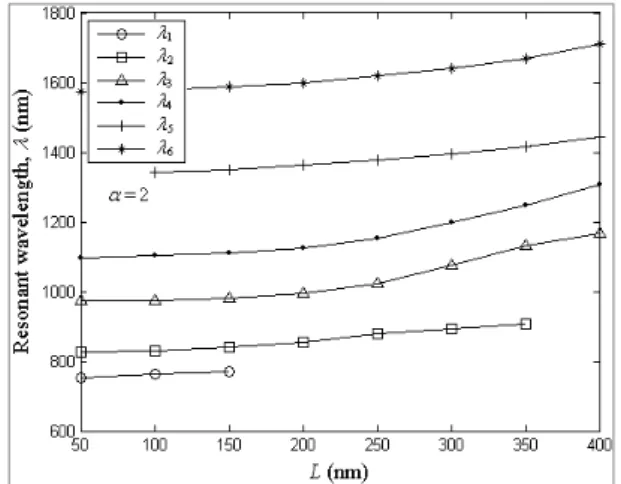
In all the cases shown in Figs. 2-5, we observe an approximately linear increasing of the
wavelengths λi with L. This variation is presented in Figs. 6-9, where we note also increasing of λi
with α. For example, in case of L = 50nm, λ1=660, 754, 903 and 1096nm for α = 1, 2, 3, 4,
respectively.
Fig. 2. Spectral response of (E/E0) 2
Brazilian Microwave and Optoelectronics Society-SBMO received 4 Mar 2013; for review 5 Mar 2013; accepted 5 Sept 2013
Brazilian Society of Electromagnetism-SBMag © 2013 SBMO/SBMag ISSN 2179-1074
Fig. 3. Spectral response of (E/E0)2 near the right tip (x = 0.5h+10nm; y = 0; z = 0) of particles with α = 2 and different L.
Fig. 4. Spectral response of (E/E0)2 near the right tip (x = 0.5h+10nm; y = 0; z = 0) of particles with α = 3 and different L.
Brazilian Microwave and Optoelectronics Society-SBMO received 4 Mar 2013; for review 5 Mar 2013; accepted 5 Sept 2013
Brazilian Society of Electromagnetism-SBMag © 2013 SBMO/SBMag ISSN 2179-1074
Fig. 6. Variation of the resonant wavelengths 1-8 versus L
for particles with =1.
Fig. 7. Variation of the resonant wavelengths 1-6 versus L
for particles with =2.
Fig. 8. Variation of the resonant wavelengths 1-6 versus L
for particles with =3.
Fig. 9. Variation of near field enhancement (E/E0)2 near the
right tip (x = 0.5h+10nm; y = 0; z = 0) (upper figure) and resonant wavelength 1-2 (lower figure) versus L for
particles with =4.
In Figs. 2-5, we see also that the field enhancement (E/E0) 2
of each resonance is gradually increased
and decreased with the variation of L, so that when one resonance is decreased, the next right
resonance is increased. This behavior can be observed for example in the resonances λ2 and λ3 in Fig.
3, where for lower L (L = 50, 100, 150 and 200nm) the field enhancement of λ2 is higher than that of
λ3 but for L=250nm, 300 nm, 350 nm and 400 nm the field enhancement of λ3 is higher than that of λ2.
There exists a value of L for which the maximum of the field intensity (E/E0) 2
is achieved. Figs.
9-12 shows this variation of the field enhancement at resonances λi, i = 1, 2, ...8 versus L for the
modified triangular nanoparticles with =4,1,2,3, respectively. In general we note from these figures
that the field enhancements is increased for larger values of , i.e. the modified triangular
nanoparticles with polynomial sides possess higher field concentration in comparison with the
conventional triangular particle with linear sides. For example, the conventional triangular particle
with L=150nm and α=1 (Fig. 2) possesses maximum near field enhancement of about (E/E0) 2≈110,
and the modified triangular particle with the same size L=150nm and α=3 (Fig. 4) has this parameter
Brazilian Microwave and Optoelectronics Society-SBMO received 4 Mar 2013; for review 5 Mar 2013; accepted 5 Sept 2013
Brazilian Society of Electromagnetism-SBMag © 2013 SBMO/SBMag ISSN 2179-1074
Fig. 10. Variation of field enhancement (E/E0)2 near the right
tip (x = 0.5h+10nm; y = 0; z = 0) at resonances 1-8 versus
size L for particles with =1.
Fig. 11. Variation of field enhancement (E/E0)2 near the
right tip (x = 0.5h+10nm; y = 0; z = 0) at resonances 1-6
versus L for particles with =2.
Fig. 12. Variation of field enhancement (E/E0)2 near the right tip (x = 0.5h+10nm; y = 0; z = 0) at resonances 1-6 versus L
for particles with =3.
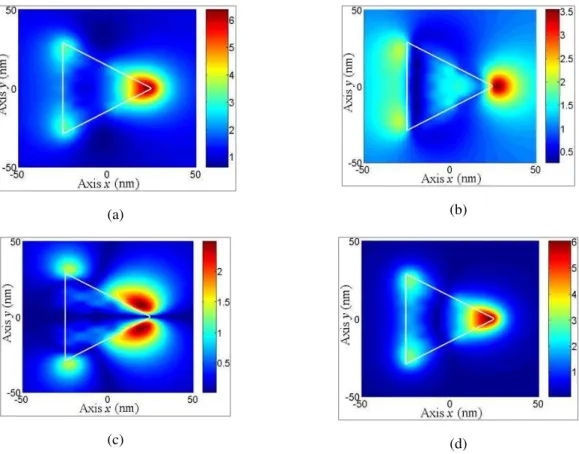
B. Near Field Distributions
Figs. 13-16 present the spatial distributions of the fields near the particles with =1,2,3,4,
respectively. The results show the intensity of the normalized total electric field (E/E0), and the
components x (Ex/E0), y (Ey/E0), and z (Ez/E0) at the plane z=9nm (−50nm<x,y<50nm). This plane is approximately 5nm above the particle’s surface, because the thickness of them are variable, i.e. w=8.0; 8.3; 7.8; and 8.5 (nm) for the particles with =(1,2,3,4) respectively. In these figures, the size
is L=50nm, and wavelengths are 2=703nm (Fig. 13), 2=827nm (Fig. 14), 1=907nm (Fig. 15), and
1=1096nm (Fig. 16).
We see from these results that the modified triangular nanoparticles with higher values of (Figs.
14-16) produce the higher and more confined total fields than the fields of the conventional triangular
particles (Fig. 13). We believe that is due the electrostatic effect of more acute tips, where the electric
field of the incident plane wave excites charges oscillations along the x direction with strong charge
Brazilian Microwave and Optoelectronics Society-SBMO received 4 Mar 2013; for review 5 Mar 2013; accepted 5 Sept 2013
Brazilian Society of Electromagnetism-SBMag © 2013 SBMO/SBMag ISSN 2179-1074
(a) (b)
(c) (d)
Fig. 13. Distribution of the normalized electric field amplitude at plane z=9nm for particle with =1, L=50nm at resonance
2=703nm. (a) total field E/E0. (b) x-component Ex/E0. (c) y-component Ey/E0. (d) z-component Ez/E0.
(a) (b)
(c) (d)
Fig. 14. Distribution of the normalized electric field amplitude at plane z=9nm for particle with =2, L=50nm at resonance
Brazilian Microwave and Optoelectronics Society-SBMO received 4 Mar 2013; for review 5 Mar 2013; accepted 5 Sept 2013
Brazilian Society of Electromagnetism-SBMag © 2013 SBMO/SBMag ISSN 2179-1074
(a) (b)
(c) (d)
Fig. 15. Distribution of the normalized electric field amplitude at plane z=9nm for particle with =3, L=50nm at resonance
1=907nm. (a) total field E/E0. (b) x-component Ex/E0. (c) y-component Ey/E0. (d) z-component Ez/E0.
(a) (b)
(c) (d)
Fig. 16. Distribution of the normalized electric field amplitude at plane z=9nm for particle with =4, L=50nm at resonance
Brazilian Microwave and Optoelectronics Society-SBMO received 4 Mar 2013; for review 5 Mar 2013; accepted 5 Sept 2013
Brazilian Society of Electromagnetism-SBMag © 2013 SBMO/SBMag ISSN 2179-1074
The calculations of the electric field components at the reference plane z = 9nm shown in Figs.
13-16 lead to the following conclusions. The Ez-component is higher than the other components near the
right tip. The Ex-component is more confined in front of the tips for x > 0.5h (Figs. 13b, 14b, 15b, and
16b), and the other field components in this region are very small. The Ey-component possesses higher
intensity above (y>0) and below (y<0) of the right tip as shown in Figs. 13c, 14c, 15c, and 16c. These
field distributions are similar to those produced by electrostatic charges concentrated in a small
volume in the plane zcharge = 0 with the observation plane different from the charge plane, i. e. for zobs
≠ 0. This occurs because the electric field lines are oriented in radial directions away from the charges. These results show again that there is a higher concentration of charges in the right tips of the
particles, and this concentration is more pronounced for larger values of .
IV. CONCLUSIONS
In this paper, we presented a theoretical analysis of the resonances of modified triangular gold
nanoparticles with polynomial sides. We showed that in the analyzed wavelength range, the number
of resonances of the proposed particles with larger values of polynomial order is reduced. For
example, the conventional triangular particle has eight resonances, and the modified one with
polynomial order equals to four has two resonances. We also demonstrated that the modified particles
have resonant wavelength, near field enhancement and confinement higher than those of the
conventional triangular particle with linear sides. These novel particles can also be useful in design of
nanoantennas.
ACKNOWLEDGMENT
The authors would like to thank the reviewers for comments that significantly improved the text.
REFERENCES [1] L. Novotny, Principles of Nano-Optics, Cambridge, New York, 2006.
[2] L. Novotny, and N. V. Hulst, “Antennas for light,” Nat. Photon., vol. 5, Feb. 2011.
[3] P. Biagioni, J.-S. Huang, and B. Hecht, “Nanoantennas for visible and infrared radiation,” Rep. Prog. Phys., vol. 75, p. 024402, 2012.
[4] T. H. Taminiau, et al., “Near-Fields driving of an optical monopole antenna,” J. Opt. A: Pure Appl. Opt., vol. 9, S315– S321, 2007.
[5] B. Hecht, et al., “Prospects of resonant optical antennas for nano- analysis,” Chimia, vol. 60, pp. 765–769, 2006. [6] H. Fischer, and J. F. Martin, “Engineering the optical response of plasmonic nanoantennas,” Opt. Express., vol. 16, pp.
9144–9154, 2008.
[7] R. Kappeler, et al., “Field computation of optical antennas,” J. Comp. Theor. Nano., vol. 4, pp. 686–691, 2007. [8] J. W. Liaw, “Analysis of a bowtie nanoantenna for the enhancement of spontaneous emission,” IEEE J. Selec. Top.
Qua. Elec., vol. 14, pp. 1441–1447, 2008.
[9] T. H. Taminiau, et. al., “Near-fields driving of a optical monopole antenna”, J. Opt. A: Pure Appl. Opt., vol. 9, pp. S315-S321, 2007.
[10]B. Hecht, et. al., “Prospects of resonant optical antennas for nano- analysis”, Chimia, vol. 60(11), pp. 765-769, 2006. [11]P. Mühlschlegel, et. al., “Resonant optical antennas”, Science, vol. 308(5728), pp. 1607-1609, June 2005.
[12]E. Cubukcu, et. al., “Plasmonic laser antenna”, Appl. Phys. Lett., vol. 89, pp. 93120, 2006.
[13]W. Rechberger, et. al., “Optical properties of two interacting nanoparticles”, Opt. Com., vol. 220, pp.137-141, March 2003.
[14]W. Rechberger, et al., “Optical properties of two interacting gold nanoparticles,” Opt. Commu., vol. pp. 220, 137–141, 2003.
[15]J. Nelayah, et al., “Mapping surface plasmons on a single metallic nanoparticle,” Nat. Phys., vol. 3, pp. 248–353, 2007. [16]K. Q. Costa, and V. Dmitriev, “Comparative analysis of circular and triangular gold nanodisks for field enhancement
Brazilian Microwave and Optoelectronics Society-SBMO received 4 Mar 2013; for review 5 Mar 2013; accepted 5 Sept 2013
Brazilian Society of Electromagnetism-SBMag © 2013 SBMO/SBMag ISSN 2179-1074
[17]N. W. Pereira, K. Q. Costa, and V. Dmitriev, “Development of computational 3D MoM algorithm for nanoplasmonics,”
J. of Micro., Opt. and Electro. Appl., vol. 12, N2, p. 159-169, 2013.
[18]B. Sturman, E. Podivilov, and M. Gorkunov, “Metal nanoparticles with sharp corners: universal properties of plasmon
resonances,” A Letters J. Exploring the Frontiers of Phys., vol. 101, p. 57009, Mar. 2013.
[19]J. P. Kottmann, et al., “Dramatic localized electromagnetic enhancement in plasmon resonant nanowires,” Chem. Rev. Lett., vol. 314, pp. 1-6, Jun. 2001.
[20]J. P. Kottmann, et al., “Plasmon resonances of silver nanowires with a nonregular cross section,” Phys. Rev. B, vol. 64, p. 235402, Nov. 2001.
[21]J. P. Kottmann, and O. J. F. Martin, “Influence of the cross section and the permittivity on the plasmon-resonance
spectrum of silver nanowires,” Appl. Phys. B, vol. 73, pp. 299-304, 2001.
[22]J. P. Kottmann, et al., “Spectral response of plasmon resonant nanoparticles with a non-regular shape,” Opt. Express, vol. 6, N11, pp. 213-219, May 2000.