Brazilian Microwave and Optoelectronics Society-SBMO received 29 Apr 2013; for review 30 Apr 2013; accepted 14 Aug 2013
Brazilian Society of Electromagnetism-SBMag © 2013 SBMO/SBMag ISSN 2179-1074
Abstract—The analysis of a Ka-band gyrotron Travelling Wave Tube (gyro-TWT) amplifier using a uniform cylindrical waveguide as its interaction circuit has been presented for the TE01mode of
operation a self-consistent nonlinear analysis in the large signal regime. The analysis predicts that the saturated peak output power of ~ 134 kW with a power conversion efficiency of ~ 22.7 %. The saturated gain has been calculated as ~ 41.3 dB for the amplifier driven by 72 kV, 8.2 A electron beam of a pitch factor 1.05. The critical interaction length of smooth wall uniform metal guide is found 10.7 cm for the stable amplifier operation. The form factor and the norm factor have also been estimated with the large signal non-linear code. Further, for 5% spread the amplifier develops the peak power of ~ 128 kW with an electronic efficiency of ~ 21.7 % and the gain of ~ 41.07 dB. These results are found to be good harmony when the beam wave interaction is studied with a commercial 3-D electromagnetic particle in cell (PIC) code. The behaviour of the beam all over the length of the interaction circuit has been monitored by calculating its energy, momentum, phase, etc. with the help of a commercial PIC code and which also in good agreement with analytical results with 1% deviation.
Index Terms — Gyrotron, traveling wave tube amplifier, large signal analysis, Phase bunching, electromagnetic PIC simulation.
I. INTRODUCTION
High gain and wide bandwidth characteristics of the gyrotron traveling wave tube (gyro-TWT) amplifiers make them attractive in the millimetre wavelength range for applications in, next generation imaging radars (near 35 and 94 GHz), detection of space debris, precision tracking, high density communications, particle acceleration, materials characterization, plasma heating and solid state diagnostics, linear colliders, power beaming and electron cyclotron resonance heating of fusion plasmas, etc. [1]. Gyro-TWT is an amplifier in the gyrotron device family and works on the principle of electron cyclotron resonance maser (CRM) instability, which involves the interaction of energetic gyrating relativistic electrons with a transverse waveguide mode. In CRM devices, the coherent radiation is produced by the phase bunching of the mildly relativistic electrons gyrating in their
Analysis and PIC Simulation of a Gyrotron
Travelling Wave Tube Amplifier
M.Thottappan1, Surya Prakash Singh2, and P.K.Jain3
Brazilian Microwave and Optoelectronics Society-SBMO received 29 Apr 2013; for review 30 Apr 2013; accepted 14 Aug 2013
Brazilian Society of Electromagnetism-SBMag © 2013 SBMO/SBMag ISSN 2179-1074
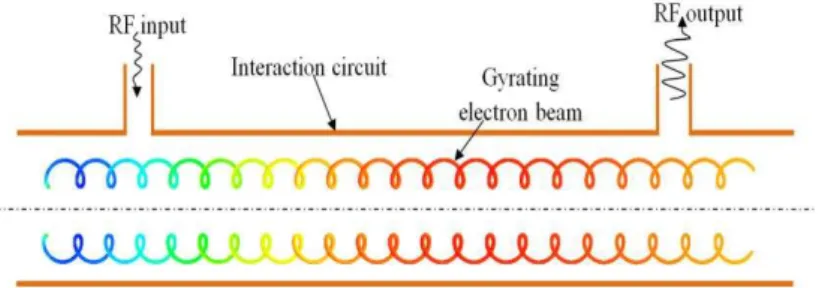
Larmor orbits around the guiding centre [2]. The RF interaction system of a gyro-TWT amplifier consists of three major components, including gyrating electron beam, static magnetic, and an RF interaction circuit. Since, the adjustment of electron beam parameters and the static magnetic field have been limited, most of the research interests were mainly focused on the RF interaction circuits. A variety of RF interaction circuits generates diversity of the gyro-TWT amplifiers; therefore, by and large, the research and development of the RF interaction circuits is continuously improving the performance of the gyro-TWT amplifiers [3].
In a gyro-TWT amplifier, an injected RF wave is amplified by the CRM interaction mechanism of the EM waves with the gyrating annular electron beam in a waveguide. The utilization of a non-resonant fast-wave circuit enhances the output power and bandwidth of the amplifier in millimeter and sub-millimeter wavelength region [2]. However, relatively longer traveling-wave interaction circuit, rather than the short resonant cavities utilized by most members of the gyrotron devices, is a copious source of instabilities, which in turn encourages severe spurious unwanted oscillation problems and subsequently hold backs practical applications [3]. When the interaction involves the
gyrating motion of electrons in a static magnetic field ‘B0’, the synchronism requires that
(1)
where, 'ω' is the angular frequency, 'kz' is the axial propagation constant, 'vz' is the axial velocity of
electrons, 's' is the cyclotron harmonic number and 'Ωc' is the relativistic electron cyclotron frequency.
The CRM based devices received attention in late 1950s, beam wave interaction mechanism using linear theory has been reported in the early 1960s and soon after, in the middle of 1960s, the nonlinear analysis was reported in the Soviet literature [4]. In the West, the non-linear analysis for gyro-TWT amplifier has been reported in late 1970s [5]-[7] and subsequently, non-linear analysis of relativistic gyro-TWT amplifier has been developed in early 1980s [8]-[10]. The preliminary work on gyro-TWT amplifier done by Chu et al. in 1977 at Novel Research Laboratory (NRL) using linear theory and a numerical simulation code which form the basis of theoretical calculations [6]. Subsequently, in 1979 Seftor et al. demonstrated first ever experimental gyro-TWT with an operating frequency of 35 GHz at the NRL and achieved a stable gain of 17 dB and an output power of 10 kW (unsaturated). The gain was linear over a dynamic range >30 dB [11]. Consequently, in 1980 Barnett et al. at NRL demonstrated an experiment for the gain enhancement and stability improvement of this amplifier by employing a resistively loaded interaction circuit. This experiment gave 3.2 kW power, 42 dB saturated gain, 1.5% efficiency with a 3 dB bandwidth of 2% [12]. In 1981, Varian associates inc. reported a C-band dominant circular electric mode gyro- TWT experiment that produced 120 kW power, 18 dB saturated gain, 26% efficiency with a 3 dB bandwidth of 6% at [13], [14].
Brazilian Microwave and Optoelectronics Society-SBMO received 29 Apr 2013; for review 30 Apr 2013; accepted 14 Aug 2013
Brazilian Society of Electromagnetism-SBMag © 2013 SBMO/SBMag ISSN 2179-1074
Chu et al. in 1989at National Tsing Hua University (NTHU), Taiwan experimentally demonstrated a
Ka-band gyro-TWT amplifier that developed 18.4 kW power, with an electronic efficiency of 18.6% and bandwidth of ~10% [15] and immediately in the next year, a millimeter wave gyro-TWT employing a sever was experimented in order to improve the stability and that produced 27 kW power, 35 dB saturated gain, 16% efficiency with 7.5% bandwidth [16]. In the early 1995, NTHU employed distributed wall section to make the efficient study of oscillation suppression and obtained 62 kW power, 33 dB saturated gain, 21% efficiency and 3 dB bandwidth of 12% at 35 GHz [17]. The mode competition in gyro-TWT amplifiers is sophisticatedly connected to instabilities, circuit losses,
and reflective feedback. In the late 1990’s the physical origins of spurious oscillations were reported and characterized by Chu et al. at NTHU. The basic knowledge of these processes leads to the concept of an ultra high gain scheme which employs distributed wall losses for the suppression of spurious oscillations. A proof-of-principle Ka-band, TE11 mode stable gyro-TWT experiment at zero
drive has produced 93 kW saturated peak power with the gain of 70 dB and a 3 dB bandwidth of 3 GHz. [18]. At the starting of 21st century at NRL, Nguyen et al. designed a Ka-band TE11 mode
gyro-TWT with high thermal conductivity ceramic elements that produced 78 kW power, 60 dB saturated gain, 19% efficiency with a 3 dB bandwidth of 17.1% [19]. Further, in 2002 Garven et al.
experimentally demonstrated a Ka-band lossy ceramic loaded TE01 gyro-TWT which developed 137
kW power, 47 dB saturated gain, 17% efficiency with a 3 dB bandwidth of 3.3% [20].
During the last two decades, many computer codes have been developed and used for the analysis and design of the gyro-TWTs [21]. Nevertheless, more recently, numerical techniques, like, finite difference time domain (FDTD) method, finite integration (FI) method, etc. have been used for modeling and simulation of such devices. PIC simulation of 35 GHz, 150 kW gyro-TWT has been carried out by Reddy et al. using an FI based algorithm in 2010 [22]. In 2011, Shou-XI Xu et al. have studied the beam wave interaction mechanism in a Ka- band gyro-TWT including a severed structure using a particle in cell code (FDTD based). The amplifier outputs a peak power of 155 kW with a power conversion efficiency of 22 % using 70 kV, 10 A electron beam [23].
The remainder of this article is organized as follows. Section II describes the self consistent non-linear analysis based on a set of equations for single mode operation of the gyro-TWT amplifier. This formalism allows studying the beam-wave interaction behavior, the norm and forming factors, effect of various parameters on the performance of the device and described in section III. Section IV describes PIC simulation of the gyro-TWT to validate the analytical results and finally conclusions are drawn in section V.
II. SELF-CONSISTENT NONLINEAR ANALYSIS
Brazilian Microwave and Optoelectronics Society-SBMO received 29 Apr 2013; for review 30 Apr 2013; accepted 14 Aug 2013
Brazilian Society of Electromagnetism-SBMag © 2013 SBMO/SBMag ISSN 2179-1074
⃗ { { } { } ( )} (2)
⃗⃗ { { } { } ( )} (3)
where functions Es and Hs describe the transverse electric and magnetic fields of the structure, is
the angular frequency, C(z) is the amplitude, rt is the transverse coordinate and kz,c is the axial
propagation constant of the waveguide, in absence of the electron beam. In the presence of a source, such as an electron beam, the field amplitudes are functions of z and kz ≠ kz,c where kz is the
propagation constant of the source present system. In presence of electron beam, the electric and magnetic fields can be represented as
⃗ { { } { }
̂ } (4)
⃗⃗ { { } { } } (5)
The electron beam can be represented in the current density form as
{ ⃗⃗⃗⃗⃗⃗ ̂ } (6) where, jω,z determines the shift in fields due to the presence of electron beam. The force on the electron beam can be represented by the Lorentz force equation
⃗⃗⃗ { ⃗ ⃗⃗⃗⃗ ⃗ } , (7)
where ⃗⃗⃗⃗ ̂ ⁄ ⁄ ̂ is an external magnetic field, is the momentum of the electrons, and is the velocity of the electrons. The coupled momentum equation is given by [24]:
[ ̇ ] { { } } (8)
Here, ‘s’ is the harmonic number, ⁄ , and
{ { } } (9)
{ { } }
(10)
Where, ⃗⃗⃗⃗ ⃗⃗⃗⃗⃗ ),
⁄ , is the axial phase constant, is
the transverse phase constant, ‘k’ is the free space propagation constant, ⁄ is the normalized amplitude, h= kz/k is the ratio of axial propagation constant to free space propagation
constant, is a slowly variable gyro-phase of the resonant cyclotron harmonic with respect to the phase of the forward wave.
The large signal operation of the gyro-TWT can be described by the following set of equations, known as pendulam equations, for the changes in electron energy, phase, and in the wave amplitude along the axis of the interaction circuit. In the stationary regime, those equations are written as [2], [4], [24]:
{ } (11)
̅ ̅
Brazilian Microwave and Optoelectronics Society-SBMO received 29 Apr 2013; for review 30 Apr 2013; accepted 14 Aug 2013
Brazilian Society of Electromagnetism-SBMag © 2013 SBMO/SBMag ISSN 2179-1074
{ }
(13)
where, ⁄ is the normalized variable describing the changes in electron energy, ‘ z0’ and ‘ t0’ are the initial axial and orbital velocities of the electrons, respectively
and are normalized to the speed of light, ‘ ’ is the electron energy normalized to the rest energy, and ‘ 0’ is its initial value determined by the beam voltage ‘V0’
(14)
In equations (11) – (13), z' = kz is the normalized axial coordinate, the parameter
̅ ⁄ which shows how changes in electron energy affect the
synchronism between the particle and the EM wave. ⁄ is the recoil factor which signifies that how the changes in process of axial momentum of electrons giving up their kinetic energy to the EM wave. ‘ ̅’is the normalized cyclotron resonance mismatch between the Doppler-shifted wave frequency ‘ ’ and the resonant harmonic of the electron–cyclotron
frequency ‘ ’, also known as detuning parameter. If the electron axial velocity and the axial wave number are not too large, then
̅
(15)
In equation (13), ‘F(z)’ is the normalized wave amplitude and which is given by
{ }
{ } { } (16)
where, is the normalized transverse wave number and kt is the tranverse propagation
constant. The axial dependence of the wave envelope A’(z) determined by equation (13) which describes the wave amplification. The normalized current is written for a thin hallow annular electron beam as
| |
| { }| (17)
A. Form and Norm Factors of the Interaction Circuit (Cylindrical Waveguide)
The form factor (Ls) signifies the coupling between the cyclotron wave and the resonant waveguide
mode in a gyro-TWT amplifier. It depends on the transverse dimension of the arbitrary shape interaction circuit and can be written as [24]:
{ }
{ (18)
The differential operator in equation (18) describing the transverse structure of the interaction circuit and where the Lorentz force acting on electrons with transverse coordinates of a guiding center X and
Y. The ψ{X,Y}is called the membrane function for the Helmholtz's equation, which satisfies corresponding boundary conditions. The field inside the interaction circuit is expressed in terms of the membrane function
Brazilian Microwave and Optoelectronics Society-SBMO received 29 Apr 2013; for review 30 Apr 2013; accepted 14 Aug 2013
Brazilian Society of Electromagnetism-SBMag © 2013 SBMO/SBMag ISSN 2179-1074
where, θis the azimuthal angle, 'Rw' is the radius of the interaction circuit and Cmn is the normalization
parameter and for the transverse electric (TEmn) mode of operation which is defined as [24]:
√ ( ) { } (20)
Here, m is the azimuthal index of the wave. Substitute equations (19) and (20) in (18) and, the form factor of the interaction circuit can be obtained as
| | { } (21)
where ‘Rg’ is the mean guiding centre radius, the minus and plus signs in the order of the Bessel's
function correspond to the co- and counter rotating waves with respect to electron gyration, respectively.
Then, the norm factor (Ns) describes the RF power propagating through the interaction circuit per
unit area. The norm factor of the interaction circuit (cylindrical waveguide) is evaluated as [24]:
{ ⃗⃗⃗⃗ ⃗⃗⃗⃗ ⃗⃗⃗⃗ ⃗⃗⃗⃗ } ⃗⃗⃗⃗ (22)
where ⃗⃗⃗⃗ is the normal to the interaction circuit's cross section and is the free space wave impedance.
B. Power and Efficiency
The power propagating along the interaction circuit is calculated using the Poynting’s vector and can be given by [24]:
{ ⃗⃗⃗⃗ ⃗⃗⃗⃗ ⃗⃗⃗⃗ } (23)
The corresponding electronic efficiency of gyro-TWT amplifier is defined as the ratio of the grown RF power to the applied DC beam power and is estimated as [4]:
(24)
where, is the orbital efficiency which characterizes the changes in the electron orbital momentum in the interaction mechanism.
Fig. 1. Schematic diagram of the RF interaction circuit for gyro-TWT amplifier.
III. NUMERICAL COMPUTATIONS
Brazilian Microwave and Optoelectronics Society-SBMO received 29 Apr 2013; for review 30 Apr 2013; accepted 14 Aug 2013
Brazilian Society of Electromagnetism-SBMag © 2013 SBMO/SBMag ISSN 2179-1074
A. Dispersion Relation and Coupling Coefficient
The dispersion diagram of the Ka-band gyro-TWT amplifier for the desired TE01 mode at
fundamental harmonic operation has been shown in Fig. 2 (a) and there is certain finite width of unstable region on the intersection of the beam mode and the desired TE waveguide mode. If this unstable region is confined to the forward wave region (kz > 0) only then the RF wave will travel
down the interaction circuit with convectively growing amplitude. However, if the cyclotron harmonic beam-wave synchronism lines cross in the region where the propagation constant is negative (kz < 0), which generates an internal feedback route and thereby the backward wave
oscillation is generated. In addition, the grazing intersection point is chosen as an operating point in order to achieve high gain, which is at near cut-off as shown in Fig. 2(a). As the beam current is large enough, the unstable spectrum extends into backward-wave region which cause convective instability transitions into absolute instability as shown in Fig. 2(a).
TABLE I.OPTIMIZED DESIGN PARAMETERS OF GYRO-TWT AMPLIFIER
Particulars Value
Electron Beam Voltage, V0 72 kV
Electron Beam Current, I0 8.2 A
Operating mode TE01
Operating frequency, f 35 GHz
Cut-off frequency, fc 33.78 GHz
Velocity pitch, α 1.05
Axial velocity spread 0 %
Circuit radius, Rw 5.5 mm
Guiding center radius, Rg 0.48 Rw
Fig.2. (a) Dispersion diagram of operating mode (TE01) and possible nearby competing modes for a 35 GHz gyro-TWT
amplifier (V0 = 72 kV, α =1.05, B0=1.27 T) and (b) coupling co-efficient on the electron beam’s guiding centre radius for
three nearby competing modes with TE01 mode in the RF interaction circuit.
The strongest nearby competing modes that remain in the RF interaction circuit are the TE21 and TE11, which are called backward-waveinteraction modes. The TE31 mode is called a forward wave
interaction mode that compete less with the desired TE01 mode. The Fig. 2 (a) also shows the grazing
of the fundamental beam mode line and the desired TE01 waveguide mode line and which is the (b)
Brazilian Microwave and Optoelectronics Society-SBMO received 29 Apr 2013; for review 30 Apr 2013; accepted 14 Aug 2013
Brazilian Society of Electromagnetism-SBMag © 2013 SBMO/SBMag ISSN 2179-1074
optimum operating point of 35 GHz gyro-TWT amplifier. The Fig. 2 (b) shows the dependence of the coupling strength on the electron beam radial placement for the desired and its nearby modes. The guiding center radius has been chosen, Rg/Rw = 0.48, to minimize the interaction of various nearby
competing modes.
B. Analysis of Start Oscillation Mechanism
The start oscillation current of gyro-TWT amplifier has been calculated in order to study its stability. Parametric dependences of the start oscillation current (Isat)of possible competing modes,
like, TE11, TE21 and the desired TE01 operating modehave been shown in Fig. 3 (a)-(c) [(a) Isatversus
the interaction circuit length (L), (b) Isat versus the beam axial velocity spread Δvz /vz, and (c) Isat
versus the velocity ratio (α), respectively]. It is observed from Fig. 3 (c) that Isat of the TE11 mode is
more susceptible to the velocity ratio (α), nevertheless, it is weakly susceptible to the length (L) of the RF interaction circuit and the beam velocity spread (Δvz /vz) as shown in Figs. 3 (a) and 3 (b),
respectively. On the contrary, Isatof other modes is sensitive to some extent with respect to interaction
length (L), and beam spread (Δvz /vz) and then become stable. As a general rule, the optimization of
power, gain, efficiency, and bandwidth which all require a high operating current (Ib) and hence, the
start oscillation current (Isat) of all spurious oscillating modes becomes the key design constraint.
Fig. 3. Parameter dependence of start oscillation current (a) Isat versus Interaction Length (b) Isat versus beam velocity spread
(c) Isat versus Pitch factor.
C. Numerical Results and Discussion
In order to depict the electron beam and RF wave interaction phenomenon, a self-consistent set of three coupled equations in terms of normalized parameters, namely, length (µ), detuning parameter
(Δ) and field amplitude (F), (11) to (13), have been solved numerically. Initially, the field amplitude
(a) (b)
Brazilian Microwave and Optoelectronics Society-SBMO received 29 Apr 2013; for review 30 Apr 2013; accepted 14 Aug 2013
Brazilian Society of Electromagnetism-SBMag © 2013 SBMO/SBMag ISSN 2179-1074
of the RF signal along the length of the interaction circuit has been computed, shown in Fig. 4 (a). The electrons energy contained along the length of the interaction circuit have been shown in Fig. 4 (b) and which reveals that the modulation of momentum of particles along the axial length of the interaction circuit. As a result of phase bunching of electrons in each velocity class along the propagation direction, the energy exchange taking place. Due to the interaction between the annular electron beam and the applied RF signal at the same time energy distribution of electrons changes. At the output end, the net electron energy is negative which reveales that electrons transferred their energies to the RF field. The bunching of all the particles exists in the nearly middle of the interaction circuit. Once particles transferred their energy to RF field, the de-bunching takes place.
Fig. 4. (a) Calculated normalized field amplitude and (b) energy of electrons along length of the interaction circuit.
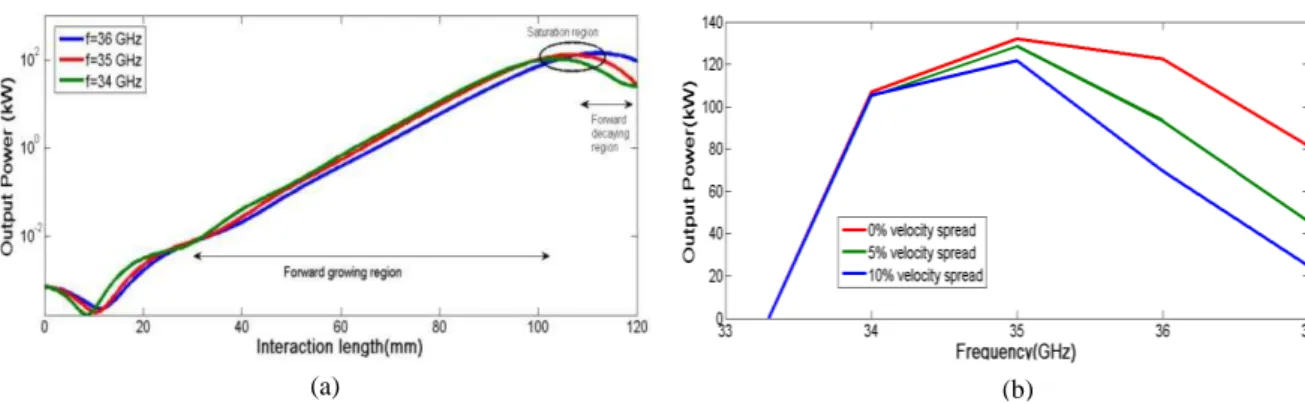
Fig.5. (a) RF power growth along the axial direction of the interaction circuit and (b) frequencies dependence of RF power output for various velocity spreads.
Fig. 6. (a) Axial power profile for different velocity spread and (b) calculated efficiency of the Ka-band gyro-TWT amplifier using self-consistent equations.
(b) (a)
(b) (a)
Brazilian Microwave and Optoelectronics Society-SBMO received 29 Apr 2013; for review 30 Apr 2013; accepted 14 Aug 2013
Brazilian Society of Electromagnetism-SBMag © 2013 SBMO/SBMag ISSN 2179-1074
Fig. 5 (a) shows the amplification profile along the propagation direction at different RF input signal frequencies.
The input signal power has been kept as constant at 10 Watts for all of these
input signal frequencies.
The position of saturation point in the beam wave interaction varies with respect to operating frequency of the device and also length of saturation at low frequencies is shorter than high frequencies. There are three regions named as forward growing, saturation, and forward decaying region and it was found that the maximum saturated peak power obtained as ~ 134 kW at a critical interaction length of 10.7 cm without taking any spread of particles. In the forward growing region, the power increases gradually and in the saturation region, where the power is extracted from the beam. The third region, forward decaying region, where the RF power get reduces due to transfer of RF energy to the electron beam.The velocity spread has been a limiting factor on the performance of the device. As spread in electron velocity increases, the peak power decreases because, the spread in electron axial velocity causes the inhomogeneous Doppler broadening of the cyclotron resonance band, which in turn deteriorates the efficiency of the device. Although, the device is operated close to cut-off, the differences in electron axial velocities make a difference in electron transit times through the interaction region, which spoils the efficiency of the device. This effect has been studied using the equations (11) - (13) and which are illustrated in Figs. 5 (b), 6 (a) and 6 (b). The theory implies that the axial velocity spread significantly reduces the peak power and hence the bandwidth which is shown in Fig. 5 (b). For 0% velocity spread, the peak power and the bandwidth are high at 35 GHz.
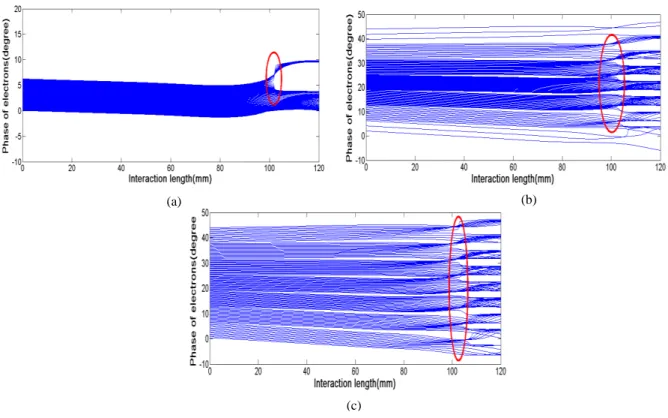
Fig. 7. Phase variation of electrons along the interaction circuit for (a) 0 %, (b) 5 % and (c) 10 % velocity spreads. (b)
(a)
Brazilian Microwave and Optoelectronics Society-SBMO received 29 Apr 2013; for review 30 Apr 2013; accepted 14 Aug 2013
Brazilian Society of Electromagnetism-SBMag © 2013 SBMO/SBMag ISSN 2179-1074
The detuning (cyclotron resonance mismatch) parameter,
D,
which describes the electron slippage with respect to the electromagnetic field, described by equation (12). This makes a difference in the axial velocity of the beam, which in turn affect the performance of the gyro-TWT amplifier. This effect has been shown in Figs. 7 (a), 7 (b) and 7 (c) for different axial velocities say 0%, 5% and 10%, respectively and this show the phase bunching of electrons at different axial velocity spreads. While the spread increases, the electron transit time difference also increases, and hence electrons interact with the RF field at different phases, so that the power extraction efficiency reduces. In this study, we have considered the velocity spread as a Gaussian distribution and in which the same velocity classes of electrons are grouped together. Each of these classes is described by the weight of the Gaussian distribution and the total number of macro electrons and every velocity class has the same initial transverse and longitudinal momentum. The initial phase of electrons within each velocity class is uniformly distributed over the interval 0 to 2π and also to avoid the overlapping between different velocity groups of electrons, we have divided the phase space for each group from 2nπ to 2(n +1) π.In Figs. 7 (a), 7 (b) and 7 (c) the oval mark shows the bunching point and after this point the power extraction from the beam is taking place. One can observe from this figure that for zero or no velocity spread, all the electrons lies in single velocity class, but with some spread. From Fig. 7 (b) it is clear that, there are three classes (based on velocity and energy) of electrons which are involved in the bunching process and similarly, the same phenomena for 10% velocity spread as shown in Fig. 7 (c) where five classes of electrons involved in the bunching mechanism.
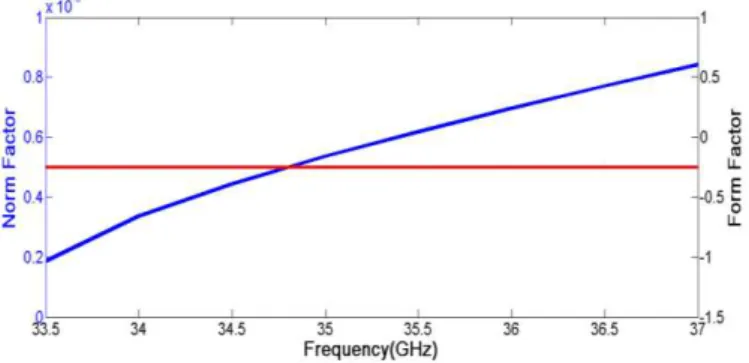
As discussed in section II, the form factor (Ls) refers the coupling between the cyclotron wave and
the resonant waveguide mode and depends on the transverse dimension of the waveguide and operating mode but not frequency dependent, as a result for all operating frequencies, the form factor will remain same as shown in Fig. 8. The norm factor (Ns) which describes the RF power propagating
through the interaction circuit per unit area, is dependent on both mode and frequency. This increases as the operating frequency increases, as can be seen from Fig. 8.
Fig. 8. Calculated norm and form factors of a Ka-band gyro-TWT amplifier.
IV. PIC SIMULATION
Brazilian Microwave and Optoelectronics Society-SBMO received 29 Apr 2013; for review 30 Apr 2013; accepted 14 Aug 2013
Brazilian Society of Electromagnetism-SBMag © 2013 SBMO/SBMag ISSN 2179-1074
circuit, firstly we have cold simulated (electron beam absent case) the circuit in ‘CST Microwave studio’ so as to ensure the device operation in the desired mode and frequency. Secondly, the electron beam present (hot) simulation has been performed using ‘CST Particle studio’ which is a particle-in-cell (PIC) code, taking the relevant design parameters as listed out in Table I. The interaction structure (cylindrical waveguide) has been modeled with an annealed oxygen free high conductivity (OFHC)
copper material (σ =5.8 x 10⁷
S/m) and its background has been set as normal (vacuum). Further, a port has been defined at the output end of the structure to observe the signal of any mode (desired as well as competing modes). Further, for the beam present simulation, electrons have been considered as uniformly distributed azimuthally in the form of gyrating beamlets and also their evolution along the axial direction of the interaction circuit in presence of electromagnetic signal has been observed in time domain. The boundary condition has been applied as the tangential component of the electric field to be zero, i.e., Et= 0. In order to facilitate the simulation process, the space charge effects on the
electron beam have been neglected. Electrons start to bunch as they drift along the interaction circuit and as a result, they transfer their energy to electric field which reverses its direction in each half cycle of the cyclotron frequency in synchronism with the Larmor gyration of the electrons. This makes possible amplification of an electromagnetic wave at the cyclotron frequency. The Fourier transform of time varying field confirmed the desired frequency of operation in hot beam analysis.
A. Electron Beam Absent (Cold) Simulation
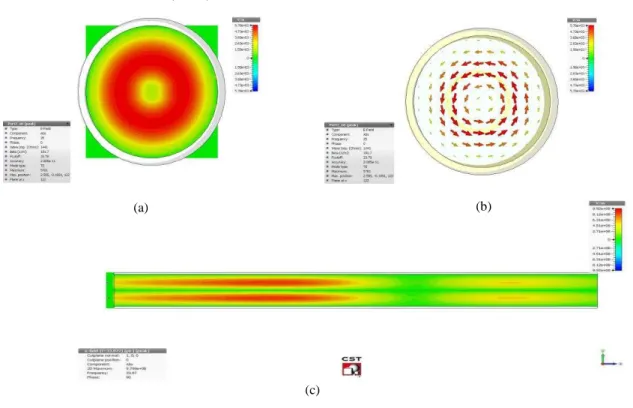
Fig. 9 (a) The contour plots of Electric field, (b) vector plot of Electric field pattern in transverse mid plane of the waveguide, and (c) side view of the contour of electric field intensity along the axial length of cylindrical waveguide.
In order to observe the desired mode of operation of the gyro-TWT amplifier, the Eigenmode solver of ‘CST Microwave studio’ has been chosen. Total interaction circuit length has been extended to
(b) (a)
Brazilian Microwave and Optoelectronics Society-SBMO received 29 Apr 2013; for review 30 Apr 2013; accepted 14 Aug 2013
Brazilian Society of Electromagnetism-SBMag © 2013 SBMO/SBMag ISSN 2179-1074
120 mm in the propagation direction. As a result of cold simulation, the field patterns at different planes of interest as well as EM fields profile along radial and axial positions have been observed. There is no provision in this software to display the specification of the modes, therefore, the existence of various TE and TM modes are being identified by examining their field distributions. This cold simulation confirms the desired mode (TE01) of operation at the desired operating frequency
as shown in Fig. 9. Figs. 9(a) and 9 (b) show the contour and vector plot of electric field intensity inside interaction circuit, respectively, at 35 GHz. Fig. 9 (c) shows the contour plot of electric field intensity along the length, in which maximum electric field is obtained in the straight circuit region. These plots exhibit TE01 mode of operation at the desired 35 GHz operating frequency.
B. Electron Beam Present Simulation (Hot) Simulation
Though there is no option for generating gyrating electron beam in the standard commercial code, we have developed an emitter in ‘CST particle studio’ [25]. The emitting face of the source is a tilted brick partially inserted on a cylindrical surface of outer radius almost equal to the above obtained beam radius. The design parameters for our particle emitter are basically determined from analytic trade-off equations which were developed by Baird and Lawson [26]. Once the parameters like beam power, beam radius (Rg), required cyclotron frequency and transverse to longitudinal velocity ratio (α)
are known the other particle source design parameters like tilt angle of the brick, size of the brick, Larmour radius at the emitter and the magnetic field (B0) are obtained from trade-off equations. In
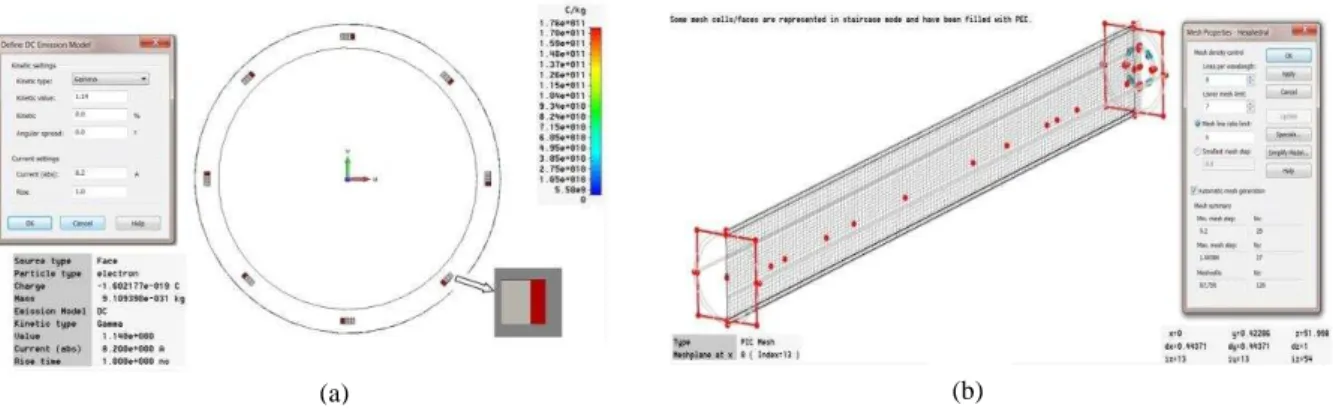
addition to these design equations, considering limitations of the cathode becomes mandatory, the most important among these is the number of beamlets required so as to fix the number of bricks. The designed emitter has been shown in Fig. 10 (a), where the red coloured region is its emitting face. Proper meshing should be made for the circuit discretization to obtain good results. Here, the hexahedral meshing has been considered and which is very robust and allows very fast computations with good accuracy. This has been shown in Fig. 10 (b).
Fig. 10. (a) Design of particle source with emitters (indicated by arrow) to produce the gyrating electron beamlets injected into the interaction circuit to drive EM wave and (b) meshing view of simulation structure with its properties.
For the study of beam-wave interaction mechanism, the gyrating electron beam has been introduced into the interaction circuit in order to drive the input electromagnetic wave which is to be amplified.
Brazilian Microwave and Optoelectronics Society-SBMO received 29 Apr 2013; for review 30 Apr 2013; accepted 14 Aug 2013
Brazilian Society of Electromagnetism-SBMag © 2013 SBMO/SBMag ISSN 2179-1074
Initially, all the particles have been assigned a constant energy value and the current rise time is taken as 1 ns. A kinetic spread can be directly introduced into the beam to realize the more reasonable scenario. For the accuracy of results, large number of particles can be considered. Further, field monitors have been setup to observe the waveguide operation in desired mode and frequency, and particles have also been monitored at a desired interval of time over the entire or part of simulation time for their momentum, position, etc. This stores the full particle data at the set location, which can be exported for subsequent simulations of the structure. For the analysis of electron bunch and energy transfer phenomena, phase space for momentum and position of electrons are being recorded as desired. The simulation time has been set as 200 ns and eight modes have been considered into account to show the mode competition Phenomena in a Ka-band gyro-TWT. The magnetic field is one of the crucial factors in the beam wave interaction. It determines the coupling strength of the beam wave interaction. An increase in magnetic field may enhance the output power at higher frequency but reduce the output power at the lower frequency due to the excessive saturation of the beam wave interaction. Furthermore, an increase in magnetic field will easily lead to instability of the gyro-TWT. The optimized magnetic field of 1.27 T has been kept constant throughout the interaction region. The axial velocity spread has been considered as 0% and also 8 beamlets have been taken for simulation due to time and hardware limitation. In order to improve the accuracy in PIC simulation one should choose the mess size wisely. Lines per wavelength and lower mess limit should be kept so as to get good accuracy in lesser simulation time. The automatic mess generation technique has been used in the present simulation and in which lines per wavelength is taken as 8 and lower mess limit as 7. This technique provides a minimum and maximum mess step size of 0.2 mm and 1.00584 mm, respectively, which correspond to total number of mess cell of 87,750.
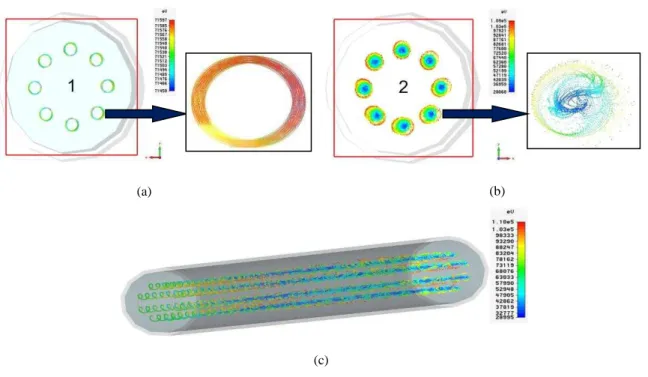
Fig. 11. Front view of electron beamlets (a) before interaction (b) after interaction (insets show a zoomed beam lets) and (c) side view of all the particles along the cavity after the interaction.
(b) (a)
Brazilian Microwave and Optoelectronics Society-SBMO received 29 Apr 2013; for review 30 Apr 2013; accepted 14 Aug 2013
Brazilian Society of Electromagnetism-SBMag © 2013 SBMO/SBMag ISSN 2179-1074
C. Electron Beam Bunching
The electrons interact self-consistently with the EM fields present in the interaction circuit. The EM field action is varying with respect to electron relativistic factor ( ), electron phase, and phase slippage and bunching corresponding to current driving the wave as discussed in section III. The snapshot of all the particles before and after the beam-wave interaction inside the waveguide has been shown in Figs. 11 (a) and 11 (b). Before interaction, all eight beamlets were uniformly distributed with a fixed guiding center radius and their energies were found equal at the starting of interaction process. The Fig. 11 (a) also shows that the Larmor radius of all beamlets were same. In Fig. 11 (b), bunching of particles can been clearly seen in the zoomed beamlet which is due to the change in the Larmour radius during the beam-wave interaction process. Fig. 11 (c) shows the trajectory of all particles along the interaction length. Obviously, the presence of EM fields perturb the homogeneity of helical electron beamlets in the waveguide section and results in the electron bunch formation. This bunch slips into the retarding phase of field, and hence transfers energy to EM field.
D. RF Output Signal and Power
The RF drive power coupled to the beam having the strength of 10 W and for which the developed RF output signal has been shown in Fig. 12 (a). It can be seen that initially, the signal corresponding to TE21 modestarted growing readily compared to TE01 mode, but finally after 70 ns, TE21 signal
decays and TE01 signalstarted growing.There is a hard competition between these two modes for the
magnetic field of 1.27 T and ultimately TE01 mode gets established in the waveguide. On the other
hand, TE01 mode stabilizes around 80 ns in the interaction circuit and then becomes stable. After the
template based post processing the output power for the designed parameter given in Table I has been calculated about ~ 135 kW. Obviously, the output time signal corresponding to TE01 mode has the
highest amplitude than all other modes and also the mode competition is observed mainly due to TE21
and TE31 modes at the chosen magnetic field for the present problem. The Fig. 12 (b) shows the
developed power with respect to time.
Fig. 12. (a) Temporal response of output signals for TE01 and its nearby competing modes and (b) Temporal output power
growth at output end of the interaction circuit for TE01 mode.
(b) (a) Ou tp u t Po w er ( k W)
Time period (ns) TE01 TE21 TE11 TE31 S ig n a l A mpl it u d e (V )
Brazilian Microwave and Optoelectronics Society-SBMO received 29 Apr 2013; for review 30 Apr 2013; accepted 14 Aug 2013
Brazilian Society of Electromagnetism-SBMag © 2013 SBMO/SBMag ISSN 2179-1074
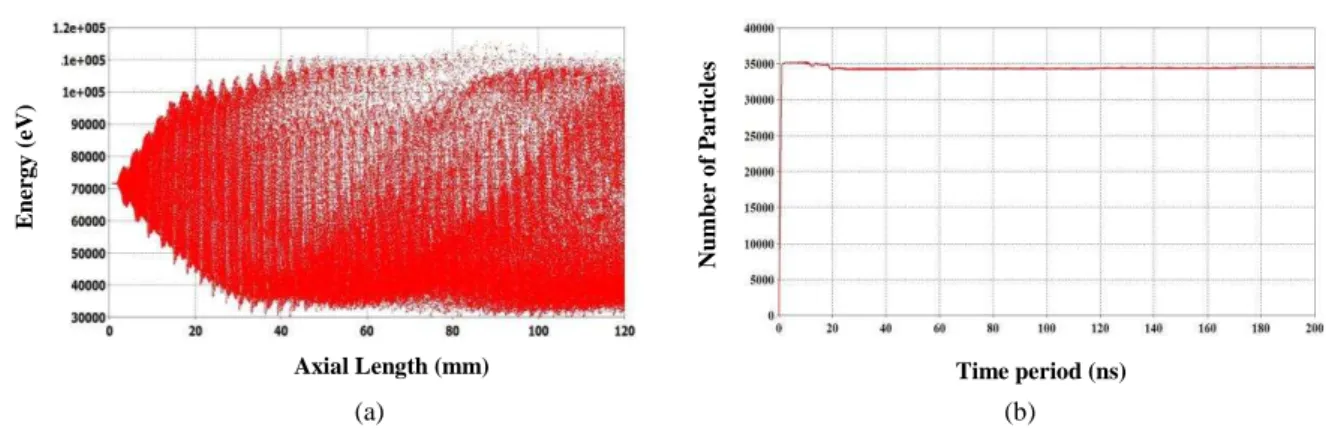
The energy distribution of all electrons has been shown in Fig. 13 (a) for 0% percent of velocity spread and which shows that initially all electrons have same energy of 72keV and as time progresses, energy of all particles gets perturbed due to the interaction with RF wave present in the interaction circuit. At the end of interaction circuit majority of particles have lower energy and which represents that particles have lost their energy to RF wave as they come out of interaction circuit and hence the net energy transfer from electrons to the wave taken place. This variation in energy distribution leads to low efficiency and hence the output power. The total no of electrons coming out from the cathode in the whole simulation period is about 35,000 which have been shown in Fig. 13 (b).
Fig.13. (a) Energy distribution of the electrons after the beam-wave interaction along the interaction circuit and (b) number of particles emitted in the present simualtion.
A probe is placed inside the interaction circuit where the maximum electric field ocuurs and its signal is recorded in time domain. The Fig. 14 (a) shows the frequency spectrum of azimuthal TE01
electric field which is obtained from the Fourier transform of the electric field. Obviously, it is characterized by a single-frequency peaked at 35 GHz and this validates the frequency of TE01 mode
of operation of the gyro- TWT amplifier. The Fig. 14 (b) shows obtained saturated power for various input drive frequency from PIC simulation and which has been found that in close agreement with the non- linear analysis results. The 3dB bandwidth has been found as 6% for 35 GHz operating frequency.
Fig. 14. (a) frequency spectrum of probe signal and (b) comparison of analysis and simulation results. (b)
(a)
Time period (ns)
N u mber o f P a rt ic le s E n er g y ( eV )
Axial Length (mm)
Brazilian Microwave and Optoelectronics Society-SBMO received 29 Apr 2013; for review 30 Apr 2013; accepted 14 Aug 2013
Brazilian Society of Electromagnetism-SBMag © 2013 SBMO/SBMag ISSN 2179-1074
V. CONCLUSIONS
A gyro-TWT amplifier using a smooth wall cylindrical waveguide is analyzed for TE01 mode of
operation with the help of a self-consistent nonlinear theory and also simulated using a 3-D electromagnetic PIC code in order to validate the analytical findings. A saturated peak power of ~ 134 kW with an efficiency of ~ 22.7 % and a saturated gain of ~ 41.3 dB have been analytically predicted for the gyro-TWT using 72 kV, 8.2 A electron beam of 1.05 pitch factor. The critical interaction length has been found as 10.7 cm for the stable amplifier operation. Gyro-TWT form factor and norm factor have also been computed. ‘CST 3-D particle studio’ code has been used to simulate the beam wave interaction behaviour. A well defined TE01 mode was observed inside the
intraction waveguide at the cut-off of 33.78 GHz. Gyro-TWT amplifier saturated RF output power has been obtained as ~ 135 kW at 35 GHz. The gain of the device is found as ~ 41.3 dB with an efficiency of ~ 23 %. The PIC simulation values have also been compared with the analytical results obtained by self-consistent single-mode nonlinear analysis and found that the results were in close agreement with 1% deviation.
Further, the analysis and simulation of the amplifier have been repeated for 5 % velocity spread and the analysis predicts that the output power of ~ 128 kW with a power conversion efficiency of ~ 21.7 % and the saturated gain of ~ 41.07 dB. The simulation predicts that the saturated output power of ~ 130 kW for the same beam input parameters and this has also been found to be close agreement with the non-linear results.
REFERENCES
[1] K. R. Chu, “The electron cyclotron maser,” Review of Modern Physics, vol. 76, no. 2, pp. 489-540, Apr. 2004.
[2] G. S. Nusinovich, “Non-Linear Theory of the gyro-TWT,” in Introduction to the physics of gyrotrons, Baltimore and London: John Hopkins University Press, 2004.
[3] Chao-Hai Du and Pu-Kun Liu, “Nonlinear full-wave-interaction analysis of a gyrotron-traveling-wave-tube amplifier based on a lossy dielectric-lined circuit,” phys. of plasmas, vol. 17, 033104, 2010.
[4] Oleksandr V. Sinitsyn, Gregory S. Nusinovich, Khanh T. Nguyen, and Victor L. Granatstein, “Nonlinear Theory of the gyro-TWT: Comparison of Analytical Method and Numerical Code Data for the NRL gyro-TWT”, IEEE Transactions on Plasma Science, vol. 30, no. 3, Jun. 2002.
[5] P. Sprangle and A. T. Drobot, “The linear and self-consistent nonlinear theory of the electron cyclotron maser instability,” IEEE Trans. Microwave Theory Tech., vol. MTT-25, pp. 528–544, June 1977.
[6] K. R. Chu, A. T. Drobot, V. L. Granatstein, and J. L. Seftor, “Characteristics and optimum operating parameters of a gyrotron traveling-wave amplifier,” IEEE Trans. Microwave Theory Tech., vol. MTT-27, pp. 178–187, Feb. 1979. [7] K. R. Chu, A. T. Drobot, H. H. Szu, and P. Sprangle, “Theory and simulation of the gyrotron traveling wave amplifier
operating at cyclotron harmonics,” IEEE Trans. Microwave Theory Tech., vol. MTT-28, pp. 313–317, Apr. 1980. [8] N. S. Ginzburg, I. G. Zarnitsyna, and G. S. Nusinovich, “Theory of relativistic CRM amplifiers,” Radiophys. Quantum
Electron., vol. 24, pp. 331–338, 1981.
[9] V. L. Bratman, N. S. Ginzburg, G. S. Nusinovich, M. I. Petelin, and P. S. Strelkov, “Relativistic gyrotrons and cyclotron autoresonance masers,” Int. J. Electron., vol. 51, pp. 541–568, 1981.
[10]A. W. Fliflet, “Linear and nonlinear theory of the Doppler-shifted cyclotron resonance maser based on TE and TM waveguide modes,” Int. J. Electron., vol. 61, pp. 1049–1080, 1986.
[11]J. L. Seftor, V. L. Granatstein, K. R. Chu. “The electron cyclotron cyclotron maser as a high power traveling-wave amplifier of millimeter waves,” IEEE J. Quantum Electron, vol. 15, no. 2, pp. 848–853, 1979.
[12]L. R. Barnett, J. M. Baird, Y. Y. Lau, et al. “A high gain single stage gyrotron traveling wave amplifier,” IEDM Tech. Dig., vol. 1, no. 2, pp. 314–317, 1980.
[13]R. S. Symons, H. R. Jory, J. Hegji, and P. E. Ferguson, “An experimental Gyro-TWT,” IEEE Trans. Microwave Theory Tech. vol. MTT-29, pp. 181–184, 1981.
[14]Patrick E. Fergusion, Gerald Valier, and Robert S. Symons. “Gyrotron-TWT Operating Characteristics,” IEEE. Trans. Microwave Theory Tech. vol. MTT-29 no. 8, pp.794–799 , 1981.
Brazilian Microwave and Optoelectronics Society-SBMO received 29 Apr 2013; for review 30 Apr 2013; accepted 14 Aug 2013
Brazilian Society of Electromagnetism-SBMag © 2013 SBMO/SBMag ISSN 2179-1074
[16]K. R. Chu, L. R. Barnett, W. K. Lau, et al. “Recent development in millimeter wave gyro-TWT research at NTHU,” IEDM Tech. Dig., vol. 1, no. 1, pp. 699–702, 1990.
[17]K. R. Chu, L. R. Barnett, H. Y. Chen, S. H. Chen, C. Wang, Y. S. Yeh, Y. C. Tsai, T. T. Yang, and T. Y. Dawn, “Stabilization of absolute instabilities in the gyrotron traveling wave amplifier,” Phys. Rev. Lett., vol. 74, pp. 1103– 1106, 1995.
[18]K. R. Chu, H. Y. Chen, C. L. Hung, et al. “Theory and experiment of ultrahigh gain gyrotron travelingwave amplifier,” IEEE Trans. Plasma. Sci., vol. 27, no. 2, 391–404, 1999.
[19]K. T. Nguyen, J. P. Calame, D. E. Pershing, B. G. Danly, M. Garven, B. Levush, and T. M. Antonsen, “Design of Ka -band gyro-TWT for radar applications,” IEEE Trans. Plasma. Sci., vol. 48, pp. 108–115, Jan.2001
[20]M. Garven, J. P. Calame, B. G. Danly, K. T. Nguyen, B. Levush, F. N. Wood, and D. E. Pershing, “Experimental studies of a gyro-TWT amplifier with a lossy ceramic interaction region,” IEEE Trans. Plasma Sci., vol. 30, pp. 885– 893, 2002.
[21]K. T. Nguyen, J. P. Calame, D. E. Pershing, B. G. Danly, M. Garven,B. Levush, and T.M. Antonsen Jr., “Design of a Ka-band gyro-TWT for radar applications,” IEEE Trans. Electron Devices, vol. 48, pp. 108–115, Jan. 2001.
[22]Reddy, S. U. M., V. B. Naidu, S. K. Datta, P. K. Jain, and L. Kumar, “PIC simulation of a gyrotron-traveling-wave tube amplifier,” IEEE Int. Conf. (IVEC), pp. 319-320, 2010.
[23]Shou-Xi Xu, Pu-Kun Liu, Shi-Chang Zhang, Chao-Hai Du, Qian-Zhong Xue, Zhi-Hui Geng, and Yi-Nong Su, “Particle simulation of a ka-band gyrotron traveling wave amplifier,” phys. of plasmas, vol. 18, 083501, 2011.
[24]J. R. Sirigiri, “Theory and Design Study of a Novel Quasi-Optical gyrotron Traveling Wave Amplifier,” M.S Thesis, Dept. of Electr. Engg. and Comp. Sci., MIT, USA, 1999.
[25]CST-Particle Studio, User's Manual, Darmstadt, Germany, 2012.