Abstract
Experiments and modeling aimed at assessing the mechanical response of latex balloons in the inflation test are presented. To this end, the hyperelastic Yeoh material model is firstly character-ized via tensile test and, then, used to numerically simulate via finite elements the stress-strain evolution during the inflation test. The numerical pressure-displacement curves are validated with those obtained experimentally. Moreover, this analysis is extended to a biomedical problem of an eyeball under glaucoma conditions.
Keywords
Inflation test of latex balloons, numerical simulation, experimental verification/validation.
Numerical Simulation and Experimental Validation
of the Inflation Test of Latex Balloons
1 INTRODUCTION
Hyperelastic materials are widely used in engineering applications from seismic absorber devices (Chiba and Furukawa, 2010) to aortic valve prosthesis or stents (Saab, 1999). Therefore, much ef-fort has gone into describing the behavior of materials like silicone, latex, rubber (Treloar, 1974;
Claudio Bustos a Claudio García Herrera b Diego Celentano c Daming Chen a Marcela Cruchaga a
a Departamento de Ingeniería Mecánica, Universidad de Santiago de Chile USACH, Av. Bdo. O’Higgins 3363, Santiago, Chile
b Facultad de Ingeniería y Ciencias, Universidad Adolfo Ibáñez UAI, Diago-nal Las Torres 2640, Santiago, Chile [email protected]
c Departamento de Ingeniería Mecánica y Metalúrgica, Pontificia Universidad Católica de Chile PUC, Av. Vicuña Mackenna 4860, Santiago, Chile
http://dx.doi.org/10.1590/1679-78252622
Arruda and Boyce, 1993; Meunier et al., 2008), or biological tissues (García–Herrera et al., 2011 and 2012); Eilaghi et al., 1984) with the aim of quantifying their ability to undergo very large defor-mations that can be recovered when the specimen is downloaded without loss of its original abilities (Ogden, 1984).
Several analytical models have been proposed in the literature to describe the deformation ener-gy function (e.g., see Ogden, 1984). Ogden, Mooney-Rivlin, Yeoh, Neo-Hookean, or Demiray are the most extensively used models to describe hyperelastic materials. A relevant aspect for dealing with practical applications is to determine the related material constants that realistically describe a specific material's behavior (Ogden et al., 2004). Moreover, to be able to evaluate real situations, numerical modeling is a standard analytical tool. Nowadays, numerical developments to properly deal with very large deformation and the appropriate mechanical characterization of the materials are crucial to get trustworthy predictions. To this end, the simulations also need to be contrasted with experiments. In addition, to analyze the pressurization of hyperelastic membranes, dynamic models have emerged especiallyin applications with rapid loading in thermoforming processes (Ver-ron et al., 2001).
Tensile, compression, shear or inflation tests (Treloar, 1974) are reported in the literature to characterize mechanically the material's behavior, trying to have the best description with a limited number of constants taken from a unique experimental test (Arruda and Boyce, 1993). As an ex-ample, silicone behavior is obtained from tensile, compression, shear and inflation test in Meunier et al. (2008) using image correlation techniques while Skouras et al (2012) reports on a characteriza-tion using the Hart–Smith model via the inflacharacteriza-tion test. Rubber-like materials are analyzed by Gon-záles et al. (2009) by fitting the Mooney–Rivlin model with experimental biaxial tests. Uniaxial and biaxial traction tests are presented by Sasso et al. (2008) to characterize polymers including a finite element (FEM) analysis. The Ogden model is applied in Canseco et al. (2011) to describe the be-havior during compression under the ASTM D 3574 standard of a commercial material named Poron. Mechanical characterization of arteries has been reported by García–Herrera et al. (2011 and 2012), where tensile tests and inflation tests are described. The descending human aorta is studied by García–Herrera et al. (2011) using the Holzapfel model, while the Demiray model is used to characterize the behavior of a patient-specific human aortic arch in García et al. (2012).
glaucoma conditions is presented. The obtained results are compared with those reported in the literature.
The rest of the work is organized as follows: the governing equations are presented in Section 2; the mechanical characterization is described in Section 3; Section 4 reports the inflation of a balloon test including the experimental procedure, measurements and modeling results; Section 5 presents the analysis of an eyeball under glaucoma conditions. Finally, the concluding remarks are summa-rized.
2 FUNDAMENTAL EQUATIONS
2.1 Governing Equations
In a general context of the mechanics of a continuous medium, the governing equations that model the situation are the continuity and equilibrium equations expressed as:
ρ ρ (1)
∙ (2)
where ρ is the density of the material in the initial configuration, ρis the density in the spatial
configuration, and det is the volume relation between the deformed and the initial
configura-tion where is the deformation gradient tensor (x and X being the spatial and material
coor-dinates, respectively) and is the displacement vector. The Cauchy stress tensor can be
ex-pressed by means of a specific deformation energy function as (Holzapfel, 2000):
∂
∂ (3)
where is the right Cauchy–Green tensor. In this work, material incompressibility is
as-sumed (i.e., J=1).
2.2 Constitutive Equations
Hyperelastic isotropic materials are characterized by the deformation energy density function
ex-pressed as a function of C, e.g., Ogden (1984) and Gonzáles et al. (2009), or the invariants of the
deformation tensor, e.g., Neo-Hooke in Holzapfel (2000); Mooney–Rivlin or Yeoh models in Rackl (2015) and Demiray in Holzapfel (2000).The Yeoh model is given by:
(4)
where I1 is the trace of C, and C10, C20 and C30 are constants of the material to be determined by
some fitting method.
Principal Cauchy stress determination for uniaxial tensile samples
The expression of the principal Cauchy stress σ as a function of the constants of the models and
σ , , (5)
The incompressibility and isotropic behavior for the case of simple uniaxial traction is given by the following relation:
(6)
where sub-indexes 1, 2 and 3 respectively refers to stretchings along the axial, width and thickness directions of the sample.
The principal Cauchy stress computed from Equation (5) including the incompressibility con-straint (6) is written as:
(7)
Substituting Equation (4) into (7), the analytical expression for the uniaxial Cauchy stress can be determined:
σ 6 9 (8)
Internal pressure determination for thin-walled hollow spheres
The stress in a thin-walled hollow sphere (i.e., , where is the wall thickness and is the
radius, both in the initial configuration) subjected to a constant inner pressure can be determined considering the unique relationship between circumferential and longitudinal stretching, i.e.,
, and the material's incompressibility. Thus:
(9)
(10)
The analytical expression for the internal pressure considering the deformation energy given by Equation (4) is:
(11)
3 MECHANICAL CHARACTERIZATION
3.1 Tensile Test
The samples tested in the present work, obtained as shown in Figure 1 from two different prin-cipal directions of the sample, have the following dimensions: length 6.3 mm and width 2.29 mm. The thickness in the balloon was found to be variable. In this work, a thickness profile was meas-ured with a micrometer. The average values obtained along the balloon length around 10 mm apart
starting from the pole were 0.184 0.005, 0.143 0.011, 0.132 0.008 and 0.115 0.009 mm.
Figure 1: Uniaxial tensile test: circumferential and longitudinal specimens.
The tensile tests were carried out on a universal testing machine Instron 3342 equipped with a 500 N loading cell at a controlled cross-head displacement speed of 5 mm/min and a constant test-ing temperature of 25 ºC; see Figure 2.
Figure 2: Tensile test layout.
The curves obtained for the longitudinal and circumferential samples are presented in Figures 3
a) and b), respectively, where the horizontal axis describes the axial stretch λ and the vertical axis
indicates the axial Cauchy stress σ (samples were tested for each direction). These plots are
com-puted from the instantaneous axial load P – displacement (measured between clamps) curves
registered during the tensile tests. The Cauchy stress is σ=P/A, A being the instantaneous
trans-versal area of the specimen analytically obtained under the material incompressibility assumptionas
Lf =L0+u. Considering that λ=Lf/L0, the stress-stretch relationship is σ=P/A0λ. The results pre-sented in Figure 3 show that in some samples the curve has discontinuous stretching zones
(approx-imately at 8.0) because during the test some samples undergo partial breakage. In spite of the
above, it is seen that for both directions of the tested samples all the tests present the same nonlin-ear behavioral trend which is characteristic of hyperelastic materials.
3.2 Determination of Material Parameters
The difference between the curves depicted in Figures 3 a) and 3 b) for the longitudinal and circum-ferential samples is less than 10%, thereby the response of the tested material could be considered as isotropic, i.e., the mechanical behavior does not depend on the orientation of the material. The material constants are obtained by fitting by least squares the average value of the experimental curves reported in Figures 3 with the analytical stress defined by Equation (8). The expression used is:
σ σ (12)
where σ and are the experimental axial stress and elongation values, respectively, and n is
the number of experimental measurements. From Equation (12), we get the material constants by minimizing . Table 1 summarizes the resulting parameters.
a) b)
Figure 3: Uniaxial tensile test results for a) longitudinal and b) circumferential specimens.
Yeoh model (MPa) (MPa) (MPa)
0.185164 -0.002785 0.000038
Table 1: Material parameters obtained by curve fitting from experimental data. 0 20 40 60 80 100 120
1,00 4,00 7,00 10,00 13,00
Cauchy
stress, MPa
Stretch λ
0 20 40 60 80 100 120
1,00 4,00 7,00 10,00 13,00
Cauchy
str
ess,
M
Pa
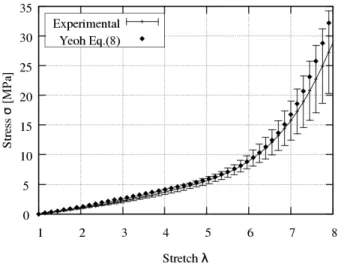
To verify the behavior of the model with the obtained constants, the analytical and measured uniaxial stresses are compared in Figure 4 where it is seen that the Yeoh model presents a satisfac-tory fit with the experimental behavior for the studied material.
Figure 4: Experimental data fit with the Yeoh model (R2=0.896).
4 INFLATION TEST
4.1 Experimental Design
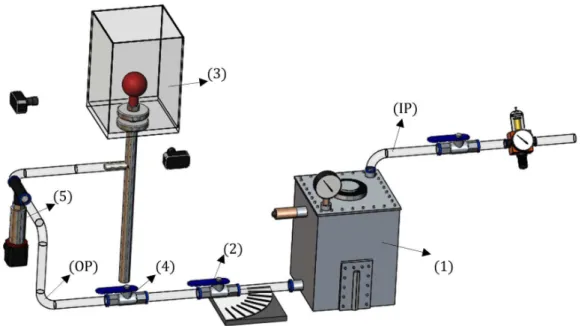
The pressurization test is performed by injecting air into a latex balloon. The test circuit is illus-trated in Figure 5. The objective of this test is to determine the state of the deformations present in the balloon wall during its inflation. The injected mass is at a temperature of 25 ± 0.3 °C controlled with a Proportional Integral and Derivative (PID) device. The pressure is measured by the UNIK 5000 commercial sensor (by Gemeasurement), whose range of operation is from 0 to 0.5 bar with an error of ± 0.2%. The pressure data are captured with a USB acquisition 1608FS card (by MC Measurement Computing).
The procedure for running the test is: first, the tank (1) is pressurized with compressed air at 0.3 bar (inlet pipe, IP), the mass flow of air to be injected into the balloon is adjusted by means of the graduated valve (2), the air is injected into the balloon located in the test chamber (3) by open-ing a control valve (4) in the outlet pipe (OP), and the pressure inside the balloon is recorded by the pressure sensor (5) installed in the same outlet pipe.
Figure 5: Pressurized test setup: (1) tank, (2) graduated valve, (3) test chamber, (4) control valve, (5) pressure sensor, inletpipe(IP) and outlet pipe (OP).
4.2 Experimental Results
Figure 6 shows a sequence of pictures as the balloon is inflated which allows us to obtain the evolu-tion of its profile. The dot indicates the center of the ellipse fitted with which the displacement evolutions at the polar and equatorial zones were measured. These displacements were measured with respect to the reference configuration adopted here as that with an inner pressure of 8.3 mbar (see Figure 6) in order to prevent geometric instabilities caused by the self weight of the balloon
(the major and minor semi axis in this configuration are a=15.66 mm and b=6.95 mm). As the
inflation process proceeds, the balloon tends to a spherical shape.
The pressurization test gives curves of the inner pressure versus the displacements at the po-lar dpole and equatorial dequa zones plotted in Figure 7, where 8 samples were tested (the bars denote the standard deviation). As already commented, these curves are measured with respect to the adopted reference configuration. The experimental curves exhibit a behavior similar to that report-ed by Verron et al. (2001) and Verron and Marckmann (2003), where it is seen that after reaching a maximum pressure, it decreases as the displacements continue increasing. It should be noted that non-uniform strains are developed in the balloon during both the load and unload stages. For in-stance, for the maximum pressure average value of 70 mbar, the polar and equatorial displacements are 4.27 and 3.66 mm, respectively. The unstable character of the problem is reflected in the very different time intervals associated with the load and unload stages respectively observed in the ex-periments as 130 s and 2 s.
Figure 7: Inflation pressure – displacement curves in the pressurization test.
On the other hand, the experiments have shown that during the inflation of the balloon the ma-terial is concentrated in its polar zone, see Figure 8. Voorhies (2003) reported that such a zone pre-sents the lower risk to develop high stress when the internal pressure increases.
4.3 Modeling the Experiments
As mentioned above, a reference configuration with a small pressure level was chosen to analyze the whole inflation process (see Figure 6). To this end, the estimations of both the initial stress and strain fields together with the thickness profile associated with this configuration must be per-formed. These estimations are computed in two steps. First, the approach to obtaining a compatible initial stress and strain fields is iteratively tackled by solving the equilibrium equations in the refer-ence configuration (with an internal pressure of 8.3 mbar as indicated in Figure 6) together with the characterized Yeoh model presented above using the finite element method until the condition of a nearly zero displacement field for the whole balloon is fulfilled (García-Herrera and Celentano, 2013). Second, from this simulation, the thickness profile in the reference configuration is computed by completely removing the pressure to check that the thickness distribution at the end of the de-flating process corresponds to the measured values reported in Section 3.1. The resulting thickness values applying this procedure obtained along the balloon length around 10 mm apart starting from the pole are: 0.183, 0.136, 0.125 and 0.114 mm. As expected, note that these values are slightly smaller than those listed in Section 3.1.
The study of the inflation process was carried out via two different approaches, analytical and numerical, separately described below.
The analytical results were obtained from the thin-walled hollow sphere case (using Equation (11)) considering a simplified geometry given by an average reference radius of 11.31 mm (assumed as R=(a+b)/2 with a and b being, as mentioned above, the major and minor axis of the reference configuration) and a uniform thickness of 0.140 mm (obtained as the average of the thickness pro-files in the reference configuration). The analytical curve shown in Figure 7 qualitatively reproduces the material response during both the load and unload stages. The results in the load stage closely approach the measurements. However, from the maximum pressure onwards, the pressure values are clearly and progressively underestimated.
The numerical analysis is performed in order to more properly take into account the real geom-etry of the balloon (i.e., ellipsoidal shape with a variable thickness distribution). In the present study, an axisymmetric uniform mesh composed of 12048 four-node elements is considered for the reference configuration (with a height of 45.6 mm), where the thickness is discretized with 8 ele-ments. The element size was determined by a standard mesh convergence analysis (not shown) per-formed until accurate results with a reduced computation time are obtained. The displacements are fully constrained at the bottom of the balloon while the horizontal displacement is restricted at the top to reproduce symmetry conditions. Figure 9 illustrates the numerical strategy adopted in the present simulation to impose the boundary conditions. First, as shown in Figure 9a, an internal pressure is incrementally imposed on the inner wall of the balloon up to a maximum value of 70 mbar according to the experimental records (note that the air hydrostatic pressure is negligible in this case). Then, in order to circumvent the instability appearing at the instant of maximum pres-sure that in turn causes numerical convergence problems due to the loss of convexity of the energy
function W, the displacement field measured in the experiments is imposed on the curved domain
process. Figures 9b to 9d schematically represent the different displacement boundary conditions during the unload stage. Using this procedure, the numerical internal pressure – displacement curves considering the characterized Yeoh model are depicted in Figure 7. The simulation satisfac-torily matches the experiments during the load stage both in pressure and polar and equatorial displacements. In particular, the maximum pressure value is adequately captured. For displace-ments larger than those corresponding to the maximum pressure, the pressure, obtained as the normal component of the stress tensor at the inner surface of the balloon, exhibits a decreasing trend that agrees with that of the measurements. The predicted slopes of the unload stage are, however, steeper than those of the experimental curves. The excessive deformation that takes place afterwards (particularly in the equatorial zone as shown below) is presumably the cause that hin-ders the achievement of a converged numerical solution for larger levels of imposed displacement. Although the present numerical analysis is not able to describe the full inflating sequence, it allows, in contrast to the analytical approach, the prediction of non-uniform stress and thickness profiles during the deformation process. These results are shown below.
Figure 9: Boundary conditions for the FEM simulation.
although the pressure decreases at the end of the test, the stresses always increase thus denoting the geometrical character of the instability.
a)
b)
Figure 10: a) Circumferential stress – equatorial displacement and b) circumferential stress – inflation pressure computed curves in different zones of the balloon.
addi-tion, the equatorial zone (zone 3) exhibits the larger thickness reduction. This fact is consistent with the stress localization commented above. Note that the final thickness ratio in this zone (0.38) is clearly lower than that corresponding to the thin-walled hollow sphere case, i.e., 0.48.
Figure 11: Thickness ratio – inflation pressure computed curve in different zones of the balloon.
5 APPLICATION TO A BIOMECHANICAL ANALYSIS OF HUMAN EYE TISSUES
Once the model and the analytical methodology proposed for the inflation test study had been de-veloped and verified experimentally, the problem of the eyeball subjected to inner pressure was analyzed. Due to the harmful effect of the high intraocular pressure that occurs in the disease called glaucoma (Ruiz – Ederra et al., 2005; Norman et al., 2010), different experimental (e.g., Schultz et al., 2008; Elsheikh et al., 2010; Elsheikh et al., 2008) as well as numerical (e.g., Belleza et al., 2000; Lari et al., 2012; Asejczyk et al., 2011) studies have been proposed to determine the mechanical characteristics of the sclera (Eilaghi et al., 2010; Elsheikh et al., 2010; Schultz et al., 2008) and the cornea (e.g., Elsheikh et al., 2008) and, in addition, to establish the state of the stress on the walls of the eyeballs subjected to an internal pressure (Belleza et al., 2000).
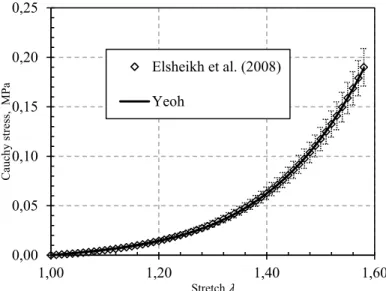
Figure 12: Experimental results of data fitting with the Yeoh model for the human sclera.
Figure 13: Experimental results of data fitting with the Yeoh model for the human cornea.
Model Parameters
Yeoh Sclera 0.1217 0.0058 0.0476 Yeoh Cornea 0.0084 0.0149 0.0112
Table 2: Material parameters obtained by curve fitting of experimental data. 0,0
2,0 4,0 6,0 8,0 10,0 12,0 14,0
1,00 1,20 1,40 1,60 1,80 2,00 2,20 2,40
Cauchy
str
ess,
M
Pa
Stretch λ
Elsheikh et al. (2010) Yeoh
0,00 0,05 0,10 0,15 0,20 0,25
1,00 1,20 1,40 1,60
Cauchy
str
ess,
M
Pa
Stretch λ
Elsheikh et al. (2008)
Figure 14: 2D geometry of the human eye for FEM simulation (the boxed numbers indicates the zones of interest in this study).
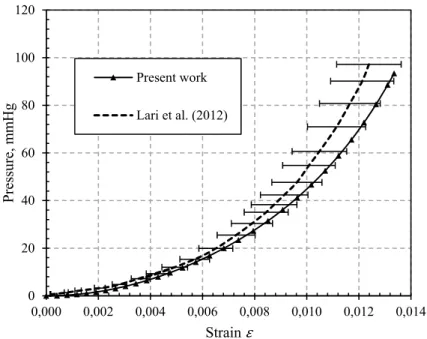
Figure 15 shows the plot of the computed pressure - strain curve, with the strain , where
D and D are the initial and instantaneous diameters of the eyeball at the sclera near the optic
nerve zone, respectively. As a qualitative confirmation of the predictions, the experimental data reported by Lari et al.(2012) during the inflation test of pig eyes is also plotted.
Figure 15: Pressure - strain curve near the optic nerve. 0
20 40 60 80 100 120
0,000 0,002 0,004 0,006 0,008 0,010 0,012 0,014
Pressure,
m
m
H
g
Strain ε Present work
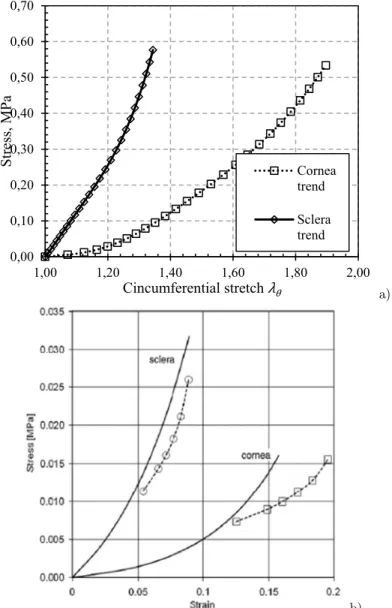
The stress-strain computed curves are shown in Figure 16a together with the results reported by Lari et al. (2012) for comparison in Figure 16b. Similar trends can be appreciated where in
Fig-ure 16a it is seen that the sclera presents a lower degree of deformation (λ 1.34) with respect to
the cornea (λ 1.9) under the same stress load, so it is inferred that the sclera shows a more rigid
behavior than the cornea.
a)
b)
Figure 16: a) Stress - stretch curve for human sclera and cornea (average values from the present computation) and b) stress - strain curve for pig sclera and cornea taken from Lari et al. (2012).
The circumferential stress-stretch and the circumferential stress-pressure curves for the sclera at zones 1,2,3,4 and 5 are plotted in Figures 17a and 17b, respectively. Similar results are plotted in Figures 18a and 18b for the cornea. From Figure 17, different stress distributions can be seen in different zones of the sclera. This is attributable to the different initial wall thickness, which
in-0,00 0,10 0,20 0,30 0,40 0,50 0,60 0,70
1,00 1,20 1,40 1,60 1,80 2,00
Stress,
M
Pa
Cincumferential stretch λθ
Cornea trend
creases from 0.52 mm (in zone 1) to 1.6 mm (near the optic nerve). The maximum stress value is obtained at the equatorial zone, reaching approximately 0.66 MPa. Figure 18 reports that the stresses in different zones in the cornea (see Figure 14) are very similar to one another because no thickness changes take place.
a)
b)
Figure 17: a) Stress - circumferential stretchand b) stress – pressurecomputed curves in different zones of the sclera.
The thickness evolution for the cornea is presented in Figure 19, showing similar trends between different zones varying from the initial value of 0.52 mm to 0.23 mm. From these results the equa-torial zone has a high risk of rupture, as it was also seen in the experimental work reported by Voorhies(2003), where from the pressurization test results, 80% of eye rupture has occurred in the equatorial plane. 0,00 0,10 0,20 0,30 0,40 0,50 0,60 0,70
1,00 1,10 1,20 1,30 1,40 1,50 1,60
Stress,
M
Pa
Cincumferential stretch λϴ
Zone 1 Zone 2 Zone 3 Zone 4 Zone 5 0,00 0,10 0,20 0,30 0,40 0,50 0,60 0,70
0,0 30,0 60,0 90,0 120,0 150,0
Finally, Figure 20 depicts the thickness evolution with pressure. The thickness decreases con-tinuously, with the rate of reduction greater at the beginning, and this was also reported by Elsheikh et al. (2010). At high pressure levels the thickness decreases slowly, reaching a constant value of 0.52 mm near the optic nerve (zone 5 in Figure 14). This value is closer to that reported by Bisplinghoff et al. (2009) for a pressurization test of human sclera up to rupture, registering a final thickness of 0.58 + 0.13 mm.
a)
b) Figure 18: a) Stress - circumferential stretch and b) stress – pressure
computed curves in different zones of the cornea. 0,00
0,10 0,20 0,30 0,40 0,50 0,60
1,00 1,20 1,40 1,60 1,80 2,00
Stress, MPa
Cincumferential stretch λϴ
Zone 1
Zone 2
Zone 3
0,00 0,10 0,20 0,30 0,40 0,50 0,60
0,0 30,0 60,0 90,0 120,0 150,0
Stress, MPa
Pressure, mmHg
Zone 1
Zone 2
Figure 19: Thickness – pressure curves in different zones of the cornea.
Figure 20: Thickness – pressure curves in different zones of the sclera.
6 CONCLUSIONS
An experimental and numerical study of a latex balloon pressurization test is presented. To this end, a material characterization was firstly conducted using the hyperelastic Yeoh model. Then, the modeling of this problem was tackled via two different approaches: analytical and numerical. The
0,000 0,100 0,200 0,300 0,400 0,500 0,600
0,0 30,0 60,0 90,0 120,0 150,0
Thi
ckness,
m
m
Pressure, mmHg
Zone 1
Zone 2
Zone 3
0,300 0,350 0,400 0,450 0,500 0,550 0,600 0,650 0,700
0,0 30,0 60,0 90,0 120,0 150,0
Thi
ckness,
m
m
Pressure, mmHg
analytical solution considering a simplified geometry was found to reasonably describe the pressure – displacement curves. On the other hand, the real geometry of the balloon (i.e., ellipsoidal shape with a variable thickness distribution) was taken into account by means of a finite element model proposed to analyze this problem. Although the present numerical analysis has shown a limited performance due to the instability that occurs at the instant of maximum pressure that in turn precludes the analysis of the full inflation sequence, it satisfactorily predicted, in contrast to the analytical approach, the following relevant aspects of the problem: the wall stresses are not uniform, the geometry does not evolve spherically, the equatorial zone presents higher deformations, and the polar zone exhibits material concentration during the pressurization process.
This experiment served as a reference for analyzing the pressurization test in human eyes. The developed methodology was applied to predict the mechanical behavior of a human eyeball subject-ed to internal pressure, mimicking glaucoma diseases. The study of the eyeball was performsubject-ed using properties and geometry taken from the literature. The best fit of the material behavior was ob-tained using the Yeoh model in both materials analyzed. The results obob-tained in the present work for such a test agree well with the experimental data reported in the references, confirming that agreater stress is developed in the equatorial region where sclera rupture occurs.
Acknowledgements
The authors thank the support given to the research project by Chilean Council for Scientific and Technological Research (CONICYT-FONDECYT Project 1130278).
References
Arruda, E. M., Boyce, M. C. (1993). A Three-dimensional constitutive model for the large stretch behavior of rubber elastic materials. Journal Mechanical Physics Solids 41:389-412.
Asejczyk - Widlicka, M., rōdka, W., Schachar, R. A., Pier cionek, B. K. (2011). Material properties of the cornea and sclera: A modelling approach to test experimental analysis. Journal of Biomechanics 44:543 - 546.
Belleza, A. J., Hart, R. T., Burgoyne, Cl. F. (2000). The Optic Nerve Head as Biomechanical Structure: Initial Finite Element Modeling. Investigative Ophthalmology & Visual Science 41:2991 - 3000.
Bisplinghoff, J. A., McNally, C., Manoogian, S. J., Duma, S. M. (2009). Dynamic material properties of the human sclera. Journal of Biomechanics 42:1493 - 1497.
Bradski, G. (2000). The OpenCV library. DrDobb’s Journal of Software Tools.
Canseco de la Cruz, R. A., Camarillo Gómez, K. A., Silva Moreno A., Lesso Arroyo, R. (2011). Experimentación y Análisis por MEF del Comportamiento Hiperelástico en Materiales usados en Calzado Deportivo. Ingeniería Mecáni-ca 4:23 - 31.
Celentano, D. (2001). A large strain thermoviscoplastic for the solidification of S.G. cast iron in a green sand mould. International Journal of Plasticity 17:1623 - 1658.
Celentano, D. J, Palacios, M. A., Rojas, E. L. Cruchaga, M. A., Artigas, A. A., Monsalve, A. E. (2009). Simulation and experimental validation of multiple-step wire drawing processes. Finite Elements in Analysis and Design 45:163-180.
Chiba M., Furukawa T. (2010). A new approach to vibration reduction analysis using thin polymide tape inserted between structural elements. Experimental Mechanical. DOI: 10.1007/s11340-010-9447-y
Eilaghi, A., Flanagan, J. G., Tertinegg, I., Simmons, C. A., Brodland, G. W., Ethier, C. R. (2010). Biaxial mechani-cal testing of human sclera. Journal of Biomechanics 43:1696 - 1701.
Elsheikh, A., Alhasso, D., Rama, P. (2008). Biomechanical properties of human and porcine corneas. Experimental Eye Research 86:783 - 790.
Elsheikh, A., Geraghty, B., Alhasso, D., Knappett, J., Campanelli, M., Rama, P. (2010). Regional variation in the biomechanical properties of the human sclera. Experimental Eye Research 90:624 - 633.
García - Herrera, C. M., Celentano. D., Cruchaga, M. A., Rojo, F., Atienza, J., Guinea, G. y Goicolea, J. (2011). Mechanical characterization of the human thoracic descending aorta: Experiments and modelling. Computer Meth-ods in Biomechanics and Biomedical Engineering 15:1025 - 5842.
García - Herrera, C., Celentano, D. (2013). Modelling and numerical simulation of the human aortic arch under in-vivo conditions. Biomechanics and Modeling in Mechanobiology. DOI:10.1007/s10237-013-0471-6
García - Herrera, C., Celentano, D., Cruchaga, M. A. (2012). Bending and pressurization test of the human aortic arch: Experiments, modelling and simulation of a patient - specific case. Computer Methods in Biomechanics and Biomedical Engineering, nº DOI: 10.1080/10255842.2011.641123.
Gonzáles, Carbonell, R. A., Álvarez, E., García, J., Moya, Rodríguez, L., Abreu, Gonzáles, K. (2009). Modelos de materiales hiperelásticos para el análisis de los elastómeros usando el MEF. Ingeniería Mecánica 12:57 - 66.
Holzapfel, G. A. (2000). Nonlinear Solid Mechanics: A Continuum Approach for Engineering, John Wiley & Sons (West Sussex).
Lari, D. R., Schultz, D. S., Wang, A. S., Lee, On – Tat, Stewart, J. M. (2012). Scleral mechanics: Comparing whole globe inflation and uniaxial testing. Experimental Eye Research 94:128 - 135.
Meunier, L., Chagnon, G., Favier, D., Orgéas, L. Vacher, P. (2008). Mechanical experimental characterization and numerical modelling of unfilled silicone rubber. Polymer Testing Journal 28:765-777.
Norman, R. E., Flanagan, J. G., Rausch, S. M. K., Sigal, I. A., Tertinegg, I., Eilaghi, A., Portnoy, Sh., Sled, J. G., Ethier, C. R. (2010). Dimension of the human sclera: Thickness measurement and regional changes with axial length. Experimental Eye Research 90: 277 - 284.
Ogden, R. W. (1984). Non-Linear Elastic Deformations, Dover.
Ogden, R. W., Saccomandi, G. y Sgura, I. (2004). Fitting hyperelastic models to experimental data. Computational Mechanics 34:484-502.
Rackl, M. (2015). Curve Fitting for Ogden, Yeoh and Polynomial Models. ScilabTEC, conference (Regensburg). Ruiz - Ederra, J., García, M., Hernández, M., Urcola, H., Hernández - Barbáchano, E., Aaiz, J., Vecino, E. (2005). The pig eye as novel model of glaucoma. Experimental Eye Research 81:561 - 569.
Saab, M. A. (1999), Applications of high-pressure balloons in the medical device industry. [Online]. Available: http://www.ventionmedical.com/
Sasso, M., Palmieri, G., Chiappini, G., Amodio, D. (2008). Characterization of hyperelastic rubber-like materials by biaxial and uniaxial stretching test based on optical methods. Polymer Testing Journal 27:995-1004.
Schultz, D. S., Lotz, J. C., Lee, Sh. M., Trinidad, M. L., Stewart, J. M. (2008). Structural Factors That Mediate Scleral Stiffness. Investigative Ophthalmology & Visual Science 49:4232 - 4236.
Skouras, M., Thomaszewski, B., Bickel, B., Gross, M. (2012). Computational Design of Rubber Balloons. EU-ROGRAPHICS 31:835 - 844.
Stitzel, J. D., Duma, S. M., Cormier, J. M., Herring, I. P. (2002). A nonlinear finite element model of the eye with experimental validation for the prediction of globe rupture. Stapp Car Crash Journal 46:81 - 102.
Verron, E., Marckmann, G. (2003). Numerical analysis of rubber balloons. ThinWalled Structures Journal 41:731 -746.
Verron, E., Marckmann, G., Peseux, B. (2001). Dynamic inflation of non-linear elastic and viscoelastic rubber-like membranes. International Journal for Numerical Methods in Engineering 50:1233 - 1251.