NEURAL NETWORKS TO IDENTIFY PARTICLES USING TOPOLOGICAL
PROPERTIES OF CALORIMETERS
Denis Oliveira Damazio
∗José Manoel de Seixas
∗∗Laboratório de Processamento de Sinais (LPS)
COPPE/EE/UFRJ, CP 68504, Rio de Janeiro 21945-970, Brazil
ABSTRACT
The present work describes a neural particle classifier system based on topological mapping of the segmented information provided by a high-energy calorimeter, a detector that mea-sures the energy of incoming particles. The achieved clas-sification efficiencies are above 97.50% for the higher en-ergy particle beams, even when experimental data exhibit un-avoidable contamination due to the particle beam generation process, what could jeopardize the classifier performance. Some deterioration in the performance for the lower energy range is also discussed. The reduction on the dimensionality of the data input space caused by the topological mapping may be very helpful when online implementation of the clas-sifier is required.
KEYWORDS: Neural networks, calorimeters, electronic
in-strumentation.
RESUMO
O presente trabalho apresenta um sistema classificador base-ado em redes neurais aplicadas a um mapeamento topológico da informação segmentada fornecida por um calorimetro de altas energias. Este detector mede a energia das particulas incidentes em feixes experimentais. A eficiência de classifi-cação atingida fica acima de 97,50% para feixes de mais alta energia, mesmo quando os dados experimentais apresentam uma inevitável contaminação ocasionada durante o processo
Artigo submetido em 12/12/02 1a. Revisão em 24/06/03
Aceito sob recomendação do Ed. Assoc. Prof. Cairo L. Nascimento
de produção das partículas. Alguma deterioração da quali-dade do classificador encontrada para feixes de mais baixa energia também é discutida. A redução no número de dimen-sões do espaço de entrada, causada pelo mapeamento topo-lógico, pode ser muito importante quando a implementação do classificador para operaçãoonlinefor considerada.
PALAVRAS-CHAVE: Redes neurais, calorímetros,
instru-mentação eletrônica.
1
INTRODUCTION
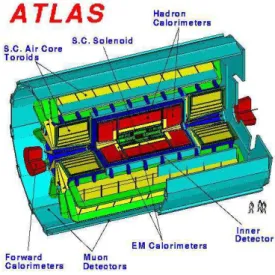
In the search for increasing the knowledge on the structure of matter, a bunch of collider experiments have been con-structed and operated. To probe deeper into matter, CERN (The European Laboratory for Particle Physics, 2002) is now building a next generation particle accelerator. Such acceler-ator will use superconductivity to create huge magnetic fields which are necessary to maintain the particles on their tracks while an enormous amount of energy is transferred to them. From the particle collisions, it is expected to be found impor-tant reactions that may prove or disprove theoretic models in high-energy physics.
Figure 1: The ATLAS detector.
comprise tracking detectors (to display the trajectories of the particle coming from the impact point), calorimeters (to mea-sure the energy of the particles) and other specific detectors, such as the muon chambers to detect muons, an important particle to the LHC physics.
One of the calorimeters of the ATLAS detector is Tilecal (F. Ariztizabal et al., 1990), which is specialized to detect the energy of hadronic particles, such as pions. This calorimeter is now in the calibration phase, in which calorimeter modules are submitted to particle beam tests. For detector calibration, beam selection comprises the type of particle to be injected (electrons, pions, and muons are used) and the energy (typi-cally, energy selection ranges from 20 GeV to 180 GeV). De-spite the high quality achieved by the beam line nowadays, it is unavoidable particle contamination, when a specific beam selection is made. Thus, muons are present (up to 30%) in pion beam selections and both muons and pions can be de-tected (up to 70% level of contamination has been observed) in electron beam selections. Such contamination levels tend to mask the actual performance of the calorimeter and affect the accuracy of the calibration process. Muon beams can be considered contamination free.
The purpose of this work is to use the calorimeter informa-tion for online rejecinforma-tion of particle contaminainforma-tion (outsider particles). As the calorimeter absorbs the energy of the in-coming particles and it is segmented into a number of cells, it provides a detailed information of the energy deposition profiles, so that particle classes can be identified.
The online rejection of outsiders allows calibration data to be recorded free of contamination. For achieving high
parti-Figure 2: The structure of TileCal.
cle classification efficiencies and fast response, a topological mapping that groups calorimeter cells is developed. Such compacted calorimeter information is fed into the neural classifier for final particle identification, in terms of elec-trons, pions or muons.
The paper is organized into four sections. The next section will describe the calorimeter properties and the topological mapping used. The third section will focus on the results of the neural network application. Finally, the fourth section will derive some conclusions.
2
HADRONIC CALORIMETER
The hadronic calorimeter will form a toroid around the AT-LAS collision point. The structure of TileCal can be seen in Fig. 2. It comprises a central barrel and two extended barrels, each one made of 64 modules. Products of the collisions will enter into TileCal at different impact points, defining regions of interest that will be analyzed in terms of energy and how the energy is deposited in the calorimeter.
η=−0.75
η=−0.85 η=−0.25
η=−0.95 η=−0.65 η=−0.55 η=−0.35 η=−0.45 η=−0.05 η=−0.15
Figure 3: Cell topology in a calorimeter module and the trig-ger tower definition.
the outsider part of the detector by means of optical fibers, which are coupled to the tiles.
Detector segmentation into cells is produced by grouping fibers in the calorimeter modules and connecting them to photomultiplier tubes, which convert the light into
elec-trical signals. The energy deposited in the detector can
be estimated by adding the information readout from each calorimeter cell. Fig. 3 shows the cell topology.
As marked in Fig. 3, towers of cells are formed in the
calorimeter structure, representing possible particle tracks in the calorimeter. These towers will be used for particle iden-tification at LHC, in order to reduce the high event rate (40 MHz) of LHC (ATLAS Level-1 Trigger Group, 1998). For this, an online triggering system is being designed and it relies strongly in the information obtained from the energy deposited in each tower of TileCal (Cerqueira et al., 2001). For the present work, 10 such trigger towers were formed by grouping the cells along the pseudorapidity directions (from η= 0.05up toη0.95).
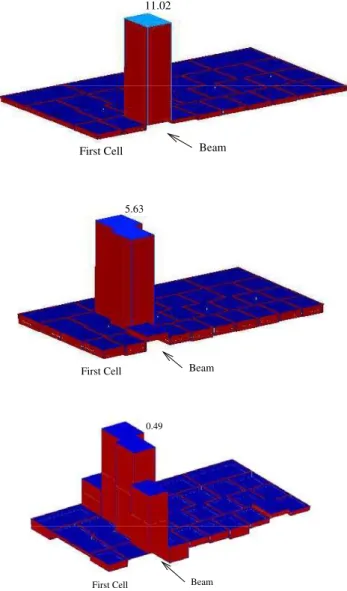
Each type of particle has a specific deposition profile in the calorimeter (Wigmans, 2000). For example, a typical elec-tron event is displayed in Fig. 4, top. The heights in this figure represent the amount of energy deposited in each cell. As it can be inferred from this figure, electrons deposit al-most all of its energy in the first cell they touch. On the other hand, typical pion profiles tend to achieve a deeper maxi-mum, reaching the second layer of cells and spreading more energy around such maximum (Fig. 4, middle). However, higher fluctuations in pion profiles are observed, making pion events to come closer to the electron pattern.
Muons typically deposit just a small fraction of their energy in the calorimeter (Fig. 4, bottom), being easier to discrim-inate from the other two classes of particles, which deposit
Beam 11.02
First Cell
Beam 5.63
First Cell
Beam 0.49
First Cell
Figure 4: Typical electron (top), pion (middle) and muon (bottom) events.
around the nominal value of the beam1.
Discriminating between particles with calorimeter informa-tion is then a pattern recogniinforma-tion problem, for which neural networks (Haykin, 1999) may be an interesting choice. Feed-ing a neural classifier with such detailed energy deposition profiles (obtained from cell readout), a high performance par-ticle identification system may be designed (Denby, 1999). However, as it was already mentioned, particle beams used for calibrating the calorimeter can be contaminated by out-sider particles. This leads to a higher degree of difficulty in the classification task, since the pure data can only be
tained from a muon beam line.
The training method chosen for the neural classifier design was backpropagation, which is a supervised training method that requires the presentation of input-output pairs for adapt-ing the neural network weights (Haykin, 1999). As a signif-icant amount of events may be outsiders in a given data set acquired from a beam test, target values for the network train-ing will be wrongly assigned. Despite such error in input-output assignment, it will be shown that the neural classifier can quickly recognize the energy deposition profile provided by the calorimeter for each particle class and, based on this, identify the actual class of the incoming particle. As online operation is envisaged, the network input information will be provided by the trigger tower mapping of the energy deposi-tion profile. This data compacdeposi-tion allow to optimize the pro-cessing speed for both training and production phases of the network, so that the input data rate of the acquisition system will not be deteriorated by the neural processing.
3
RESULTS
For designing the neural network and evaluating its clas-sification efficiency, the Jet Net-2.0 package (Lönnblad et al, 1992) was used. The multilayer neural network topology was optimized to satisfy both performance and compaction criteria. The final topology comprised 10 input nodes (to be fed by the ten trigger tower signals), 8 hidden nodes and 3 output nodes. Each output node was assigned to a given par-ticle class (electrons, pions or muons).
Experimental data was composed of data sets related to each beam acquisition (muons, pions with contamination and electrons with contamination). Each data set contained more than 8000 events. These data sets were split into two sets, one used in the training phase of the network design and the other used to test the generalization power of the classifier. Due to the high level of statistics of the experimental data sample for all classes, training efficiencies were fully repro-duced by the testing sets.
In spite of data contamination, for the training phase data ac-quired from a given beam selection were labeled according to the beam type, and only a single output was activated by the target vector. For instance, for electron beams of differ-ent energies (20, 100, and 180 GeV), all suffering from both muon and pion contamination, acquired events were labeled as electrons, even though muons and pions should be present in the data sample. For this, the target values were +1 (activa-tion) for the electron output node and -1 for the other output nodes. In the testing phase maximum probability was used to determine to which class the incoming particle would belong (Trees, 1971).
−1 0 1
0 200 400 600
800 electrons output
electrons
−1 0 1
0 200 400 600
800 pions output
−1 0 1
0 1000 2000 3000
4000 muons output
−1 0 1
0 1000 2000 3000 4000 5000 pions
−1 0 1
0 1000 2000 3000 4000
−1 0 1
0 2000 4000 6000 8000
−1 0 1
0 200 400 600 800 1000 muons
−1 0 1
0 100 200 300 400 500
−1 0 1
0 100 200 300
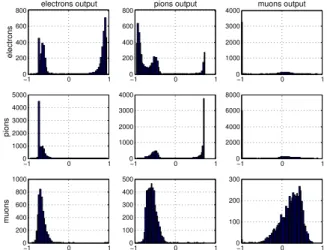
Figure 5: Neural network outputs (columns) for the three data sets (rows). See text
The hyperbolic tangent was the activation function selected for all neurons and the mean squared error, computed be-tween the actual network output and the target vector for each event, was the figure of merit of the training phase. The stop criterium for the training phase was the maximum efficiency, which was computed by the product of the efficiencies over all particle classes.
For each event the trigger tower values were normalized by the square root of the absolute value of the total energy ab-sorbed by the calorimeter (all trigger tower signals added up). This normalization scheme envisaged to retain some infor-mation on the level of the energy deposited by each incoming particle, which is quite relevant for discriminating electron and pions from muons (as from Fig 4, muons deposit very small amount of energy in the detector).
−1 −0.8 −0.6 −0.4 −0.2 0 0.2 0.4 0.6 0.8 1 −1
−0.8 −0.6 −0.4 −0.2 0 0.2 0.4 0.6 0.8 1
electron output
pion output
e not e
pi
not pi
−1 −0.8 −0.6 −0.4 −0.2 0 0.2 0.4 0.6 0.8 1 −1
−0.8 −0.6 −0.4 −0.2 0 0.2 0.4 0.6 0.8 1
muon output
electron output e not e
mu
not mu
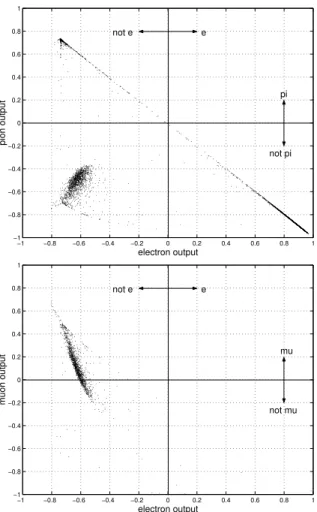
Figure 6: Correlation of the electron output and pion output (top). For the events with negative pion output, the correla-tion between the electron output and the muon output is also presented (bottom).
the electron output does not recognize them as electrons and thus declares them outsider particles in the data sample. The pion output (next histogram on the right) shows an agree-ment to the electron output, as it recognizes some events from the electron beam as pions by means of exhibiting two-peak structure, which includes a second peak near -1.
To confirm this result, Fig. 6 presents the correlation between the electron output and the pion output (top) and th corre-lation between the electron and the muon outputs. As can be seen, the events considered by the electron output as be-ing electrons (horizontal positive axis), were the same events considered not pions by the pion output (vertical negative axis). The events considered by the pion output as being pi-ons, were the same events considered not electrons by the electron output. There are some events that received electron and pion output negative. The bottom figure shows the
corre-lation between the electron and the muon output for the same events, except that the events with positive pion output were cut off. Again, the events considered to be electrons by the electron output were rejected as muons by the muons output and the events considered to be muons were rejected as elec-trons by the electron output. This means that the network shows to be able to identify incoming particles by their main features of energy deposition. Therefore, it can be concluded that the wrong labeling caused by beam contamination did not avoid the neural classifier to learn the detailed energy de-position profiles provided by the calorimeter.
Although the neural network response seems to understand the physics processes involved in the absorption of the in-coming energy from different particle classes, validation of the particle identification is mandatory. As the application is intended to perform online rejection of outsiders, it should be guaranteed that the neural classifier does not introduce any bias in the data sample, allowing the offline analysis to be executed accurately.
The network response can be validated by means of ex-ploitation of the main features of the shower development. As muons deposit a small fraction of their energy in the calorimeter, an energy cut suffices for muon identification, although detection efficiency decreases for lower energy beams. On the other hand, pions tend to travel much fur-ther in the calorimeter, with respect to electrons, so that the shower development in depth can be extremely powerful in electron/pion separation.
Considering data from pion beam (100 GeV), Fig. 7 displays the correlation between the total energy andOπ−Oµ, the
subtraction of the muon output of the network from the pion output. As it can be seen, events in this plot with a positive Oπ−Oµ, which correspond to declared pions by the neural
classifier, are those that deposited the largest energy in the detector. On the other hand, events with a negativeOπ−
Oµ (so identified as muons by the network, as the electron
output is not triggered by data from pion beam selections) are exactly those that deposited only a small fraction of their energy in the calorimeter. This agrees with the energy cut for separating muons from pions, which is typically established at 20 GeV for 100 GeV nominal beam energy.
−1.50 −1 −0.5 0 0.5 1 1.5 2 10
20 30 40 50 60 70 80 90 100
pion output minus muon output
Total Energy in the Module (GeV)
π µ
Figure 7: The subtraction of muon output from pion output correlated with the total energy deposited in the detector.
that events above this cut can be identified as electrons.
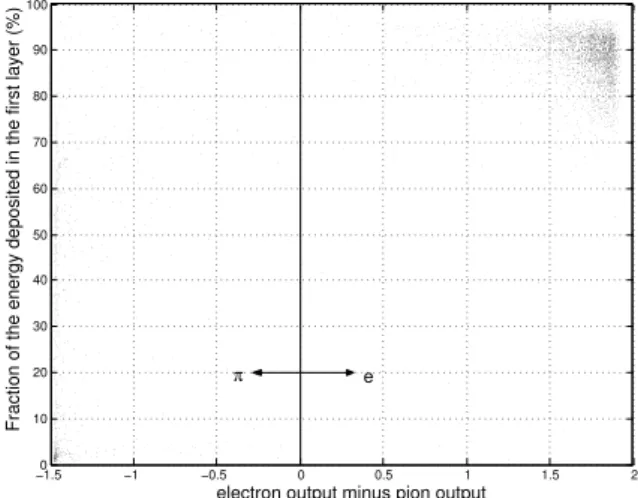
Figure 8 shows the correlation between the fraction of en-ergy deposited in the first layer andOe−−Oπ, the subtrac-tion of the pion output from the electron output. This figure shows that the neural network response has also learned the energy deposition profile in depth, as most events that de-posited more than 72% of their energy in the first layer had positiveOe−−Oπ, which means they have been declared as
electrons by the neural classifier. In addition, most of events with negativeOe− −Oπ(rejected electrons) deposited less
than 72% of their energy in this first layer.
The expert information on the physics involved in shower development within the calorimeter can benchmark the neu-ral processing, proving that the neuneu-ral particle identification is unbiased. Classically, high-energy physicists combine de-tector information (total energy and shower development in depth) with data from auxiliary detectors (Cherenkov coun-ters (Green, 2000) and especial muon detectors are typi-cally used for improving outsider particle detection for lower energy values) for particle identification with calorimeters. This classical methodology can validate the neural classifi-cation (Seixas and Damazio, 1998), but it is quite hard to be implemented online, since it it is based on correlations that depend on beam. Also, classical methodology does not de-pend only on calorimeter information and for smaller energy beams it relies very much on auxiliary detector information, which increases the difficulties for online operation. As it will be shown next, neural processing works fine for different energy values and meets the requirement for online outsider rejection.
Table 1 shows the agreement between the classical
method-−1.50 −1 −0.5 0 0.5 1 1.5 2
10 20 30 40 50 60 70 80 90 100
electron output minus pion output
Fraction of the energy deposited in the first layer (%)
e π
Figure 8: The subtraction of pion output from electron output correlated with the fraction of the energy deposited in the first detector layer.
Table 1: Agreement between neural and classical method-ologies for 100 GeV electron beam data.
Classical Neural Network
Method electron pion muon
electron 55.79% 0.55% 0.04%
pion 1.61% 11.78% 0.15%
muon 0.11% 0.0% 29.98%
ology and the neural network classification, considering 100 GeV electron beam. Total energy cuts for muon detection were placed at 20 GeV and electron/pion separation used a cut in the energy deposited in the first layer at 72%. In terms of contamination in the electron beam, both methods agree that pion contamination is at the level of 11.78% and outsider muons are present at a level of 29.98% of the data sample. Only 55.79% of the data sample was identified as electrons by both methods. The total agreement between the two techniques is 97.55%, which is quite impressive.
com-pact classifier still performs better. In addition, for online application, the reduction of the complexity of the neural network, reducing the input nodes from 23 to 10, is quite interesting as it can produce a faster classifier.
Table 2: Comparison between neural classifiers fed by trig-ger towers or full calorimeter granularity for 100 GeV elec-tron, pion and muon beams.
agreem. elec. pion muon average.
gran. 95.30% 94.37% 99.50% 96.39%
tower 97.55% 97.62% 97.80% 97.66%
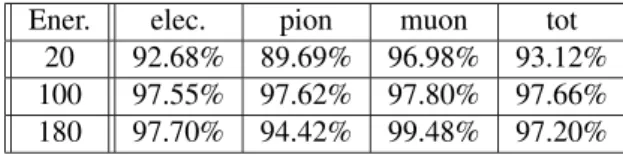
In order to check the dependency of the neural processing on beam energy, the neural classifier using trigger tower in-formation was evaluated for other energy beam selections, covering low and high energy ranges. For both 100 and 180 GeV data, classical methodology employed the same cuts as referred to above. For 20 GeV data, the total energy cut was set to 7 GeV and the Cherenkov counter was used for per-forming electron/pion separation. The agreement between neural and classical methodologies is found in Table 3. Re-sults are given in terms of overall agreement on each data sample, considering electron, pion and muon beams. As it can be depicted from this table, agreement is reduced for the 20 GeV case, being more significant for pion beam selec-tion. This can be explained by the fact that, at 20 GeV, the pion deposition profile is smaller in depth, being quite similar to the electrons’ profile. In fact, 6.96% of the data sample, although recognized as pions by the classical methodology based on the Cherenkov counter, were identified as electrons by the neural network, which results in such disagreement.
Table 3: Agreement between neural and classical method-ologies for different beam energies (in GeV).
Ener. elec. pion muon tot
20 92.68% 89.69% 96.98% 93.12%
100 97.55% 97.62% 97.80% 97.66%
180 97.70% 94.42% 99.48% 97.20%
To further evaluate this shower development effect for 20 GeV, Fig. 9 displays the distribution for the sum of the ener-gies deposited in the second and the fourth towers (the beam was entering into the calorimeter through the third layer, so these are the neighbor towers with respect to the impact point) for incoming particles from electron beam selections. The figure at the top shows the distribution for such sum of the trigger tower signals for 20 GeV data and the one at the bottom the sum for 100 GeV. For 100 GeV, there is a rela-tively clear separation that can be established between elec-trons and muons (that only deposit energy in the main tower)
−5 0 5 10 15 20
0 2000 4000 6000 8000 10000 12000 14000
Sum of the side towers (20 GeV)
Number of events
−5 0 5 10 15 20
0 2000 4000 6000 8000 10000 12000
Sum of the side towers (100 GeV)
Figure 9: The sum of the towers around the main tower for 20 GeV (top) and 100 GeV (bottom) electron beam selections.
and pions (that can leak energy to neighbor towers). For 20 GeV, separation is much harder, as only a small energy tail is observed in the distribution. This means that, if the sum of the towers around the maximum is an important informa-tion for the neural discriminator, there is a clear explanainforma-tion for the decrease in performance of the neural classifier for 20 GeV data.
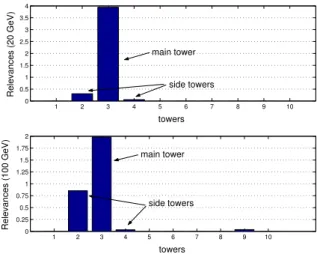
So, it is important to evaluate which detector information is relevant to the neural classifier. To evaluate information rel-evance the method was the following: for each neural net-work trained (one for the 20 GeV case and other to the 100 GeV case), the inputs (one at a time) were substituted by their mean value computed over the entire training set (including patterns from electron, pion, and muon beams with their in-herent outsider particles). Then, the mean square error the outputs with relation to the outputs of the normal network is calculated for the entire set. In mathematical terms, the relevance of the inputjis :
relevance(j) = 1
NΣ
N
i=1|Outorg(i)−Outj(i)|2 (1)
WhereOutorg(i)is the output of the neural network for the original data set andOutj(i)is the output of the same net-work on the set with the inputj changed by its mean. N is the number of events on all data sets. If the input does not im-ply in a reasonably discrimination, the difference between its usage and the usage of the mean should not have an impor-tant impact on the neural network output. In the other way, if the input is important to the discrimination, then substituting it by its mean would produce a great error.
1 2 3 4 5 6 7 8 9 10 0
0.5 1 1.5 2 2.5 3 3.5 4
towers
Relevances (20 GeV)
1 2 3 4 5 6 7 8 9 10
0 0.25 0.5 0.75 1 1.25 1.5 1.75 2
towers
Relevances (100 GeV)
main tower
side towers
main tower
side towers
Figure 10: Relevances computed for each neural network in-put for the 20 GeV case (top) and the 100 GeV case (bottom).
the second tower has an information which is very similar to the fourth tower, since the particle energy spread can be imagined, in a simplified way, as a circle around the maxi-mum (third tower), so touching equally the second and the fourth towers. This fact is recognized by the neural network that gives a relative importance to the second tower but treats the fourth one as redundant information by not assigning a very high relevance to it. We can observe that only the tow-ers from 2 to 4 have a greater importance. This could lead to a procedure that uses just these towers as inputs to the network. Since our approach tried to keep the possibility of using the network for any tower, we decided to have all the towers. Also, as can be seen, a greater importance was as-signed to the third layer at 20 GeV case than at the 100 GeV case, showing that most of the decision was taken based on that tower for 20 GeV, while for the 100 GeV there is a tive greater importance given to the second tower. The rela-tive importance of the second tower for 20 GeV with relation to the maximum is more than 5 time smaller than the same measurement for 100 GeV.
This demonstrates that the neural network was capable to identify the smaller importance of the second (and fourth) tower, but, anyway the network was not capable to have a so high performance than in the higher energy cases. One pos-sible solution is to usage of the fully calorimeter granularity, in order to observe the different energy deposition profiles inside a given tower. Using greater granularity at 20 GeV, it was possible to reach an agreement of 95.22% for the elec-tron beam, 93.34% for the pion beam and 97.48% for the muon beam, 95.35% in the average, being comparable to the 100 GeV case. The cost of this procedure is, as said before, a greater time for training and testing the neural network.
4
CONCLUSIONS
The neural methodology developed in this work employed a topological mapping based on trigger towers as a prepro-cessing method for a compact description of the information provided by a high-energy calorimeter. This design approach produced a high-efficiency particle discriminator that proved also to be able to identify outsider particles (contamination) in the data samples, even overcoming the wrong labeling of events in the supervised training of the classifier due to the existence of data contamination. This means that the back-propagation method could be used even when there is some inherent inconsistency in the data sample, which is an im-portant result to the artificial intelligence field. Since it is un-avoidable the wrong labeling of patterns, a design based on unsupervised methods, such as Kohonen networks, can prob-ably be applied to particle discrimination with calorimeters. This shall be part of the developments of the future.
The results obtained in this paper have shown that a very good performance for the higher energy range could be achieved by the neural classifier, although some deterioration had been verified for the lower energy range (20 GeV). This was explained by the fact that part of the relevant informa-tion was missing in the 20 GeV case, because of the smaller energy spread in the calorimeter for 20 GeV energy parti-cles. The neural network proved to be able to identify such reduction in the relevance of some input towers information, but, due to the complexity of the problem, the network could not recover completely from this reduction in discrimination power of the calorimeter towers. In such case, the usage of the full calorimeter granularity could be a possible solution to profit from the tower internal energy distributions (Damazio et al., 2002). Another possibility would be to combine tow-ers with the cells from the tower that had been hit by the incoming particle beam.
The developed methodology can be applied for online oper-ation, profiting from the inherent input space dimensionality reduction and consequent increase in processing speed. This online classifier is envisaged to be used in the next beam test period of the calorimeter.
ACKNOWLEDGMENTS
REFERENCES
ATLAS Collaboration (1994). Technical proposal for
a general-purpose pp experiment at the large
hadron collider at cern, Technical report, CERN.
http://www.cern.ch/Atlas.
ATLAS Level-1 Trigger Group (1998). Level-1
tech-nical design report, Technical report, CERN.
http://atlas.web.cern.ch/Atlas/GROUPS/DAQTRIG/ TDR/tdr.html.
Cerqueira, A. S., de Seixas, J. M. and Caloba, L. P. (2001). An active adder for building the trigger signal of the
hadronic calorimeter of atlas, IEEE Second
South-American Workshop on Circuits and Systems.
Damazio, D. O. and de Seixas, J. M. (1999).
Out-sider identification in a neural particle
dis-criminator based on calorimetry, Artificial
In-teligence on High Energy Physics, Creta,
Greece. http://www.lps.ufrj.br/˜damazio/artigos/
aihenp299.ps.gz.
Damazio, D. O., Seixas, J. M. and Magacho, P. V. (2002). An online neural network triggering system for the tile calorimeter,IEEE Transactions on Nuclear Science
49(2): 369–376.
Denby, B. (1999). Neural networks in high-energy physics:
a ten year perspective, Comp. Phys. Comm. 119
(2-3): 219–231.
F. Ariztizabal et al. (1990). Construction and
performance of an iron-scintillator hadron
calorimeter with longitudinal tile configuration,
A349: 384–397. http://atlasinfo.cern.ch/Atlas/
SUB_DETECTORS/TILE/tilecal.html.
Green, D. (2000). The Physics of Particle
Detec-tors, Cambridge U. Press, New York, Estados
Unidos.
http://www.physicstoday.org/pt/vol-54/iss-8/p47b.html.
Haykin, S. (1999). Neural Networks: A Comprehensive
Foundation, Prentice-Hall.
Large Hadron Collider (2002). LHC.
http://www.cern.ch/lhc.
Lönnblad et al (1992). Pattern recognition in high
en-ergy physics with artificial neural networks - jetnet 2.0,
Comput. Phys. Commun.70: 67.
Seixas, J. M. and Damazio, D. O. (1998). A neural discrim-inator capable to identify impurities in the data sample,
IEEE International Conference on Electronics, Circuits and Systems - Lisbon, Portugal.
The European Laboratory for Particle Physics (2002). CERN. http://www.cern.ch.
Trees, H. V. (1971). Detection, Estimation and Modulation Theory, John Wiley & Sons.
Wigmans, R. (2000). Calorimetry Energy