ww w . r e u m a t o l o g i a . c o m . b r
REVISTA
BRASILEIRA
DE
REUMATOLOGIA
Original
article
Association
of
vascular
function
and
estimated
cardiovascular
risk
in
patients
with
rheumatoid
arthritis
Herwig
Pieringer
a,b,∗,
Erich
Pohanka
a,
Rudolf
Puchner
c,
Tobias
Brummaier
aaKeplerUniversityHospital,2ndDepartmentofInternalMedicine,AcademicResearchUnit,Linz,Austria
bParacelsusPrivateMedicalUniversitySalzburg,Salzburg,Austria
cRheumatologistinPrivatePractice,Wels,Austria
a
r
t
i
c
l
e
i
n
f
o
Articlehistory:
Received23December2016 Accepted6May2017 Availableonline4July2017
Keywords:
Rheumatoidarthritis Pulsewaveanalysis Cardiovascularrisk SCORE
QRISK2
a
b
s
t
r
a
c
t
Objectives:Rheumatoidarthritis(RA)patientsshouldreceivecardiovascular(CV)risk
assess-ment.ForthispurposeCVriskcalculatorsareavailable.Inaddition,parametersofvascular functioncanbemeasuredandusedforriskprediction.Aimofthepresentstudywasto assesstheassociationofthesetwoconcepts.
Methods:287RApatients(58.4±12.6years)and232controls(49.9±13.4years)wereincluded
inthiscross-sectionalstudy.Wecalculated10yearCVriskwithSCOREandQRISK2.For SCOREweusedtherecommendedmultiplierof1.5ineligibleRApatientsandestimated theriskalsoinpatientsyoungerthan40years(mSCORE(0–65)).Augmentationindex(AIx) andcentralpulsepressure(PP),markersofvascularintegrityandCVrisk,wereassessedby pulsewaveanalysis(PWA).PrimaryendpointwasthecorrelationofAIxandtheestimated CVriskusingmSCORE(0–65).
Results:InRApatientsAIxshowedastatisticallysignificantcorrelationwithmSCORE(0–65)
(rho=0.3374;p<0.0001)andQRISK2(rho=0.3307;p<0.0001).ThecorrelationsofcentralPP withmSCORE(0–65)(rho=0.4692;p<0.0001)andQRISK2(rho=0.5828;p<0.0001)werealso statisticallysignificant.IncreasingquartilesofcentralPPwereassociatedwithanincreased oddsofbeinginthe“highrisk”categoryaccordingtoSCORE(OR2.18;95%CI1.58–3.01)or QRISK2(OR2.18;95%CI1.75–2.72).IncontrolpatientswealsofoundacorrelationofAIxand centralPPwithSCORE(0–65)andQRISK2.
Conclusions:ParametersofcentralhaemodynamicscorrelatewithcalculatedCVrisk.
How-ever, both do not give exactly the same information. The question arises whether a combinationofbothconceptswouldresultinanimprovedCVriskprediction.
©2017ElsevierEditoraLtda.ThisisanopenaccessarticleundertheCCBY-NC-ND license(http://creativecommons.org/licenses/by-nc-nd/4.0/).
∗ Correspondingauthor.
E-mail:[email protected](H.Pieringer).
http://dx.doi.org/10.1016/j.rbre.2017.06.001
Associac¸ão
entre
a
func¸ão
vascular
e
o
risco
cardiovascular
estimado
em
pacientes
com
artrite
reumatoide
Palavras-chave:
Artritereumatoide Análisedeondadepulso Riscocardiovascular SCORE
QRISK2
r
e
s
u
m
o
Objetivos: Ospacientescomartritereumatoide(AR)devemreceberumaavaliac¸ãodorisco
cardiovascular(CV).Paraestefim,existemascalculadorasderiscoCV.Alémdisso, parâmet-rosdafunc¸ãovascularpodemsermedidoseutilizadosparapredic¸ãodorisco.Oobjetivo desteestudofoiavaliaraassociac¸ãoentreestesdoisconceitos.
Métodos:Foramincluídosnesteestudotransversal287pacientescomAR(58,4±12,6anos)e
232controles(49,9+/-13,4anos).Calculou-seoriscoCVem10anoscomoSCOREeoQRISK2. NoSCORE,utilizou-seomultiplicadorrecomendadode1,5empacientescomARelegíveise estimou-setambémoriscoempacientescommenosde40anos[mSCORE(0-65)].Oíndice deaumento(AIx)eapressãodepulso(PP)central,marcadoresdaintegridadevasculare riscoCV,foramavaliadospelaanálisedeondadepulso(PWA).Odesfechoprimáriofoia correlac¸ãoentreoAIxeoriscoCVestimadousandoomSCORE(0-65).
Resultados: EmpacientescomAR,oAIxmostroucorrelac¸ãoestatisticamentesignificativa
comomSCORE(0-65)(rho=0,3374;p<0,0001).Acorrelac¸ãoentreoAIxeoQRISK2também foisignificativa(rho=0,3307,p<0,0001).Ascorrelac¸õesentreaPPcentraleomSCORE(0-65) (rho=0,4692;p<0,0001)eQRISK2(rho=0,5828;p<0,0001)tambémforamestatisticamente significativas.Osquartisincrementaisda PPcentral estiveramassociadosa umamaior probabilidadedeestarnacategoriade“altorisco”deacordocomoSCORE(OR2,18;IC95% 1,58a3,01)ouQRISK2(OR2,18;IC95%1,75-2,72).Nospacientesdogrupocontroletambém seencontrouumacorrelac¸ãoentreoAIxeaPPcentralnoSCORE(0-65)enoQRISK2.
Conclusões:OsparâmetrosdehemodinâmicacentralsecorrelacionamcomoriscoCV
calcu-lado.Noentanto,ambosnãofornecemexatamenteasmesmasinformac¸ões.Questiona-se seumacombinac¸ãodeambososconceitosresultariaemumamelhorpredic¸ãodoriscoCV. ©2017ElsevierEditoraLtda.Este ´eumartigoOpenAccesssobumalicenc¸aCC BY-NC-ND(http://creativecommons.org/licenses/by-nc-nd/4.0/).
Introduction
Previouslyit could beshownconsistently thatRheumatoid arthritis (RA) is associatedwith an increased cardiovascu-lar (CV) risk.1,2 This translates into a reduced lifespan of
patients with RA of approximately 3–18 years.3 Therefore,
the EuropeanLeague AgainstRheumatism (EULAR) recom-mendsregularassessmentofCVriskinpatientswithRA.For thispurposeEULARfavourstheuseoftheSystematic COro-naryRiskEvaluation(SCORE).AstheCVriskinRApatients maybeunderestimated,EULAR alsorecommendstoadjust CVriskscoremodelsbyintroducingamultiplierof1.5when RApatientsmeettwoofthefollowingthreecriteria:(a) dis-easeduration ofmorethan 10years,(b)rheumatoidfactor (RF)oranti-CCP-antibodiespositivityand/or(c)presenceof extra-articularmanifestations.4QRISK2isanothervalidated
CVdiseaseriskalgorithm, whichhastheparticular advan-tageofdirectlyincorporatingRAintothealgorithmofCVrisk estimation.5Therefore,furtheradjustmentforRAusinga
mul-tiplierisnotindicated.
CVriskcalculatorsarenotuniformlyprecise.6BesideCV
riskcalculatorsvascularmarkersforCVriskassessmentare available.7 Whatever thereason:if theintegrityofthe
ves-seliscompromised,its functionisimpairedand CVriskis increased. Pulse wave analysis (PWA) is a frequently used methodtodetectvasculardysfunctionandincreasedCVrisk.
Duringsystolethepulsewavespreadsoutalongthevessels andisfinallyreflected.Thisreflectedwaveaugmentscentral systolicbloodpressure.Theproportionofaugmentationofthe centralpulsepressure(PP)canbeexpressedasaugmentation index (AIx).PWAallowsdeterminingparametersofcentral haemodynamicssuchasAIxandcentralPPnon-invasively.8,9
From a pathophysiological point of view central pressures play a crucial role in the pathogenesis of CV diseases, as innerorgansareexposed tothesepressures.10–12 Previously
weandothersdemonstratedthatpatientswithRAhavea sig-nificantlyhigherAIxthanpatientswithoutRA13,14 andthat
this increasedriskisindependentofthepresenceof tradi-tionalCVriskfactors.15Ofinterest,littleisknownwhetherin
RApatientsmeasuredparametersofcentralhaemodynamics correlatewiththeestimatedCVriskderivedbyrisk calcula-tors.Aimofthepresentstudywastoassesstheassociation of thesetwo concepts. In anancillary analysiswe investi-gated the correlation ofthe same parameters ina control group.
Methods
Studydesignandsetting
Participants
Inthepresentstudyweincludedatotalof287patientswith adiagnosisofRAaccordingtothe1987AmericanCollegeof Rheumatologycriteria.16 Inaddition, weincluded232
non-RApatients(=controlgroup).Thestudywasapprovedbythe localethicscommittee(EthikkommissionLand Oberösterre-ich) and isinaccordance with theDeclaration ofHelsinki. Allpatients andcontrolsgavewritteninformed consentto participateinthestudy.ForeachRApatientweassessed tra-ditionalCVriskfactors.Smokinghabitsandantihypertensive medicationwereregisteredasprovideddirectlybythestudy participantsandasdeterminedbyevaluationofthemedical records.Wediagnosedpatientswithdiabetes(DM)according tothe GuidelinesoftheAustrianDiabetesAssociation.17In
addition,allpatientsreceivinganyformofantidiabetic treat-mentwereconsideredtohaveDM.Inallpatientsweevaluated disease duration,currentand previous treatmentwith dis-easemodifyinganti-rheumaticdrugs(DMARD),thepresence ofrheumatoidfactor,anyextra-articularRAmanifestationsas wellasthediseaseactivityscore28(DAS28).18
Pulsewaveanalysis
WeperformedPWAinallpatientsaspreviouslyreported.15
In short, we used radial applanation tonometry with a high-fidelitymicro-manometer(SPC-301,MillarInstruments, Houston,TX,USA).Wemeasuredbloodpressureimmediately beforePWAwithanautomatedoscillometricmethod(boso medicus,Bosch+SohnGMBH,Jungingen,Germany;validated andcertifiedbytheGermanSocietyforHypertension).A previ-ouslyvalidatedgeneralizedtransferfunctionintegratedinthe systemsoftwareoftheSphygmocorapparatus(AtCor Medi-cal,version6.31,Sydney,Australia)allowsthecalculationof parametersofcentralhaemodynamics.19,20ForAIxwegivethe
normalizedindexfor75beatsperminutetoexcludethe influ-enceofheartrateontheAIx.21Weonlyincludedhigh-quality
readingsasdeterminedbytheSphygmocorapparatusinthe analyses.EachPWAmeasurementwastakentwiceandthe meanofbothwasusedforfurtherstatisticalanalysis.
Riskcalculators
TwoCVriskestimationmodelswereappliedonall applica-blepatients. SCOREisthe CVriskmodelrecommended by theEuropeanSocietyofCardiology(ESC).22SCOREestimates
the10-yearriskofafatalatheroscleroticevent,whetherheart attack,stroke,aneurysmoftheaorta,orother.Theriskcanbe calculatedforpeopleaged40–65years.23Forourcalculations
inRApatientsweusedfourdifferentversionsofSCORE.First, weusedtheoriginalSCOREvaluesasgiveninthemodel. Sec-ond,weimplementedthemultiplierof1.5asrecommended intheEULARguidelinesforapplicablepatientsandderivedan modifiedmSCORE.4Third,astheagegroupforwhichSCORE
canbeestimatedisquitenarrowandpatientsyoungerthan 40yearsofagehaveaSCORErisklowerthanthehighestrisk inthoseaged40 years wesetthe SCOREriskto0%forall patientsyoungerthan40years.WenamedthisSCORE(0–65). Fourth,thesameappliestomSCORE,wherethemultiplierof 1.5willnotresultinanydifferencewhenthebaselineriskis
0%.Wecalledthisvariable mSCORE(0–65).Forcontrolswe usedSCOREandSCORE(0–65)inthesamewayasdescribed above.
QRISK2wasdevelopedandvalidatedinanUKpopulation usingaverylargecohortofpatients.IncontrasttoSCOREit doesnotestimatefatalCVeventsbutthe10yearriskof devel-opingCVdiseaseasdefinedbycoronaryheartdisease(angina and myocardial infarction), stroke, or transient ischaemic attacks. It is applicable for a broad range of people aged between25and84years.OneoftheuniquefeaturesofQRISK2 isthat–besidesotherriskfactors–RAisdirectlyincorporated inthealgorithmofriskprediction.Therefore,theapplication ofthemultiplierof1.5inRApatientsrecommendedbyEULAR4
isnotindicated.TheTownsenddeprivationscore,anoptional parameterinQRISK2,wasnotavailableforourpatients.5Not
allpatientswereapplicableforriskcalculationforSCOREor QRISK2.Thiswasthecaseifsomeoftherelevantparameters wereoutsidetheparticularvalidrangeoftheriskcalculator (e.g.,age,bloodpressureorlipids).Forallparticular correla-tionswegivethenumberofavailablepatients.
Statisticalmethodsandmanagementofquantitative variables
Table1–Demographicanddiseaserelated characteristicsofRApatients(n=287).
Female(n%) 232(80.8%) Age(years;mean±SD) 58.4±12.6 RAdiseaseduration(years;median,IQR) 10.5(5.0–17.6) RFpositive(n%) 218(76.0%) Extra-articularmanifestation(n%) 89(31.0%) CRP(mg/dL;median,IQR) 0.45(0.2–1.2) ESR(mm/h;median,IQR) 13(7–29)
DAS28(median,IQR) 2.54(1.85–3.82) NumberofcurrentDMARDS
0(n%) 15(5.2%)
1(n%) 159(55.40%)
2(n%) 109(38.0%)
3(n%) 4(1.4%)
DMARDs csDMARDs
Methotrexate(n%) 203(70.7%)
Sulfasalazine(n%) 19(6.6%)
Leflunomide(n%) 32(11.2%)
(Hydroxy-)chloroquine(n%) 23(8.0%) MMForazathioprine(n%) 3(1.1%) bDMARDs
TNFinhibitor(n%) 86(30.0%)
Abatacept(n%) 9(3.1%)
Rituximab(n%) 7(2.4%)
Tocilizumab(n%) 5(1.7%)
Anakinra(n%) 1(0.4%)
PreviousDMARDs(median,IQR) 2(1–4)
b, biologic; cs, conventional synthetic; CRP, C-reactive protein; DAS28, disease activity score 28; DMARD, disease modifying anti-rheumaticdrug;ESR, erythrocytesedimentationrate; MMF, mycophenolatemofetil;RA,rheumatoidarthritis;RF,rheumatoid factor.
Results
In Table 1we have summarized demographic and disease relatedcharacteristicsofRApatients.Table2givesdetailsfor CVriskfactorsaswellastheresultsofpulsewaveanalysis inRApatients and controls.AIx wassignificantly lower in menthaninwomanintheRAgroup(26.8±8.7%inmenvs 32.1±9.2%inwomen;p=0.0001)aswellasinthecontrolgroup (15.9±10.2% in menvs 25.5±10.2% inwomen; p<0.0001). Therefore,wegiveresultsofcorrelationsnotonlyforthetotal group,butalsoseparatelyforfemalesandmales.Intotal164 RApatientsfulfilledthecriteriatoallowcalculationofSCORE. AccordingtotheEULARrecommendationsthemultiplierfor CVriskof1.5wasappliedin78cases. In86 casesthe use ofthe multiplier was not appropriateand SCORE was left unchanged.Wheninparticipantsyoungerthan40yearsofage theSCORECVriskwassetto0%thesampleconsistedof189 patients(mSCORE(0–65)).283patientswereeligiblefor calcu-lationofCVriskusingQRISK2.Table3ashowsthedetailsfor thecorrelationsofAIxandtheCVriskscoresintheRAgroup. The correlation of SCORE (n=164) yielded a rho of 0.1697 (p=0.0298).AscanbeenseeninTable3aformostofthe cor-relationsofAIxwefoundstatisticallysignificantcorrelations. Formensomecorrelationswerenotstatisticallysignificant, whereby the calculations are based on a much smaller
80
60
40
20
0
80
60
40
20
0
QRISK2
0 20 40 60
AIx (%)
QRISK2
0 50 100 150
Central PP
A
B
Fig.1–ScatterplotsforthetotalRAgroup(femaleandmale patients)for(A)thecorrelationofAIxand(B)centralPP withQRISK2.Spearman’srhois0.3307(p<0.0001)forthe correlationwithAIxand0.5828(p<0.0001)forthe correlationwithcentralPP.
samplesize(Table3a).Overall,correlationsofcentralPPwith calculated CV risk tended to correlate better than those including AIx. Thiswasalsotrue forthe smallersubgroup ofmaleRApatients.Alldetailsforthecorrelationsofcentral PPandCVriskscoresintheRAgroupareshowninTable3b.
Table3canddpresentsdetailsforthecorrelationsofAIxand centralPPwithSCORE,SCORE(0–65)andQRISK2inthecontrol group(mSCOREandmSCORE(0–65)arenotapplicableinthis groups). Fig. 1 shows the scatterplots for the correlations ofAIx (Fig.1A)and central PP(Fig. 1B) withQRISK2 inRA patients.
Table2–CharacteristicsofCVriskfactorsofRApatients(n=287)andcontrols(n=232)andresultsofpulsewaveanalysis
(n=287).
RAgroup(n=287) Control-group(n=232) p-value
Female(n%) 232(80.8%) 186.(802%) 0.849
Age(years;mean±SD) 58.4±12.6 49.9±13.4 <0.0001
Antihypertensivemedication(n%) 90(31.4%) 75(32.33%) 0.814
Height(m;mean±SD) 1.65±0.08 1.67±0.08 0.013
Weight(kg;mean±SD) 71.7±15.0 72.9±17.3 0.421
BMI(kg/m2;mean±SD) 26.3±4.9 26.2±6.0 0.767
Totalcholesterol(mg/dL±SD) 214.8±45.2 193.3±48.6 0.0001
LDLcholesterol(mg/dL±SD) 127.5±39.2 113.2±37.6 0.0001
HDLcholesterol(mg/dL±SD) 65.8±19.6 52.9±18.1 <0.0001
Triglycerides(mg/dL;median,IQR) 110.0(82.0–144.0) 105.5(68.0–160.0) 0.325
Smokerstatus 0.046
Never(n%) 167(58.2%) 130(56.0%)
Former(n%) 69(24.0%) 42(18.1%)
Current(n%) 51(17.8%) 60(25.9%)
DM(n%) 21(7.3%) 69(29.7%) <0.0001
DMduration(years;median,IQR) 6.(2–10) 9.(3–15) 0.251
Statinuse(n%) 33(11.5%) 20(8.6%) 0.282
BrachialsystolicBP(mmHg±SD) 139.3±22.1 135.3±2.4 0.049
BrachialdiastolicBP(mmHg±SD) 82.7±12.0 79.8±13.7 0.012
Pulserate(bpm±SD) 71.9±11.6 72.2±12.5 0.830
AIx(%,±SD) 31.1±9.3 23.6±11.3 <0.0001
CentralsystolicBP(mmHg±SD) 130.9±21.7 124.3±23.4 0.0009
CentraldiastolicBP(mmHg±SD) 83.9±13.2 81.0±14.1 0.016
Centralpulsepressure(mmHg±SD) 47.5±16.0 43.4±14.6 0.003
SCORE(median,IQR) 2.(1–4) 1.(0–2) <0.0001
SCORE(0–65)(median,IQR) 1.(1–3) 1.(0–1) <0.0001
mSCORE(median,IQR) 2.(1–5) – –
mSCORE(0–65)(median,IQR) 1.5(1–4.5) – –
QRISK2(median,IQR) 11.9(4.3–23.6) 6.1(1.5–16.6) <0.0001
BMI,bodymassindex;DM,diabetes;HDL,highdensitylipoprotein;LDL,lowdensitylipoprotein;AIx,augmentationindex.
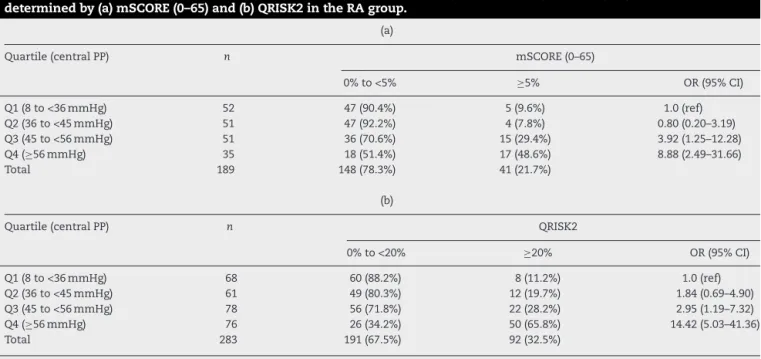
2.18(95%CI1.58–3.01)perincreaseofquartile.ThisORwas notsignificantlyalteredafteradjustmentforsex(OR2.33;95% CI1.67–3.28).Wedid notfindsuchatrend forAIxand CV risk(datanotshown).However,asimilarpicturewasfound whenweanalysedQRISK2asabinaryvariable.ForQRISK2we usedtheproposed20%thresholdtoidentifypatientswitha highCVrisk(QRISK20%to<20%andQRISK2≥20%).Again, therewasasignificanttrendofincreasingoddsforhighCV riskfromQ1toQ4ofcentralPP.ThesummaryORwas2.18 (95%CI1.75–2.72).TheORremainedstableafteradjustment forsex(OR2.20;95%CI1.75–2.75).Thesedataareshownin
Table4b.IncontrasttomSCORE,wealsofoundastatistically significanttrendforAIxquartilesandhighCVriskaccording toQRISK2(≥20%);(testfortrendofodds: p=0.0039).Inthe controlgroupweusedSCORE≥5%asthreshold(insteadof mSCORE≥5%).Wefoundasignificanttrendofincreasedodds forhighCVriskasdefinedbySCORE≥5%fromQ1toQ4of centralPP(summaryOR3.28;95%CI1.98–5.41).Again,thisOR wasnotsignificantlyalteredafteradjustmentforsex(OR3.49; 95%CI2.10–5.81).ForQRISK2≥20%andcentralPP(Q1toQ4) thesummaryORwas2.27(95%CI1.70–3.03),afteradjustment forsex2.35(95%CI1.74–3.15).Inthecontrolgroupwefounda trendforincreasingoddsofbeingintheSCORE≥5%category forAIxquartilesQ1toQ4(summaryOR1.79;95%CI1.11–2.87; adjustedforsex2.50;95%CI1.46–4.29)aswellasbeinginthe
QRISK2≥20% category(summaryOR1.42;95%CI1.07–1.90; adjustedforsex1.81;95%CI1.33–2.48).
Intheabsenceofa“goldstandard”forCVoutcomeweused thethresholdsofmSCORE(≥5%)andQRISK2(≥20%)as out-comevariableforROCcurves.IntheRAgroupAIxperformed poorly inthediscrimination ofthe mSCORE≥5%threshold (AUC0.55;95% CI0.45–0.66) and onlymarginallybetterfor theQRISK2≥20%threshold(AUC0.59;95%CI0.53–0.66). Cen-tralPPperformedmuchbetterforboth,mSCORE(AUC0.77; 95%CI0.68–0.86;testsofequalityofROCareascomparedto AIx:p=0.0009)andQRISK2(AUC0.77;95%CI0.71–0.83;testsof equalityofROCareascomparedtoAIx:p=0.0001)(Fig.2Aand B).InthecontrolgrouptheAUCforAIxpredictingSCORE≥5% was0.72(95%CI0.61–0.84)andforQRISK2≥20%0.63(95%CI 0.56–0.72).ForcentralPPthecorrespondingvalueswere0.86 (95%CI0.80–0.9)forSCORE≥5%and0.76(95%CI0.68–0.84)for QRISK2.Again,centralPPperformedbetterthanAIxinthe pre-dictionofSCORE≥5%(testsofequalityofROCareascompared toAIx:p=0.01)aswellasforQRISK≥20%(testsofequalityof ROCareascomparedtoAIx:p=0.005).
Discussion
Table3–Correlationsof(a)AIxand(b)centralPPand calculatedCVriskintheRAgroupandcorrelationsof(c) AIxand(d)centralPPandcalculatedCVriskinthe controlgroup.
Observations (n)
rho p-value
(a)CorrelationsofAIxandcalculatedCVriskintheRAgroup
SCORE–totalgroup 164 0.1697 0.0298
SCORE–female 128 0.3468 0.0001
SCORE–male 36 0.2578 0.1290
SCORE(0–65)–totalgroup 189 0.3314 <0.0001 SCORE(0–65)–female 152 0.4992 <0.0001
SCORE(0–65)–male 37 0.3170 0.0560
mSCORE–totalgroup 164 0.1812 0.0203
mSCORE–female 128 0.3740 <0.0001
mSCORE–male 36 0.2047 0.2310
mSCORE(0–65)–total group
189 0.3374 <0.0001
mSCORE(0–65)– female 152 0.5146 <0.0001
mSCORE(0–65)–male 37 0.2680 0.1088
QRISK–totalgroup 283 0.3307 <0.0001
QRISK–female 229 0.4046 <0.0001
QRISK–male 54 0.4956 0.0001
(b)CorrelationsofcentralPPandcalculatedCVriskintheRAgroup SCORE–totalgroup 164 0.3919 <0.0001
SCORE–female 128 0.4116 <0.0001
SCORE–male 36 0.5803 0.0002
SCORE(0–65)–totalgroup 189 0.4863 <0.0001 SCORE(0–65)–female 152 0.5292 <0.0001
SCORE(0–65)–male 37 0.5547 0.0004
mSCORE–totalgroup 164 0.3704 <0.0001
mSCORE–female 128 0.3949 <0.0001
mSCORE–male 36 0.5494 0.0005
mSCORE(0–65)–total group
189 0.4692 <0.0001
mSCORE(0–65)–female 152 0.5164 <0.0001
mSCORE(0–65)–male 37 0.5259 0.0008
QRISK–totalgroup 283 0.5828 <0.0001
QRISK–female 229 0.5975 <0.0001
QRISK–male 54 0.5813 <0.0001
(c)CorrelationsofAIxandcalculatedCVriskinthecontrolgroup
SCORE–totalgroup 151 0.2104 0.0095
SCORE–female 133 0.3498 <0.0001
SCORE–male 18 0.3703 0.1304
SCORE(0–65)–totalgroup 201 0.4241 <0.0001 SCORE(0–65)–female 169 0.4734 <0.0001 SCORE(0–65)–male 32 0.7071 <0.0001 QRISK–totalgroup 219 0.3919 <0.0001
QRISK–female 178 0.4695 <0.0001
QRISK–male 41 0.7568 <0.0001
(d)CorrelationsofcentralPPandcalculatedCVriskinthecontrolgroup SCORE–totalgroup 151 0.3616 <0.0001
SCORE–female 133 0.4450 <0.0001
SCORE–male 18 0.3003 0.2260
SCORE(0–65)–totalgroup 201 0.4521 <0.0001 SCORE(0–65)–female 169 0.5437 <0.0001
SCORE(0–65)–male 32 0.0401 0.8276
QRISK–totalgroup 219 0.5442 <0.0001 QRISK–femalegroup 178 0.6117 <0.0001
QRISK–malegroup 41 0.3746 0.0158
0 .25 .5 .75 1
True-positive rate (ROC)
0 .25 .5 .75 1
False-positive
Central PP
A
0 .25 .5 .75 1
True-positive rate (ROC)
0 .25 .5 .75 1
False-positive
Central PP
B
Fig.2–ROCcurvesforcentralPPascontinuousvariable and(A)mSCORE(0–65)(≥5%)and(B)QRISK2(≥20%)as
binaryoutcomevariableintheRAgroup.
Table4–WithincreasingquartileofcentralPPthereisanincreasedOR(Q1asbaseline)ofhavinghighCVriskas determinedby(a)mSCORE(0–65)and(b)QRISK2intheRAgroup.
(a)
Quartile(centralPP) n mSCORE(0–65)
0%to<5% ≥5% OR(95%CI)
Q1(8to<36mmHg) 52 47(90.4%) 5(9.6%) 1.0(ref)
Q2(36to<45mmHg) 51 47(92.2%) 4(7.8%) 0.80(0.20–3.19)
Q3(45to<56mmHg) 51 36(70.6%) 15(29.4%) 3.92(1.25–12.28)
Q4(≥56mmHg) 35 18(51.4%) 17(48.6%) 8.88(2.49–31.66)
Total 189 148(78.3%) 41(21.7%)
(b)
Quartile(centralPP) n QRISK2
0%to<20% ≥20% OR(95%CI)
Q1(8to<36mmHg) 68 60(88.2%) 8(11.2%) 1.0(ref)
Q2(36to<45mmHg) 61 49(80.3%) 12(19.7%) 1.84(0.69–4.90)
Q3(45to<56mmHg) 78 56(71.8%) 22(28.2%) 2.95(1.19–7.32)
Q4(≥56mmHg) 76 26(34.2%) 50(65.8%) 14.42(5.03–41.36)
Total 283 191(67.5%) 92(32.5%)
Testofhomogeneity:p<0.0001;testfortrendofodds:p<0.0001.
capacityinROCcurvesthanAIx.Insummary,pulsewave anal-ysisprovidesinformationoncentralhaemodynamics,which areassociatedwithestimatedCVrisk.However,asexpected “measured”(i.e.,PWA)andcalculatedCVriskdonotprovide exactlythesameinformation.Todateitisnotclearwhether thecombinationofbothtypesofriskdetermination– mea-surementofvascularfunctionandcalculation–wouldresult inabetterpredictionofCVeventsinRApatients.Uptonow itwasevenunclearwhethertheresultsobtainedbyPWAand CVriskmodelswouldcorrelateinanyway.Previousresearch indicatedthatriskpredictionmodelsingenerallackprecision ofCVriskestimationinRApatients.6Acohortstudyinwhich
CVrisk would be measured and calculated in RApatients and in which study participants would be followed over severalyears couldprobably answerthe question,whether acombination ofbothmethodswould resultinbetter risk prediction.
Previously it was demonstrated that central haemodynamic indices are independent predictors of futureCVeventsandall-causemortality.Fora10%absolute increaseofcentralAIxtherelativerisk(RR)oftotalCVevents increasesto1.318(95%CI1.093–1.588).Forall-causemortality theRRincreasesto1.384(95%CI1.192–1.606).Inaddition,for a10mmHgincreaseofcentralPPtheRRoftotalCVevents increasesto1.137(95%CI1.063–1.215).10Previouslyitcould
beshownthatAIxisincreasedinRApatientscomparedto controls.13–15 Therefore, it is very likely that the increased
CVriskfoundinRApatientsisrepresentedinparametersof central haemodynamics. As parameters of central haemo-dynamicscorrelatewithcalculatedCVrisk,but donotgive exactlythesameinformation,thequestionariseswhethera combinationofbothconceptswould resultinanimproved CVriskprediction.7
Our study has some limitations.As its design is cross-sectional we were not able to analyse CV events as an
Europeanpatients,6,24despitethefactthatitwasdevelopedin
aNorth-Americanpopulation.25QRISK2waspreviouslyused
innon-UKRApatients.6Ourprimaryendpointwasthe
asso-ciationofAIxandmSCORE(0–65).Inaddition,weperformeda numberoffurtherstatisticalanalyseswithAIxaswellas cen-tralPPanddifferentversionsofestimatedCVrisk.Itshouldbe underlinedthatthesefurthertestscannotbeconsidered con-firmatorybutratherexploratory.Thisstudywasperformed inanoutpatientclinicofatertiaryreferralcentre.Therefore, patientswithmoreseverRAormoremulti-morbidandolder patientsmaybeoverrepresentedinoursample.So,theCVrisk inoursamplecouldbehighercomparedto,forinstance,RA patientsmanagedbyoffice-basedrheumatologists.Therefore, itmightbethatourresultsarenotgeneralizabletoRApatients withlowerCVrisk.
Conclusions
WecoulddemonstratethatresultsoftwoconceptsofCVrisk determinationinRApatients–PWAandCVriskcalculators –correlatewitheachother.However,obviouslybothdonot givethesameinformation.Thisraisesthequestionwhether acombinationofbothconceptsmightresultinmoreaccurate riskpredictioninRApatients.
Conflicts
of
interest
Theauthorsdeclarenoconflictsofinterest.
r
e
f
e
r
e
n
c
e
s
1. PieringerH,PichlerM.Cardiovascularmorbidityand mortalityinpatientswithrheumatoidarthritis:vascular alterationsandpossibleclinicalimplications.QJM. 2011;104:13–26.
2. VanDoornumS,JenningsGLR,WicksIP.Reducingthe cardiovasculardiseaseburdeninrheumatoidarthritis.MedJ Aust.2006;184:287–90.
3. VanDoornumS,McCollG,WicksIP.Accelerated atherosclerosis:anextraarticularfeatureofrheumatoid arthritis?ArthritisRheum.2002;46:862–73.
4. PetersMJL,SymmonsDPM,McCareyD,DijkmansBAC,Nicola P,KvienTK,etal.Eularevidence-basedrecommendationsfor cardiovascularriskmanagementinpatientswithrheumatoid arthritisandotherformsofinflammatoryarthritis.Ann RheumDis.2010;69:325–31.
5. Hippisley-CoxJ,CouplandC,VinogradovaY,RobsonJ,Minhas R,SheikhA,etal.PredictingcardiovascularriskinEngland andWales:prospectivederivationandvalidationofQRISK2. BMJ.2008;336:1475–82.
6. ArtsEE,PopaC,DenBroederAA,SembAG,TomsT,KitasGD, etal.Performanceoffourcurrentriskalgorithmsin predictingcardiovasculareventsinpatientswithearly rheumatoidarthritis.AnnRheumDis.2015;74:668–74.
7. VlachopoulosC,XaplanterisP,AboyansV,BrodmannM, CífkováR,CosentinoF,etal.Theroleofvascularbiomarkers forprimaryandsecondaryprevention.Apositionpaperfrom theEuropeanSocietyofCardiologyWorkingGroupon peripheralcirculation.EndorsedbytheAssociationfor ResearchintoArterialStructureandPhysiology(ARTERY). Atherosclerosis.2015;241:507–32.
8.MackenzieIS,WilkinsonIB,CockcroftJR.Assessmentof arterialstiffnessinclinicalpractice.QJM.2002;95: 67–74.
9.WeberT,O’RourkeMF,LassnigE,PorodkoM,AmmerM, RammerM,etal.Pulsewaveformcharacteristicspredict cardiovasculareventsandmortalityinpatientsundergoing coronaryangiography.JHypertens.2010;28:797–805.
10.VlachopoulosC,AznaouridisK,O’RourkeMF,SafarME,Baou K,StefanadisC.Predictionofcardiovasculareventsand all-causemortalitywithcentralhaemodynamics:a systematicreviewandmeta-analysis.EurHeartJ. 2010;31:1865–71.
11.LaurentS,CockcroftJ,VanBortelL,BoutouyrieP,Giannattasio C,HayozD,etal.Expertconsensusdocumentonarterial stiffness:methodologicalissuesandclinicalapplications.Eur HeartJ.2006;27:2588–605.
12.WilkinsonIB,CockcroftJR,McEnieryCM.Aorticstiffnessasa cardiovascularriskpredictor.BMJ.2015;351:h3764.
13.PieringerH,SchumacherS,StubyU,BiesenbachG,
Augmentationindexandlarge-arteryremodelinginpatients withlongstandingrheumatoidarthritiscomparedwith healthycontrols.SeminArthritisRheum.2009;39: 163–9.
14.AmbrosinoP,TassoM,LupoliR,DiMinnoA,BaldassarreD, TremoliE,etal.Non-invasiveassessmentofarterialstiffness inpatientswithrheumatoidarthritis:asystematicreview andmeta-analysisofliteraturestudies.AnnMed.2015;47: 457–67.
15.PieringerH,BrummaierT,SchmidM,PichlerM,
Hayat-KhayyatiA,EbnerS,etal.Rheumatoidarthritisisan independentriskfactorforanincreasedaugmentationindex regardlessofthecoexistenceoftraditionalcardiovascular riskfactors.SeminArthritisRheum.2012;42:17–22.
16.ArnettFC,EdworthySM,BlochDA,McShaneDJ,FriesJF, CooperNS,etal.TheAmericanRheumatismAssociation 1987revisedcriteriafortheclassificationofrheumatoid arthritis.ArthritisRheum.1988;31:315–24.
17.ÖsterreichischeDiabetesGesellschaft.Diabetesmellitus– LeitlinienfürdiePraxis.WienKlinWochenschr.2009;121 Suppl.:S1–87.
18.PrevooML,van’tHofMA,KuperHH,vanLeeuwenMA,vande PutteLB,vanRielPL.Modifieddiseaseactivityscoresthat includetwenty-eight-jointcounts.Developmentand validationinaprospectivelongitudinalstudyofpatientswith rheumatoidarthritis.ArthritisRheum.1995;38:44–8.
19.ChenCH,NevoE,FeticsB,PakPH,YinFC,MaughanWL,etal. Estimationofcentralaorticpressurewaveformby
mathematicaltransformationofradialtonometrypressure. Validationofgeneralizedtransferfunction.Circulation. 1997;95:1827–36.
20.PaucaAL,O’RourkeMF,KonND.Prospectiveevaluationofa methodforestimatingascendingaorticpressurefromthe radialarterypressurewaveform.Hypertension.2001;38: 932–7.
21.WilkinsonIB,MacCallumH,FlintL,CockcroftJR,NewbyDE, WebbDJ.Theinfluenceofheartrateonaugmentationindex andcentralarterialpressureinhumans.JPhysiol.2000;525Pt 1:263–70.
22.PerkJ,DeBackerG,GohlkeH,GrahamI,ReinerZ,Verschuren M,etal.EuropeanGuidelinesoncardiovasculardisease preventioninclinicalpractice(version2012).TheFifthJoint TaskForceoftheEuropeanSocietyofCardiologyandOther SocietiesonCardiovascularDiseasePreventioninClinical Practice(constitutedbyrepresentativesofninesocietiesand byinvitedexperts).EurHeartJ.2012;33:1635–701.
23.ConroyR.Estimationoften-yearriskoffatalcardiovascular diseaseinEurope:theScoreproject.EurHeartJ.
24.HaqIU,RamsayLE,YeoWW,JacksonPR,WallisEJ.Isthe FraminghamriskfunctionvalidfornorthernEuropean populations?Acomparisonofmethodsforestimating absolutecoronaryriskinhighriskmen.Heart.1999;81:40–6.