Abstract Abstract Abstract
Abstract—— In——InInIn this work, we investigatethis work, we investigatethis work, we investigatethis work, we investigate thethe utilization of thetheutilization of utilization of utilization of transmission powertransmission powertransmission power control as transmission powercontrol as control as control as mechanism to increase the
mechanism to increase the mechanism to increase the
mechanism to increase the energy efficiency in energy efficiency in energy efficiency in energy efficiency in optical optical optical optical code division multiplexing code division multiplexing code division multiplexing code division multiplexing access (OCDMA)
access (OCDMA) access (OCDMA)
access (OCDMA) networks.networks.networks. We have modeled the energy efficiency considering the networks. We have modeled the energy efficiency considering the We have modeled the energy efficiency considering the We have modeled the energy efficiency considering the optical fiber
optical fiber optical fiber
optical fiber transtranstransmission and networktransmission and networkmission and networkmission and network infrastructureinfrastructureinfrastructureinfrastructure as as encoders, decodersas as encoders, decodersencoders, decodersencoders, decoders andandand star and star star star coupler
coupler coupler
coupler. . . . In the In the In the In the analyzed scenarioanalyzed scenarioanalyzed scenario, tanalyzed scenario, t, t, this model confirms that the energy consumption of his model confirms that the energy consumption of his model confirms that the energy consumption of his model confirms that the energy consumption of the network infrastructure is larger than the energy consumption of the transmission the network infrastructure is larger than the energy consumption of the transmission the network infrastructure is larger than the energy consumption of the transmission the network infrastructure is larger than the energy consumption of the transmission infrastructure
infrastructure infrastructure
infrastructure;;;; On On On On the the the the other hand, we have proposed a scheme to define the energy other hand, we have proposed a scheme to define the energy other hand, we have proposed a scheme to define the energy other hand, we have proposed a scheme to define the energy efficiency according
efficiency according efficiency according
efficiency according to to to to the BER levelthe BER levelthe BER levelthe BER level accomplished accomplished accomplished with accomplished with with with the quality of service (QoS) the quality of service (QoS) the quality of service (QoS) the quality of service (QoS) requirements
requirements requirements
requirements. . The main results showed that . . The main results showed that The main results showed that The main results showed that it it it it is possible to is possible to saveis possible to is possible to savesavesave 70% of 70% of 70% of 70% of the the the the transmitted
transmitted transmitted
transmitted energy per bit withenergy per bit withenergy per bit withenergy per bit with the penalty ofthe penalty ofthe penalty ofthe penalty of one order of magnitude of BER.one order of magnitude of BER.one order of magnitude of BER.one order of magnitude of BER.
Index Terms Index Terms Index Terms
Index Terms——— optical code division multiplexing access, distributed power control — algorithm.
I. INTRODUCTION
The informatics and telecommunications industries have become a component of the economies from the nations. The growing of Internet, information and communications technology (ICT) infrastructures have been showing an exponential behavior and the electrical power consume has increasing in the same way. However, the energy resources available in the world are limited and the energy efficiency in all sort of industry has been encouraged. The energy efficiency in the ICT is represented by the energy consumption per bit of data transported and/or processed [1][2]. Nowadays, the ICT sector is responsible for approximately 5 % of the total electrical power consumption in developed national economies and especially the Internet consumes 1 % of this total electrical power consumption [1]. Recent studies have showed the importance of the consideration of energy consumption in optical communications design, considering the transmission infrastructure (transmitters, receivers, fibers and amplifiers) [3] and network infrastructure (switchers and routers) [4] aspects. In a global scale network, the energy consumption of the switching infrastructure is larger than the energy consumption of the transport infrastructure [2][4]. In this context, it is necessary to improve the energy efficiency of switching and to optimize the network design to reduce the quantity of switching and overheads. Low energy efficiency is observed mainly at access network, because the access equipment consumes almost 50% of energy consumed in
Increasing Energy Efficiency in OCDMA
Network via Distributed Power Control
Fábio R. Durand, Bruno A. Angélico,
Universidade Tecnológica Federal do Paraná, [email protected], [email protected]
Taufik Abrão
the core or metro equipment [3]. However, the amount of bits transported in core or metro network is larger than in the access network.
OpticalDcodeDdivision multiple access (OCDMA) based networks [5] have attracted a lot of interests due to various advantages including asynchronous operation, high network flexibility, protocol transparency, simplified network control and potentially enhanced security [5–9]. In OCDMA each different code defines a user and different codeDusers can share a common channel. In a common channel, the interference that may arise between different codeDusers is known as multiple access interference (MAI) and can limit the number of codeDusers utilizing the channel simultaneously. OCDMA can be divided into nonDcoherent (unipolar) and coherent (bipolar) systems. The nonDcoherent systems are based only on intensity modulation of optical power [7], and coherent systems are based on modulation of amplitude and phase [8]. The coherent code is trueDorthogonal and nonDcoherent code is pseudoDorthogonal. As a consequence, the performance of coherent codes is higher than nonD coherent codes when analyzing the signalDtoDinterference plus noise ratio (SINR) [8]. However, the main drawback of coherent OCDMA lies in the technical implementation difficulties, concomitant with the utilization of phaseDshifted optical signals [6D8]. The nonDcoherent codes can be classified in one dimensional (1DD) and two dimensional (2DD) codes. In 1DD codes, the bits are subdivided temporally into many short chips with a designated chip pattern representing a user’s code. On the other hand, in 2DD codes the bits are subdivided into individual time chips, and each chip is assigned to an independent wavelength from a discrete set of wavelengths [9]. The 2DD codes have better performance than 1DD codes and can significantly enhance the number of active and potential users [9]. In the OCDMA, the nearD far ratio increases the multiple access interference effects, because each active node in transmission mode contributes with MAI and the power penalty varies dynamically. Therefore, the static power budget design does not solve this problem [10][11]. Furthermore, if the distances between the nodes are quite different, as would be the case in practice, the power received from different nodes will be significantly different. Thus, considering as reference one OCDMA node, the performance of closer nodes is many orders of magnitude better than that of far nodes.
Hence, an efficient power control is needed to overcome this problem and to enhance the performance and throughput of the optical network [12]. This could be achieved via signalDtoD interference (SINR) optimization [12][13]. In this case, analogous to a wireless CDMA cellular system, the power control, centralized or distributed, is one of the most important issues since it has a significant impact on both performance and capacity; it is the most effective way to avoid the nearDfar problem and to increase capacity. Previously, this problem has been investigated in OCDMA networks to solve the nearDfar problem [10] and to obtain quality of service (QoS) at physical layer [11]; however this issue has not been investigated with focus on the energy efficiency.
power control in order to increase the energy efficiency of the OCDMA network and to determine the best tradeoff between the energy efficiency and nearDfar mitigation.
This paper is organized as following: Section II describes the architecture of the network for 2DD codes. Section III discusses the proposed methodology for increasing OCDMA energy
efficiency. The performance of proposed methodology systems is developed in Section IV.
Section V shows representative numerical results for the proposed approach; finally, in Section VI the main conclusions are presented.
II. NETWORK ARCHITECTURE
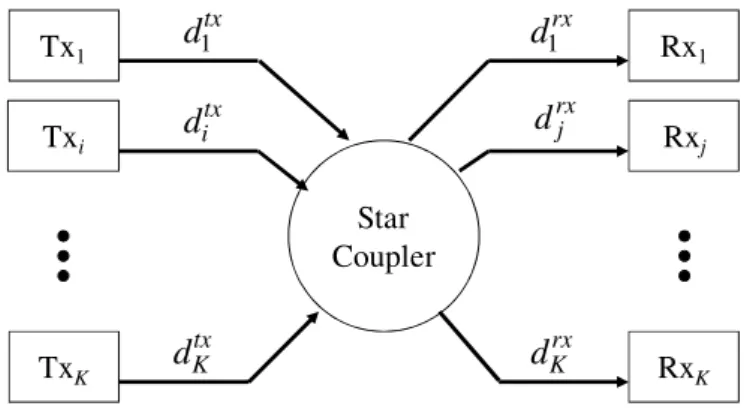
The OCDMA architecture considered in this work is formed by K nodes interconnected by passive star coupler, in a broadcastDandDselect pattern as shows Fig. 1. For viability characteristics, we consider network equipment, such as codeDprocessing devices (encoders and decoders at the transmitter and receiver) and star coupler. Such devices could be made using robust, lightweight, and lowDcost technology platforms with commercialDoffDtheDshelf technologies [14], [15].
Fig. 1. OCDMA network architecture.
The transmitting and receiving nodes create virtual path based on the code and the total
link length is given by rx
j tx i ij d d
d = + , where ditx is the link length from the transmitting node
to the star coupler and rx
j
d is the link length from the receiving node to the star coupler. The
received power at a jDth node is given by
P
rj=
a
starp
iexp
(
−
α
fd
ij)
, where pi is the transmitted power by iDth transmitter node, αf is the fiber attenuation (kmD1) and astar is the star couplerattenuation (linear units). Considering deciBell units,astar =10log
( )
K −[
10log2( )
K log10δ]
,where, δ is the excess loss ratio.
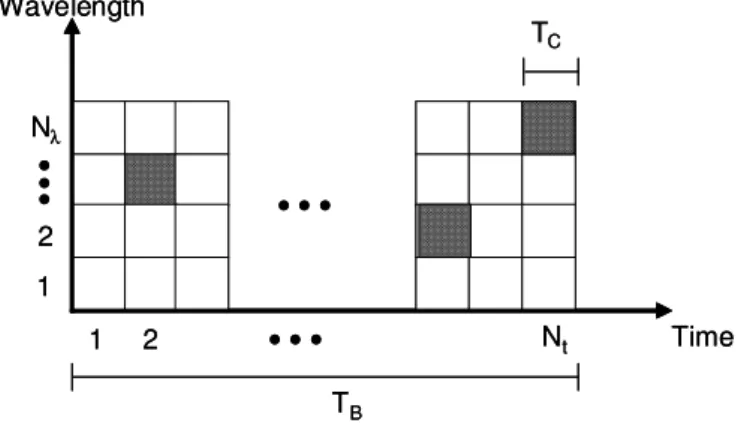
The 2DD wavelengthDhopping/ timeDspreading code sequence is illustrated in Fig. 2. This 2DD code is transmitted and its destiny in the network is determined by a particular code
sequence. The 2DD codes can be represented by Nλ× NT matrices, where Nλ is the number of
rows, that is equal to the number of available wavelengths, and NT is the number of columns,
that is equal to the code length. The code length is determined by the bit period TB which is
subdivided in small units called chips, each of duration Tc = TB/ NT. In each code, there are w short pulses of different wavelength, where w is called the weight of the code. An (Nλ ×NT, w,
Ia, Ic) code is the collection of binary Nλ × NT matrices each of code weight w; Ia and Ic are Star
Coupler
Tx1
TxK
Rx1
RxK
tx
d
1d
1rxtx K
d
d
KrxTxi
tx i
d
Rxj
rx j
nonnegative integers and represent the constraints on the autocorrelation and crossD correlation [8], respectively.
Fig. 2. Schematic of 2D wavelengthDhopping time spreading code sequence.
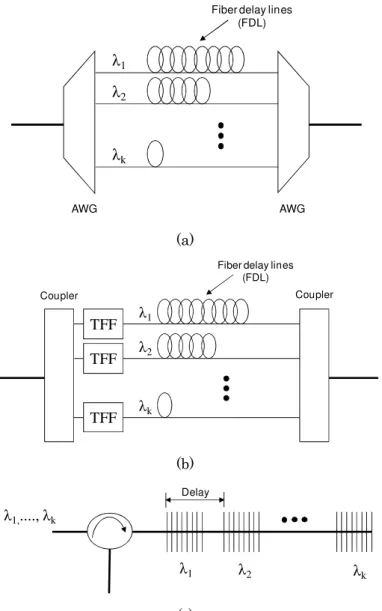
The 2DD OCDMA utilizes multiDwavelength sources such lightDemitting diodes, amplified spontaneous emission noise from erbiumDdoped fiber amplifier (EDFA), gain switched Fabry– Pérot lasers, and supercontinuum generation [15]. These sources avoid the need for rapidly wavelength hop according the wavelengthDhopping pattern. The encoder essentially creates a combination of two patterns: a wavelengthDhopping pattern and a timeDspreading pattern. The common technology applied in encoders/decoders with delay lines are array waveguide gratings (AWGs), thinDfilm filters (TFFs), simultaneously as fiber Bragg gratings (FBGs), holographic Bragg reflectors (HBRs), chirped Moire gratings (CMGs) [16][17]. The schemes of encoders commonly utilized are based on AWG, TFF and FBGs, as are showed in Fig. 3.
The losses associated with the encoders/ decoders are given by [15][16][17]
Delay AWG
AWG
dB
a
a
C
(
)
=
2
+
(1.a)( )
TFF DelayTFF
dB
N
a
a
C
(
)
=
6
log
2 λ+
+
(1.b)Cirulator Bragg
Bragg
dB
N
a
a
C
(
)
=
λ+
(1.c)where aAWG is the AWG loss, aDelay is the delay line loss, aTFF is the TFF loss, aBragg is the
FBG loss and aCirulator
is the circulator loss. The loss usual value for these equipments are
AWG
a = 2.5 dB, aDelay = 1dB, aTFF = 0.5 dB, aBragg = 0.5 dB and aCirulator = 3dB. The AWG
encoder has approximately uniform loss (6 dB) independently of the number of wavelengths
(Nλ) [16]. For this characteristic, we will consider the AWG as encoder/decoder in the rest of
this work.
1 2 • • • Nt 1
2 • • • Nλ Wavelength
TB
TC
Time • • •
1 2 • • • Nt 1
2 • • • Nλ Wavelength
TB
TC
(a)
(b)
(c)
Fig. 3. Schematic of 2DD encoders and decoders (a) Array waveguide gratings (AWGs), (b) ThinD
film filters (TFFs), and (c) fiber Bragg grating (FBG).
III. THEORETICAL ANALYSIS
a. Energy efficiency and power allocation
The necessary energy in each iDth node for the transmission of 1 bit can be expressed as [3],
[
]
i i bit
E
=
p T
J bit
, i = 1,.., K (2)where K is the number of nodes, Tbit is the time to transmit one bit over the network given by
Tbit=1/R, where R is the bit rate (bits/seconds) and pi is the transmitted power. In order to determine the energy per bit values it is necessary to define the individual node transmitting power (pi). The pi is obtained by power budget or power control and it is associated to a QoS, a SINR and a maximum bit error rate (BER) tolerated by the optical nodes. Under a power control situation, each optical node adjusts its transmitting power in an attempt to maximize the number of transmitted bits with minimum energy consumption. This concept can be formulated by the energy efficiency definition [18],
λ
1λ
2λ
kFiber delay lines (FDL)
AWG AWG
λ1
λ2
λk
Fiber delay lines (FDL)
TFF
TFF
TFF
Coupler Coupler
λ
1,...., λk
λ
1 λ2 λk
( )
i i i p f M L Rγ
ε
= , i = 1,.., K (3)where M is the number of bits in each transmitted packet, L is the number of information bits
contained in each data packet andf
( )
γ
i is the efficiency function, which approximates theprobability of errorDfree packet reception. It can be approximated by f
( ) (
γ
i = 1−BERi)
M, withγi being the SINR for the iDth node, given by [14][18],
ii i i i i
g p
I
N
γ
∝
+
, i = 1,.., K (4)where gij are the total loss in the path that connects iDthDTx node to jDthDRx node, Ii is the total interference power level comes from the others transmitters nodes and Ni is the receiver power noise level. Both terms
I
i+
N
i will be described in details in the next subsection, eq. (8). In the same way this concept is used to define a metric named utility that is the number of bits received per energy expended or the relation of the throughput and power dissipation[18]. Hence, for each iDth node, the maximum number of transmitted bits occurs at power level
for which the partial derivative of εi with respect to pi equals to zero, ∂
ε
i ∂pi =0. So, the derivative of energy efficiency can be obtained referring to efficiency function f( )
γ
i and eq. (4), setting:( )
( )
2 i i i ii i i
f
R L
f
p
p M
γ
ε
γ
γ
γ
∂
∂
=
−
∂
∂
, i = 1,.., K (5)From (5) assuming pi > 0, the necessary condition to maximize the energy efficiency is immediately obtained:
( )
( )
0
=
−
∂
∂
i i i if
f
γ
γ
γ
γ
, i = 1,.., K (6)So, adopting the widely accepted approximation for BER performance with uncoding system
(M=L) and binary modulation, the bit error rate can be approximated as i
i
BER
=
e
−γ . Hence,we have:
( )
i(
1
i)
ii i
f
e
γe
γγ
γ
γ
− −
∂
∂
=
−
=
∂
∂
. As a result, we can conjecture that the optimumpower allocation criterion in terms of energy efficiency is given by
(
1
)
i i M
i i
i
ii
I
N
p
e
e
g
γ γ
κ
+
−= ⋅
⋅
⋅ −
, i = 1,.., K (7.a)where
κ
is a constant of proportionality. Besides, further simplification can be obtained if thecondition M=1 could beassumed:
(
i1
)
i ii ii
I
N
p
e
g
γκ
+
= ⋅
− ⋅
, i = 1,.., K (7.b)b. Proposed scheme
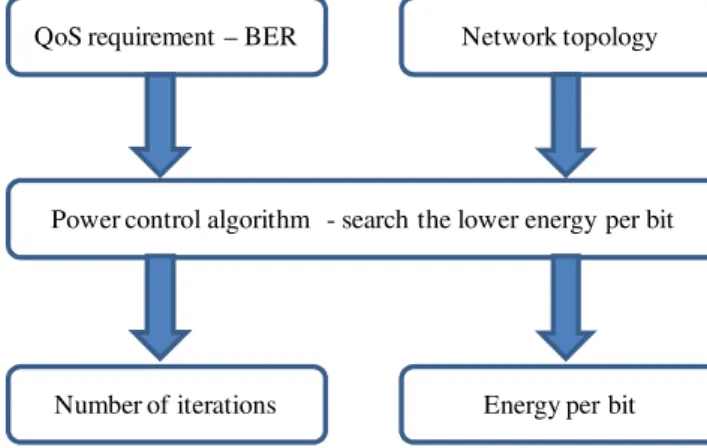
network QoS requirements. Fig. 4 shows the flowchart with the adopted scheme to assign the energy per bit transmitted in each node. This scheme aims to save energy per bit at each node and, as a consequence, decreases the total energy consumption overall the network.
Fig. 4. Flowchart with the proposed scheme to save energy per bit.
This scheme is based on the power control with the restriction of QoS requirement based on BER level. The entries are the BER level and the network topology, comprising the following parameters: node distances, links lengths, fiber parameters, EDFA preamplifiers value, OCDMA code parameters, and so forth.
The iterative power control algorithm defines the transmitted power according to the number of active transmitting nodes aiming to establish individual target value of BER, and taking into account as low level energy per bit as possible. The outputs of the scheme are the necessary number of iterations of the iterative power control algorithm and the optimized value of energy per bit necessary for each node. In the next subsections we will illustrate BER computation, the main characteristics of the power control procedure, as well as the way to apply the power control in order to obtain a more energy efficient OCDMA network.
IV. PERFORMANCE EVALUATION
a. SignalDtoDinterference plus noise ratio (SINR) and Bit error rate (BER)
In [11], Inaty et al. derive an expression for optical SINR in a multirate chipDsynchronous 2DDOCDMA system. Assuming singleDrate case, the SINR for the iDth node of a 2DD code OCDMA system can be precisely written as:
∑
≠ =
+ =
K i j j
N j ij amp
amp i ii T i
P p g G
G p g N
, 1 2
2
2
σ
γ
, i = 1,.., K(8)
where gij and Gampare, respectively, the total loss and gain of the preamplifier in the path that connects iDthDTx node to jDthDRx node. σ2 is the average variance of the Hamming aperiodic
crossDcorrelation amplitude [8], PN is the spontaneous amplified emission (ASE) noise power in the preamplifier considering the two polarization mode presented in a single mode fiber
QoS requirement – BER Network topology
Power control algorithm - search the lower energy per bit
and pj is the other nodes transmitted power. Note that the usual receiver noise power includes thermal noise, shot noise and optical preamplifier noise. However, ASE in the optical preamplifier will be the main limiting factor (in addition to the MAI), compared to thermal and shot noise at the receiver [10]. In our work, the receiver noise power is represented by
(
)
o SPN
n
hf
G
B
P
=
−
1
(9)where nspis the spontaneous emission factor, typically around 2 to5, h is Planck’s constant, f is the carrier frequency, G is the amplifier gain and Bo is the optical bandwidth. Ideally, in
order to reduce the ASE noise power, the optical bandwidth can be set to a minimum of Bo=
2R. Assuming Gaussian noise approximation, the BER associated with the iDth node is related
to its SINR by Pb i, =erfc
(
γ
i 2)
, where erfc(.) is the complementary error function.b. Power control
The power budget analysis establishes the transmitted power necessary to reach the photodiode sensibility. The power budget in dB must satisfy the follow inequality,
[dB]
s i amp Enc f ij star Dec MAI
p
≤
p
+
G
−
C
−
α
d
−
a
−
C
−
N
, i 1,.., K (10)where ps is the receiver power sensibility, NMAI is the MAI interference variance, CEncis the encoder losses and CDec is the decoder losses. The losses associated with the encoders/
decoders are given by (1).
We observe in (10) the static characteristics of the power budget design, mainly because the MAI varies with the number of active nodes transmitting simultaneously. The design based on static power budget results in a transmitting power higher or lower than the necessary;;;; as a result, an increase in the nearDfar problem occurs. To solve this problem, it is adequate to apply dynamic power control that defines the transmitting power according the number of active transmitting nodes.
The power control in optical networks is an optimization problem aiming to establish individual target value of SINR, denoted by
γ
i*;;;; hence, each node unit transmitting with power pi, has to be controlled in order to satisfy the relationγ
i ≥γ
i*. The maximum achievable SINR at the receiving nodes is equal to the maximum achievable carrier to interference ratio (CIR) at the receiver output times NT2/σ2. Denoting Γi as the CIR at the required decoder input, inorder to get a certain QoS which is associated to a maximum tolerable BER at the iDth optical
node, and defining the KDdimensional column vector of the transmitted optical power pppp = [p1,
p2,…… pK]T , then the optical power control optimization problem consists in finding the optical power vector pppp* that minimizes the following cost function [19]:
( )
Ki 1
T
i
J
p
=
=
=
∑
p
1 p
(11)* , 1 2 Γ ≥ + = Γ
∑
≠ = K i j j N j ij amp amp i ii i P p g G G p g maxmin p P
P ≤ i ≤ ∀i = 1,.., K
(12)
where 1111T = [1, ..., 1] and Γ*is the minimum CIR to achieve a desired QoS. The elements gij
that represent the connections of transmitterDreceiver pairs constitute the network attenuation matrix:
11 12 1
21 22 2
1 2
K K
K K KK
g
g
g
g
g
g
g
g
g
=
G
(13)Using matrix notations, (12) can be written as,
*
− Γ
≥
Ι
H p
u
(14)where IIII is a KDdimension identity matrix, HHHH is the normalized interference matrix, whose elements can be evaluated by
0,
,
,
,
ij ij iii
j
g
h
i
j
g
=
=
≠
(15)and the ith element of vector uuu is given by: u
ij amp N i g G P u * Γ = (16)
Note that in (15) we have a scaled version of the noise power. Solving (14), substituting inequality by equality, we get the optimized power vector solution through matrix inversion:
1
*
*
−=
− Γ
p
Ι
H
u
(17)This optical power vector represents the case of power equilibrium at the receiver node, and is the optimal power required achieving the target CIR. Increasing the value of the CIR would result in higher optical power values that could result in a maximum power higher than the allowed. In this case, a solution would be fixing or decreasing the target CIR value or removing (switching off) some users from the network. The centralized power control is obtained by matrix inversion, as illustrated in (17), and corresponds to an existence of a central node. The central node storages information about all physical network architecture like fiber length between nodes, amplifier position, regular updating about transmission establishment and dynamic of the optical traffic. These characteristics are the drawback of centralized control [10][19]. On the other hand, the distributed power control algorithm (DPCA) synthesis consists of the development of a systematic procedure for the vector p p p p
evolution in order to reach the optimum value, * * −1
= − Γ
p Ι H u based on the
γ
i*,γ
iand pi[
]
[ ]
[ ]
n p[ ]
n np n
p i
i i i
i
− − = +
γ γ α
*
1
1 , i = 1,.., K (18)
where n is the number of iterations and α is the convergence. Note that the convergence factor
α in (18) is the numerical integration step to solve an ordinary differential equation, which with some minor alterations is also considered in many other studies of power control [10][14][19]. The algorithm represented by eq. (18) was evaluated for positive and no greater than 1 value of α, since it was shown in [19] that the algorithm divergence outside this interval. This parameter is responsible for the convergence speed: values close to 1 indicate fast convergence; however, the quality of the solution after convergence is not excellent when compared with values close to 0 [14]. There are more details about several aspects that we do not discuss here, such as, convergence, proximity to the optimum value, and sensibility to estimation errors as well, that are discussed in details in [14].
Observing the scalar equations in (18) we can infer that the transmitted power actualization of each node depends only on its own parameters. This apparent uncoupling among nodes follows from the fact that we are estimating the SINR directly and not calculating it from the equation (8). It is obvious that for obtaining the SINR from (8) it would demand an expensive procedure in order to estimate all channel gains (interferers and desired user), imposing a centralized implementation of the DPCA, and finally increasing the algorithm implementation complexity. So, we must avoid this approach. However, the recursion in eq. (18) can be effectively implemented in each (iDth) optical node because all necessary parameters (i.e.,
α
i,the QoS level given by *
i
γ
, and the transmitted powerp n
i[ ]
), except γi[ ]
n , can be consideredknown at the iDth node. Under the distributed power control approach, the SINR γi
[ ]
n isobtained at the correspondent destination optical node that demodulates the signal from the optical user iDth. In this way, the destination optical node estimatesγi
[ ]
n , quantizes it in aconvenient number of bits, and transmits this information to the optical user iDth through a return channel. Indeed, it is possible to measure γi
[ ]
n without the effective knowledge of theinformation from all the optical interferer nodes, only sensing the iDth optical signal for a period of time at the destination optical node, following by a sensing of all (sum) interferer signals (in the absence of iDth transmitted signal) in a second period of time. In summary, (18) depends only on local parameters allowing the power control to work in a distributed manner, i.e., each one of the K links would be able to carry out separately the respective power control procedure. This brief explanation justifies the name distributed power control algorithm (DPCA) for the set of recursions implicit in (18).
To cope with the SINR optimization, the minimum power constraint (which is also called sensitivity level) assures detection of the optical signal by all optical devices. On the other hand, the maximum power constraint guarantees the minimization of nonlinear physical impairments, because it makes the aggregated power on a link to be limited to a maximum value.
The convergence characteristics of the transmitted power given by DPCA present an
asymptotic behavior
( )
∞ →
=
n
p n
p *
lim for any strictly positive initial condition (p
i > 0) [19].
power, and then an increase in the number of iterations results in the convergence for the transmitting energy [18].
V. NUMERICAL RESULTS
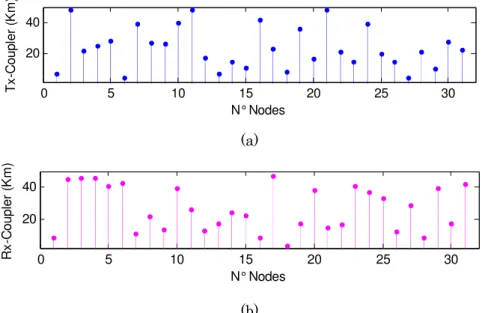
The scenario considered in our study was presented in Fig. 1. The adopted distances between Tx nodes and star coupler are shown in Fig. 5.a, while distances between Rx nodes and star coupler considering 31 nodes are presented in Fig. 5.b. The nodes are uniformly distributed over an area with a radius between 2 km and 50 km; hence, the range of the total link length is within [4; 100] km. We consider the transmission of an OCDMA signal over a nonzeroD
dispersionDshifted (NZD) fiber (ITUDT G.655) with attenuation αf = 0.2 dB/km and nonDlinear
parameter Γ= 2 (W.km)D1 utilizing AWG encoders/decoders. Applying typical parameters
values: nSP= 2, h = 6.63× 10⁻³⁴ J/Hz, f = 193.1THz, G = 20 dB, Bo= 30 GHz, immediately we
obtain ASE power noise = 15 × 10−7 A2. The transmission rate considered is 2.5 Gbps, SINR
target
γ
i*= 27 dB for 2DD codes (4 × 101, 4, 1, 0).(a)
(b)
Fig. 5. a) Distance between Tx nodes and star coupler; b) Distance between Rx nodes and star coupler.
Fig. 6.a and 6.b present the energy per bit assignment per node for OCDMA system considering only the transmission infrastructure (transmitters, receivers, fibers and amplifiers) and transmission plus network infrastructure (encoders, decoders and switchers), respectively.
(a)
0 5 10 15 20 25 30
20 40
N° Nodes
T
x
-C
o
u
p
le
r
(K
m
)
N° Nodes
0 5 10 15 20 25 30
20 40
N° Nodes
R
x
-C
o
u
p
le
r
(K
m
)
0 5 10 15 20 25 30
0 0.5 1
x 10-3
N° Nodes
E
b
it
(
p
J
(b)
Fig. 6. Energy per bit assignment per node: a) Transmission infrastructure; b) Transmission plus network infrastructure.
As one can observe from Fig. 6.a and 6.b, there is a considerable difference between the values of energy per bit per node considering only the transmission infrastructure and considering the overall system, i.e. aggregating losses and multiple access interference in transmission plus network. Indeed, in accordance with [3], [4], our numerical results show the lower energy per bit necessary for the transmission system even we do not use optically amplified links and our system adopt only EDFA preamplifier. The losses due to the OCDMA encoder/decoder, as well as the loss introduced by the star coupler, have been resulted in a substantial difference of three orders of magnitude in the energy per bit regards to other conventional OCDMA systems with same parameters considered herein. This result is confirmed by static power budget considering losses of 6 dB for encoder, 6 dB for decoder and 14 dB for star coupler. These numerical results for the energy per bit were obtained applying the centralized control strategy, i.e. solving (17) by matrix inversion. However, the drawback of centralized control is the necessity of central node with parameters knowledge of the physical network architecture.
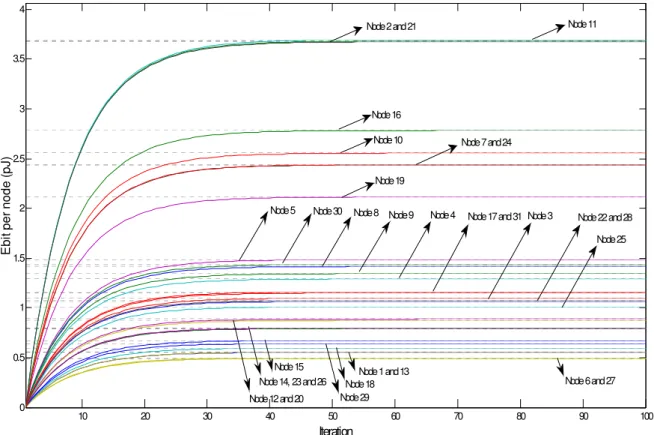
Fig. 7 shows the energy per bit per node as a function of the number of iterations for the classical iterative DPCA [19] with α =0.8, considering the same scenario (transmission and
network infrastructure) presented in Fig. 5. This adopted value for the convergence velocity factor allows to combine a relative fast convergence velocity with acceptable quality of the solution after 40D50 iterations [13][14]. A decrease of 75% in the number of iterations required
to convergence was observed in [13] when the value of α increase from 0.2 to 0.8. Indeed, from
Fig. 7, one can see when iteration evolving, the energy per bit per node of the DPCA approaches the values calculated by centralized control strategy, eq. (7), represented by horizontal dot lines. Furthermore, we observe an increase in the energy per bit per node with the number of iterations and this characteristic could be utilized to control the energy efficiency. In our proposed scheme, the number of iterations is the parameter in which the transmitted energy per bit per node can be controlled according to the SINR penalty. However, the SINR penalty affects the BER and could result in an unrealistic OCDMA system. This issue is directly or indirectly considered in Figs. 8 and 9.
0 5 10 15 20 25 30
0 2 4
N° Nodes
E
b
it
(
p
J
Fig. 7. Convergence behavior in terms of energy per bit per node versus the number of iterations for the classical DPCA, considering the same scenario from Fig. 5, andα =0.8.
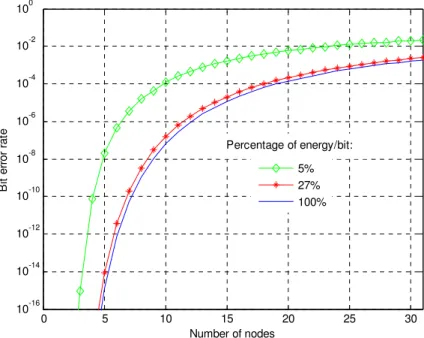
Fig. 8 shows the BER performance as a function of the number of active optical nodes for a code weight of 4 and a code length of 101, applying the proposed distributed DPCA scheme. The scenario is the same adopted in Fig. 5 with α = 0.8. The BER system with DPCA considering different percentage of energy per bit of 5%, 27% and 100% is obtained; these percentages are obtained with, 3, 12 and 60 iterations, respectively. Note that in this scenario, 100% energy per bit is achieved after 60 iterations (total DPCA convergence), in a similar way showed in Figure 7.
10 20 30 40 50 60 70 80 90 100
0 0.5 1 1.5 2 2.5 3 3.5 4
Iteration
E
b
it
p
e
r
n
o
d
e
(
p
J
)
Node 11
Node 16
Node 10
Node 19
Node 7 and 24 Node 2 and 21
Node 5 Node 30 Node 8 Node 9 Node 4 Node 17 and 31Node 3
Node 22 and 28
Node 25
Node 12 and 20
Node 6 and 27 Node 18
Node 1 and 13 Node 14, 23 and 26
Node 15
Fig. 8. BER against active nodes for the code weight of 4 and code length of 101 applying the proposed scheme with DPCA power control with percentage of energy per bit of 5%, 27% and
100% , obtained with 3, 12 and 60 iterations, respectively.
It can be seen from Fig. 8 the impact of power control procedure (in terms of transmitting energy per bit) on the bit error rate performance. The deployment of DPCA with transmission of 100% of energy per bit approaches the BER considering the ideal system [10], i.e. equal distance for all nodes. Indeed, with lower energy per bit (5%), the SINR declines because the MAI and nearDfar effects are strongly influenced by an increase in the number of active nodes. Under this situation, an error occurs when crossDcorrelational pulses from the (K – 1) interfering reaches a level higher than the autocorrelation peak, changing a bit zero to a bit one. As a consequence, under the nonDoptimized SINR, the bits are more vulnerable to distortion, which reduces the likelihood of their successful reception. It is worth mentioning that with the utilization of only 27 % of the maximal energy per bit, the BER performance
approaches the result with 100% of energy per bit. Besides, the errorDfree limit (BER=10D9) is
exceeded when more than 4 or 8 nodes are actives with 5% or 100% of the energy per bit, respectively.
On the other hand, a forward error correction (FEC) limit of 10D5 is exceeded when more than
8 or 14 optical nodes become actives with 5% or 100% of the energy per bit, respectively. However, the FEC scheme presents high energy consumption of 250 pJ/b with low energy efficiency, so that it is difficult to perform at high bit rates [20]. In this context, further studies including FEC schemes are necessary in order to evaluate the global energy efficiency impact on the OCDMA system.
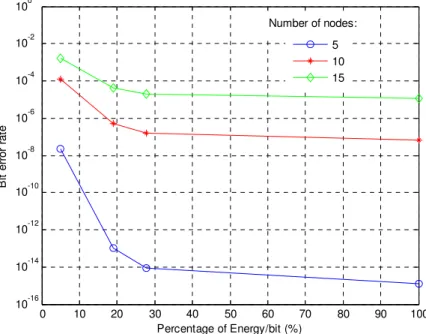
Fig. 9 presents the BER performance against the percentage of transmitting energy per bit for the same scenario adopted in Fig. 8. We show the BER with DPCA power control for the number of active nodes of 5, 10 and 15. As expected, the low percentage of energy per bit results in a high BER, mainly for higher number of active nodes. Furthermore, one can control
0 5 10 15 20 25 30
10-16 10-14 10-12 10-10 10-8 10-6 10-4 10-2 100
Number of nodes
B
it
e
rr
o
r
ra
te
the optical BER level performance, according the system requirement, by adjusting the percentage of energy per bit transmitted. Thus, there is a tradeDoff between transmitting
energy and BER. For example, with 5 active nodes it is possible to obtain a BER level of 10D9
with 9% of the energy per, which results in 91% of reduction in the energy consumption when compared with a system without any energy control mechanism. Furthermore, the general behavior of this figure suggests that it is possible to save up to 70% of energy per bit transmitted with the penalty of one order of magnitude of BER.
Fig. 9. BER versus percentage of energy per bit for the proposed DPCA with the number of active nodes of 5, 10 and 15.
VI. CONCLUSIONS
In this work we have investigated the utilization of distributed power control algorithm (DPCA) as mechanism to increase the energy efficiency in OCDMA access network with nonD coherent 2DD codes. In our proposed scheme, based on the classical DPCA, we have modeled the energy efficiency considering optical fiber transmission and network infrastructure as encoders, decoders and star coupler. This model confirms that the energy consumption of the network infrastructure is larger than the energy consumption of the transmission infrastructure for our numerical example. In the proposed scheme it is possible to obtain the energy efficiency according to the level of BER and the quality of service (QoS) requirements. The obtained results have shown economy of 70% in the transmitted energy per bit, at the penalty of one order of magnitude of BER.
In the proposed scheme it was possible to define the energy efficiency according to the BER level accomplished the quality of service (QoS) requirements.
APPENDIX
The derivation of (18) is obtained considering that the optimum solution for the power allocation problem satisfies the following set of equations [21]:
0 10 20 30 40 50 60 70 80 90 100 10-16
10-14 10-12 10-10 10-8 10-6 10-4 10-2 100
Percentage of Energy/bit (%)
B
it
e
rr
o
r
ra
te
∑
≠ + = K i j i j ij i h pp* *
η
, i = 1,.., K(A.1)
where = ∗ ⁄ . Now, if z (x) is an arbitrary odd function that has null value only at
origin, equation (A.1) is the only equilibrium point of the following continuousDtime dynamical system [19][21]: + + − =
∑
≠ • K i j i j ij ii z p h p
p η , i = 1,.., K (A.2)
This control scheme is general and constitutes a systematic form to describe the dynamical behavior of various DPCAs. The sigmoidal [21], the Foschini [19], and recently the Verhulst [14] algorithm can be seen as particular structures of the general form. In the interval t to t +
αi, the secant line to the curve pi(t) is indistinguishable from the tangent line in t for small values of αiif pi(t) is a continuous curve. In this case, we can write the approximation:
(
)
( )
( )
( )
+ + − + ≈ +∑
≠ K i j i j ij i i i i ii t p t z p t h p t
p α α η (A.3)
for αi > 0, i = 1, ...,K, which is the wellDknown Euler integration method. From the above exposition, the sequence pi[n] = pi(nαi), can be recursively obtained by:
[
]
[ ]
[ ]
[ ]
+ + − + = +∑
≠ K i j i j ij i i i i ii n p n z p n h p n
p α α η (A.4)
for i = 1, ...,K. From definitions in (8) and (14) results:
i i i K i j i j ij
i h p p
p
− − = + + −
∑
≠γ
γ
η
* 1i = 1,.., K (A.5)
The DPCA developed by Foschini and Miljanic [19] and illustrated by (18), can be stated defining: zi
( )
x =x, αi = α, i = 1, ...,K.REFERENCES
[1] K. Hinton, J. Baliga, M. Z. Feng, R.W.A. Ayre and R. S. Tucker, “Power consumption and energy efficiency in the internet”. IEEE Network, vol. 25, no. 2, pp. 6–12, March/April 2011.
[2] S. Yoo, “Energy Efficiency in the Future Internet: the Role of Optical Packet Switching and Optical Label Switching”, IEEE J Selected Topics in Quantum Electronics, vol. 17, no. 2, pp. 406 – 418, MarchDApril 2011.
[3] Rodney S. Tucker, "Green Optical Communications D Part I: Energy Limitations in Transport", IEEE J Selected Topics in Quantum Electronics, vol. 17, no. 2, pp. 245 – 260, MarchDApril 2011.
[4] Rodney S. Tucker, "Green Optical Communications D Part II: Energy Limitations in Networks", IEEE J Selected Topics in Quantum Electronics, vol. 17, no. 2, pp. 261 – 274, MarchDApril 2011.
[5] A. Stok and E. H. Sargent, “Lighting the local area: Optical codedivision multipleDaccess and quality of service provisioning,” IEEE Network, vol. 14, no. 6, pp. 42–46, Nov./Dec. 2000.
[7] K. Fouli and M. Maier, “Ocdma and optical coding: Principles, applications, and challenges,” IEEE Communications Magazine, vol. 45, no. 8, pp. 27–34, August 2007.
[8] H. Yin and D. J. Richardson, Optical code division multiple access communication networks: theory and applications. Berlin: SpringerDVerlag and Tsinghua University Press, 2009.
[9] F R. Durand, L. Galdino, L. H. Bonani, F. R. Barbosa, M. L. F. Abbade and Edson Moschim, “The Effects of Polarization Mode Dispersion on 2D WavelengthDHopping Time Spreading Code Routed Networks”, Photonics Network Communications, vol. 20, no. 1, pp. 27 – 32, Aug. 2010. DOI 10.1007/s11107D010D 0242D6.
[10] N. Tarhuni, T. Korhonen, M. Elmusrati and E. Mutafungwa, “Power Control of Optical CDMA Star Networks”, Optics Communications, vol. 259, pp. 655 – 664, Mar. 2006.
[11] E. Inaty, H. Shalaby, P. Fortie, and L. Rusch, Multirate “Optical Fast Frequency Hopping CDMA System Using Power Control”, Journal of Lightwave Tech., vol. 20, n. 2, pp.166 – 177, March 2003.
[12] F. R. Durand and T. Abrão, “Distributed SNIR Optimization Based on the Verhulst Model in Optical Code Path Routed Networks With Physical Constraints”, Journal of Optical Communications and Networking, vol. 3, no. 9, pp. 683–691, Sep. 2011. doi:10.1364/JOCN.3.000683
[13] F. R. Durand, M. S. Filho and T. Abrão, “The effects of power control on the optical CDMA random access protocol”, Optical Switching and Networking, (In press) doi:10.1016/j.osn.2011.06.002
[14] T. J. Gross, T. Abrão and P. J. E. Jeszensky. “Distributed power control algorithm for multiple access systems based on Verhulst model”. AEU DD International Journal of Electronics and Communications. vol. 65, n.4, April 2011, pp. 361D372.
[15] Y. Huang, V. Baby, I. Glesk, C. Bres, C. Greiner, D. Iazikov, T. Mossberg, and P. Prucnal, “Novel multicodeDprocessing platform for wavelengthDhopping timeDspreading optical cdma: A path to device miniaturization and enhanced network functionality,” IEEE Journal of Selected Topics in Quantum Electronics, vol. 13, no. 5, pp. 1471–1479, Sept./Oct. 2007.
[16] C. Brès and P. Prucnal, “CodeDempowered lightwave networks,” Journal of Lightwave Technology, vol. 25, no. 10, pp. 2911–2921, Oct. 2007.
[17] K. O. Hill and G. Meltz, “Fiber bragg grating technology fundamentals and overview”, Journal of Lightwave Technology, vol. 15, no. 8, pp. 1263–1276, Aug. 1997.
[18] D. Goodman and Narayan Mandayan “Power control for wireless data”, IEEE Personal Communications, vol. 7, no. 2, pp. 48 – 54, April 2000.
[19] G. Foschini and Z. Miljanic, “A simple distributed autonomous power control algorithm and its convergence”, IEEE Trans. Veh. Technol., vol. 42, n. 4, pp. 641D646, Nov. 1993.
[20] Core Optics UltraDFEC Chip. (2010). [Online]. Available: http://www.coreoptics.com/