Brazilian Microwave and Optoelectronics Society-SBMO received 11 May 2017; for review 13 May 2017; accepted 24 July 2017 Brazilian Society of Electromagnetism-SBMag © 2017 SBMO/SBMag ISSN 2179-1074
Abstract— Maintenance of oil pipelines is an issue of great concern for oil companies. Soil contamination is caused by oil leaks from underground pipelines. Ground penetrating radar (GPR) is a rapid and relatively inexpensive technique used for locating and characterizing soil contaminated sites without producing fractures and causing further migration of contaminants. One of the most critical hardware components for the performance of GPR is the antenna system. The present paper reports on the design and simulation of a pyramidal horn antenna operating at L-band frequencies (1- 2 GHz) to detect soil contamination. A prototype model of the GPR system setup is developed to simulate the electromagnetic fields in different soil types. The dielectric permittivity of soil, needed in order to carry out simulations during the design process, is measured and analytically represented by Debye relaxation model. The contrast in the dielectric permittivity between contaminated and uncontaminated soils is the most important parameter to be considered for detecting the presence of contamination. The application of GPR is proved to be well-versed in the investigation of soil contamination.
Index Terms—soil contamination detection, ground penetrating radar, permittivity measurement, pyramidal horn antenna design
I. INTRODUCTION
Soil contamination is caused by underground pipeline rusting or leaking. Leaks and spills from the
pipelines are a potential concern. If the pipelines are not appropriately maintained leaks may occur to
the surrounding environment which, in turn, could contaminate the surrounding soil. The major
causes of leaking of underground piping systems are cracking, drilling, and corrosion [1].
Contamination may spread over large areas and sometimes it is hard to locate. Different techniques
are developed for detecting oil leakage from underground pipelines [2]. Leak detection using invasive
techniques require drilling, soil sampling, and laboratory testing. These methods can promote further
spread of contaminants in polluted areas. On the contrary, non-invasive techniques are relatively
simple, inexpensive, and provide a rapid characterization of contamination without creating cracks.
Ground Penetrating Radar (GPR) is a non-destructive tool for non-invasive investigation [3]. GPR
is a geophysical technique that can be used to investigate and map the dielectric properties of the
subsurface [4]-[5]. It is based on measuring the electromagnetic pulses that being transmitted into the
Design of Ground Penetrating Radar Antenna
for Detecting Soil Contamination at L-band
Frequencies
Ahmad H. Abdelgwad, Tarek M. Said
Brazilian Microwave and Optoelectronics Society-SBMO received 11 May 2017; for review 13 May 2017; accepted 24 July 2017 Brazilian Society of Electromagnetism-SBMag © 2017 SBMO/SBMag ISSN 2179-1074
medium and then being collected by the receiver. Both of the transmitter and receiver are being placed
in the antenna [6]. The success of GPR in detecting soil contamination depends on the contrast of
electrical properties of both the clean and contaminated soil [7]. Consequently, direct measurement of
the dielectric properties of the contaminated zone is effective in the assessment of detecting soil
contamination [8]-[9].
Ground-penetrating radar antennas are usually located either near to or in contact with the soil
surface. Therefore, the performance of GPR antenna system, such as operational frequency,
transmitted power and antenna beamwidth, is directly depending on soil properties. The optimal
antenna design must provide steady performance for different soil types and weather conditions. Dry
soils are favorable for the GPR application, since higher radio-frequencies can be used for a given
depth of investigation [10]. The capability of radar antenna in detecting the contaminant depends on
both the required depth of penetration and the frequency of the antenna used [11]. The operating
frequency of the GPR system is a trade-off. Low frequencies give better penetration yet low
resolution so that soil contamination may not be detected. Contamination may be better detected
utilizing higher frequencies yet the depth of penetration may be limited to only a couple of
centimeters particularly in moist soil.
The present paper is organized as follows. In “Prototype model and dielectric modeling” section, a prototype soil model is introduced to investigate the effectiveness of GPR technology in detecting soil
contamination. The situation incorporates a plastic tube installed in soil and filled with lubricant oil.
Two scenarios are studied, the first is where the soil beneath the pipe is dry sand, and the second one
is where the soil beneath the pipe is contaminated with oil due to pipe leaks. On the basis of such a
description, two identical wideband pyramidal horn antennas that operate at L-band frequencies are then designed in “GPR antenna design” section to exhibit that microwave sensing is precisely able to discriminate between contaminated and clean soils. “Conclusions” section summarizes our work.
II. PROTOTYPE MODEL AND DIELECTRIC MODELING
The primary objective of this work is to research the potential of using GPR technology in detecting
soil contamination caused by leakage that may occur in oil pipelines. To achieve this objective, a
prototype model is precisely designed and simulated. The prototype model is essentially consist of a
wooden box loaded with sand where a plastic pipe contains oil is incorporated in soil medium. Figure
1-(a) illustrates the geometry of the designed model and the optimized dimensions, searched for best
performance, are listed in Table I. The prototype model for the situation outlined in Fig. 1 needs a
dielectric modeling of mediums of interest. Propagation of microwaves in the soil medium is dictated
by its dielectric permittivity.Accurate detection of the pollutants in the soil medium can be obtained
Brazilian Microwave and Optoelectronics Society-SBMO received 11 May 2017; for review 13 May 2017; accepted 24 July 2017 Brazilian Society of Electromagnetism-SBMag © 2017 SBMO/SBMag ISSN 2179-1074
(a) (b)
Fig.1 Soil contamination detection prototype model
TABLE I.OPTIMIZED DIMENSIONS OF MODEL
Parameter value (cm)
wooden box length 150
wooden box width 100
wooden box height 100
antenna height from ground surface (H) 10
antenna spacing (S) 50
pipe burial depth (D) 40
pipe diameter (d) 10
antenna tilting from vertical 22º
The GPR used is homodyne where the detection is performed by extracting information encoded as
modulation of the phase and/or frequency of the oscillating signal, by comparing that signal with a
standard oscillation that would be identical to the signal if it carried null information. The utilized
frequency modulated homodyne detection signifies a single frequency, in contrast to the dual
frequencies employed in heterodyne detection. The radar pulses are used to image the subsurface.
This nondestructive method uses electromagnetic radiation in the L- band of the radio spectrum, and
detects the reflected signals from subsurface structures as shown in Fig. 1-(b).
Different techniques can be used for the measurement of the dielectric permittivity of materials in
the microwave range. These techniques include transmission line systems (free-space, coaxial and
waveguide), cavity and impedance techniques [13]. To measure the complex dielectric permittivity of
soil samples, we have used the Dielectric Assessment Kit (DAK). DAK system performs simple,
precise, and convenient dielectric measurements in the microwave frequency range. The experimental
setup of DAK measurement system is shown in Fig. 2. DAK setup consists of a Vector Network
Brazilian Microwave and Optoelectronics Society-SBMO received 11 May 2017; for review 13 May 2017; accepted 24 July 2017 Brazilian Society of Electromagnetism-SBMag © 2017 SBMO/SBMag ISSN 2179-1074
probe face and a reference sample of known permittivity. The end of a coaxial line probe is then
placed in contact with the soil sample and connected to the VNA to measure the complex reflection
coefficient at the probe end. The soil medium surrounding the probe tip should be smooth and
homogenous in order to eliminate phase distortions due to cable movements. The measured reflection
coefficient is then converted to the complex permittivity of the sample under the test using DAK
Software. The sample volume should be large enough and homogeneous enough to avoid any reflections from the sample’s boundary which could influence the measurements.
Fig. 2. DAK measurement system setup
Using the DAK system at room temperature, the complex dielectric permittivity of both clean and
contaminated sandy soil samples is measured as a function of frequency. The measured complex
permittivity of soil samples is then fitted to the Debye relaxation model [14]-[15]:
ia"
f
f
i
s
+
1
-+
=
0
(1)where εs is the static permittivity, ε∞ is an extrapolated high frequency permittivity, fo is the relaxation
frequency, i is the complex number symbol i = √-1, and a'' is an estimated imaginary part
representing the sand losses. A curve fitting routine is implemented using MATLAB software to
search for the most appropriate values of fitting Debye relaxation parameters. The searching
algorithm is based on the least square method. The objective of data fitting is to determine the values
of the Debye relaxation model that almost match the measured data. The best Debye fitting
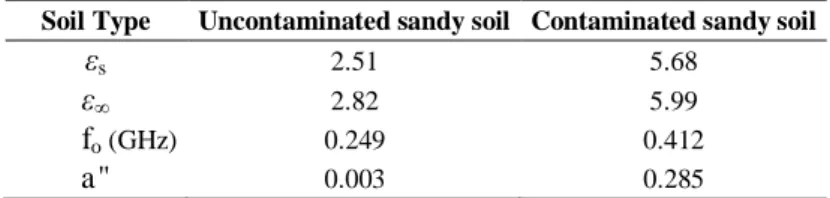
parameters are listed in Table II for all measured soil samples. Relaxation models have been widely
used by researchers to extrapolate the measured permittivity to higher frequencies. With a n
appropriate choice of model parameter, relaxation model could be used to predict the dielectric
Brazilian Microwave and Optoelectronics Society-SBMO received 11 May 2017; for review 13 May 2017; accepted 24 July 2017 Brazilian Society of Electromagnetism-SBMag © 2017 SBMO/SBMag ISSN 2179-1074
TABLE II.DEBYE PARAMETERS OF TWO DIFFERENT SANDY SOILS
Soil Type Uncontaminated sandy soil Contaminated sandy soil
s 2.51 5.68
∞ 2.82 5.99
fo (GHz) 0.249 0.412
a" 0.003 0.285
At microwave frequencies the value of the dielectric permittivity of a natural dry soil sample is
related to its physical component. As a consequence of adding lubricant oil to the sandy soil sample,
oil will infiltrate deeply into soil replacing air in pore spaces of the soil sample. The soil
characteristics become more similar to characteristics of the lubricant oil hence its chemical and
physical properties will alter causing the adjustments in its dielectric permittivity. The experimentally
measured values and fitted data of the dielectric constant and the dielectric loss are shown in Fig. 3 for
both clean and oil soil contaminated samples. The measurements indicate a noticeable increment in
both dielectric constant and dielectric loss factor due to the existence of the lubricant oil. This contrast
in dielectric properties will in turn reflect on the Debye model parameters.
(a) (b)
Fig. 3. Measured and curve-fitted permittivity of sandy soil versus frequency before and after contamination (a) dielectric constant (b) dielectric loss factor
Clearly, the amount of change in the dielectric properties of contaminated soil samples looks to be
significant. In this way, ground penetrating radar (GPR) could be able to sense the contrast between
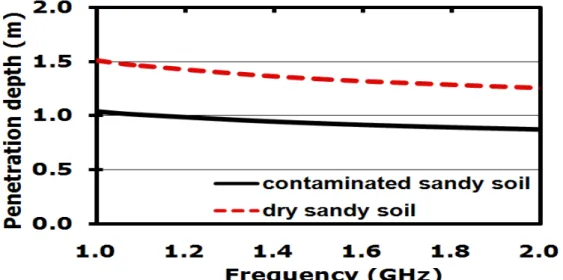
reflected signals of both clean and contaminated soils. GPR equipment requires sufficient signal penetration. The penetration depth is the reciprocal of the absorption coefficient α of the medium (α
= 2k0n'', where k0 is the vacuum wave number and n'' is the imaginary part of the medium refractive
index n = √ ). Using equation (1), is computed and plotted over the L-band frequencies as shown in Fig. 4. We can notice that due to the increase of dielectric loss in the contaminated soil samples, the
Brazilian Microwave and Optoelectronics Society-SBMO received 11 May 2017; for review 13 May 2017; accepted 24 July 2017 Brazilian Society of Electromagnetism-SBMag © 2017 SBMO/SBMag ISSN 2179-1074
Fig. 4. Penetration depth of clean and contaminated sandy soils
III. GPR HORN ANTENNA DESIGN
The effective element of any GPR system is the antenna. In order to obtain deep penetration and
fine resolution, the GPR antenna should have certain features like high directivity and efficiency,
wide bandwidth, and proper impedance matching [16]. The horn antenna is the most useful form of
antenna for use with microwave applications because of their advantages. Horn antennas are simple,
inexpensive to be manufactured, and they are very easy to interface to waveguide. They also have
excellent gain and directivity hence they are the best choice for many GPR applications. Horn
antenna is applied in the proposed GPR model due to its good directivity, high gain, low side and
back lobes, simple to feed, and high power-handling capabilities. The rectangular horns are
preferably suitable for rectangular waveguide feeders. The horn facilities a gradual transition of the
electromagnetic wave from the waveguide to the free-space.
For GPR antennas, the higher the frequency the less the signal is able to penetrate into the medium.
However, higher frequency will provide better image resolution. Selecting the optimum GPR
frequency is always a trade-off. Here, L-band frequencies are the most appropriate band to obtain the
optimum results for the proposed model. A pyramidal horn antenna operating at L-band is designed
using Computer Simulation Technology (CST) software program for the soil contamination detection
model. The material used for designing the pyramidal horn and the waveguide is assumed to be
perfect electric conductor (PEC) with thickness of 2 mm. This guarantees that the microwaves
transmitted in the waveguide is appropriately reflected and surface current on the waveguide does not
Brazilian Microwave and Optoelectronics Society-SBMO received 11 May 2017; for review 13 May 2017; accepted 24 July 2017 Brazilian Society of Electromagnetism-SBMag © 2017 SBMO/SBMag ISSN 2179-1074
Fig. 5. Geometry of the proposed GPR horn antenna
TABLE III.OPTIMIZED DIMENSIONS OF HORN ANTENNA
Antenna dimension Unit (cm)
Aperture width, A 41 Aperture height, B 30 Antenna length, C 80 Waveguide length, D 20 Waveguide height, E 12 Waveguide width, G 24
Figure 5 depicts the structure of the proposed pyramidal horn antenna. The antenna is associated
with a coaxial adapter which provides match between the waveguide and a 50 ohm coaxial to be
connected to the vector network analyzer (VNA) where the power flow can be in either direction. The
overall optimized dimensions of the designed antenna, obtained utilizing pyramidal horn antennas
dimensions mathematical relationships in [17], are organized in Table III.
Fig. 6. Return loss of designed antenna at L-Band
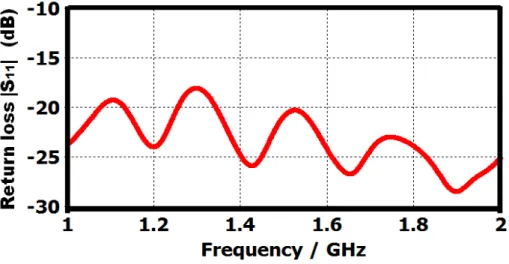
Figure 6 represents the simulated return loss, ǀS11ǀ, of the designed GPR horn antenna. Figure 6
indicates that the designed horn antenna is operating at L-band frequencies with return loss lower than
-17 dB. The obtained results confirm that most of the power will radiate in the free space. The polar
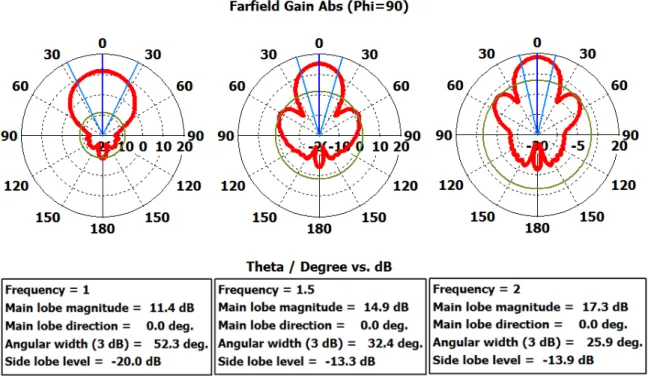
farfield radiation pattern of the designed antenna is shown in Fig. 7 at 1, 1.5, and 2 GHz. The
waveguide simulations indicate that the mode type is TE with wave impedance of 415.84 ohms. The
cut off frequency is 0.635 GHz and Beta is 28.48 [1/m]. Table IV indicates the gain, beamwidth and
Brazilian Microwave and Optoelectronics Society-SBMO received 11 May 2017; for review 13 May 2017; accepted 24 July 2017 Brazilian Society of Electromagnetism-SBMag © 2017 SBMO/SBMag ISSN 2179-1074
Fig. 7. Radiation pattern of the designed antenna at 1, 1.5 and 2 GHz
TABLE IV.FARFIELD RADIATION PARAMETERS OVER L-BAND
Frequency (GHz)
Main lobe Gain
(dB)
3-dB Beamwidth
(degrees)
Side lobes Level
(dB)
1.0 11.4 52.3 -20.0
1.1 12.2 47.4 -22.0
1.2 13.1 42.9 -19.5
1.3 13.8 36.4 -13.3
1.4 14.4 37.4 -17.9
1.5 14.9 32.4 -13.3
1.6 15.4 33.1 -17.3
1.7 15.9 29.1 -12.8
1.8 16.4 29.2 -15.5
1.9 16.7 26.9 -12.8
2.0 17.3 25.9 -13.9
Interestingly, the designed horn antenna provides directive radiation pattern with gain up to 11.4 dB,
14.9 dB, and 17.3 dB at 1 GHz, 1.5 GHz, and 2 GHz respectively; this high gain helps the microwave
signals to penetrate the soil deeper beneath the ground surface. Furthermore, the very low side lobe
level and the narrow beam width of the antenna diminish the coupling between the transmitting and
Brazilian Microwave and Optoelectronics Society-SBMO received 11 May 2017; for review 13 May 2017; accepted 24 July 2017 Brazilian Society of Electromagnetism-SBMag © 2017 SBMO/SBMag ISSN 2179-1074
IV. RESULTS AND DISCUSSIONS
GPR system utilizes microwave signals to collect subsurface information by detecting the reflected
signals of subsurface structures. The receiving antenna detects variations in the reflected return signal
when the radiated wave strikes buried objects with different dielectric constants. The prototype
landmine detection model illustrated in Fig. 1-(a) is realistically implemented using the CST
Microwave Studio to ascertain the behaviour of the materials of interest. The antenna structures are
modeled using 8.4 x 10⁶ mesh-cells with a grid resolution of 40 steps per wavelength, which ensured
the convergence properties of the fields. The simulation is performed with -40 dB accuracy to provide
very precise simulation results.
There are three GPR radar architectures which are mono-static, bi-static and multi-static
architectures. In a mono-static architecture, a single antenna is used to transmit and to receive
microwave signals. In bi-static architecture, two separated antennas are required for both transmission
and reception. In multi-static radar system, the transmitting signal is accomplished by a single
antenna, and multiple receiving antennas are used for the receiving of signals. In the current study,
bi-static radar system is introduced. One of the most important issues that should be controlled in the
bi-static radar architecture is the direct coupling between the transmitting and receiving antennas.
In order to accomplish the best performance, the direct coupling ought to be minimized to
increase the ability of the GPR to discriminate between the reflected signals of the buried object.
The direct coupling could be controlled by the antennas spacing (S) and tilting (orientation). With
the increase of antenna spacing, the direct coupling decreases. However, the received reflected
signal of the buried object likewise becomes weaker and vice versa. The optimized antenna
spacing is found to be 50 cm at which the direct coupling is minimized and in meanwhile the
received reflected signals of the buried object is significantly notable. Figure 8 depicts the direct
coupling between the transmitting and receiving antennas over L-band.
Brazilian Microwave and Optoelectronics Society-SBMO received 11 May 2017; for review 13 May 2017; accepted 24 July 2017 Brazilian Society of Electromagnetism-SBMag © 2017 SBMO/SBMag ISSN 2179-1074
The capability of the GPR system to detect soil contamination can be measured by the change of the electromagnetic coupling, ǀS21ǀ, between the transmitting and receiving antennas due to the presence
of contamination. The coupling coefficient, ǀS21ǀ, is simulated at L-band frequencies. A simulation
setup is realistically implemented in the CST Microwave Studio. Two models are presented; the first
one is where oil is placed inside the pipe as portrayed in Fig. 1-(a) and surrounded by dry sandy soil
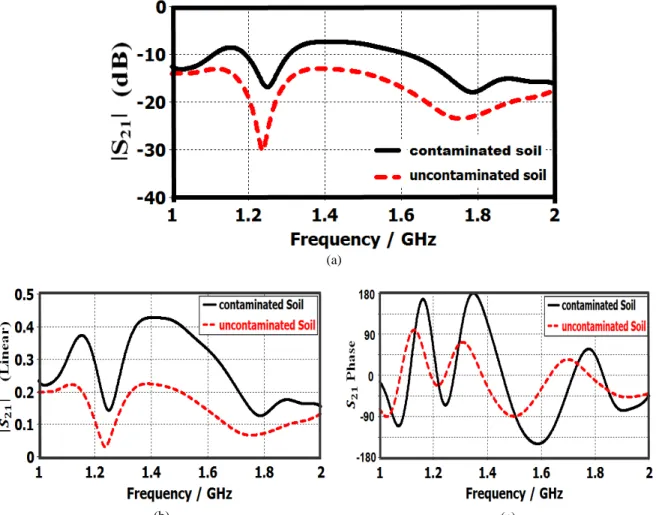
while the second one is where the layer of sand underneath the pipe is contaminated due to oil leak. The coupling coefficient, ǀS21ǀ, for both models is compared in Fig. 9 with the dimensions
introduced in Table I. We see that two resonance dips are lower than –12 dB over entire frequency
range, which implies that impedance matching bandwidth of the antenna is achieved only at these
dips. The results show a significant increase in the coupling coefficient of contaminated soil model
compared to uncontaminated soil model. It is additionally observed that for both models, the coupling
coefficient decrease with the increase of frequency due to the increase of attenuation of soil with the
increment of frequency. Also, three different cases are investigated: the increase of moisture content
of soil, the depth at which the pipe is buried, and the change of spacing between the transmitter and
receiver antennas.
(a)
(b) (c)
Fig. 9. Simulated coupling coefficient S21 for contaminated and uncontaminated dry sandy soils (a) magnitude in dB (b)
Brazilian Microwave and Optoelectronics Society-SBMO received 11 May 2017; for review 13 May 2017; accepted 24 July 2017 Brazilian Society of Electromagnetism-SBMag © 2017 SBMO/SBMag ISSN 2179-1074
A. Effect of soil moisture
The penetration depth of GPR system in soil medium being profiled depends on the operating
frequency band as well as the soil conductivity. Applications which require deeper penetration in soil
medium requires a lower frequency. Conversely, soil with high electrical conductivity will have lower
penetration depth. Highly conductive soil will absorb the energy faster than a lower conductive soil.
Moist soil is more conductive than dry sandy soil as it contains high water content, so penetration is
only a couple of centimeters. As a result, dry sandy soils are considered to be highly suited to GPR
antennas with low frequency than moist soils. It is anticipated, from the previous sub-section, that a
significant contrast exists in the reflected signal of both contaminated and uncontaminated sandy soil.
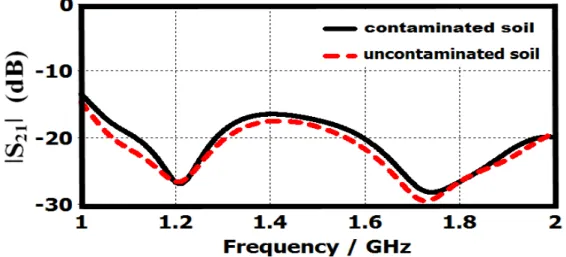
By replacing the dry sandy soil with moist sandy soil with dielectric constant of 13 and dielectric loss
tangent of 0.29 [18], we notice that this contrast becomes insignificant as shown in Fig. 10. Presumably, It can be seen that ǀS21ǀ of moist soil is more reduced than that of dry soil since moist soil
has high electric conductivity which increases the attenuation. The results clarify, as expected, that oil
contaminants are effectively detected in sandy soils, yet detection becomes infeasible in wet soils
which is confirmed by all previous studies [19, 20].
Fig. 10. Simulated ǀS21ǀ coefficient for contaminated and uncontaminated moist sandy soils
B. Effect of pipe burial depth
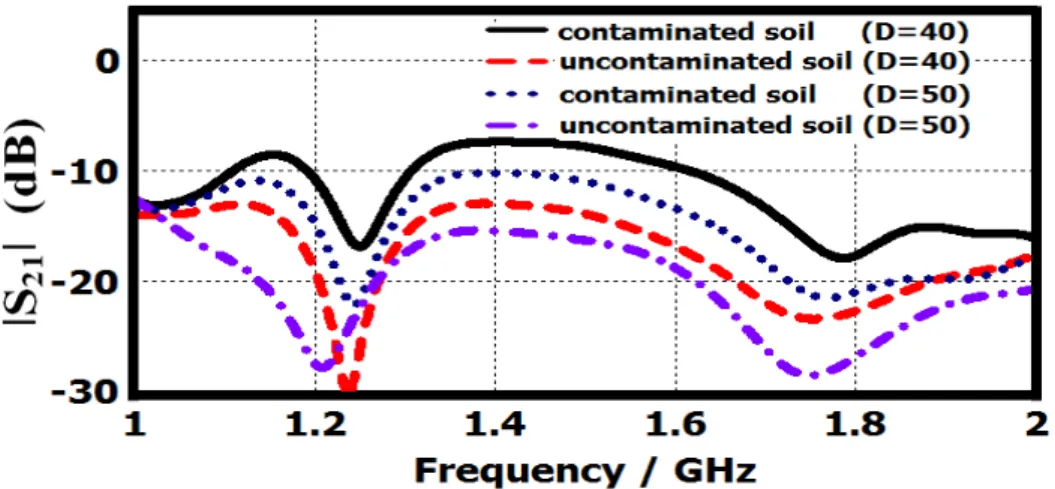
Figure 11 demonstrates the consequence of increasing the depth (D) at which the pipe is buried from 40cm to 50cm on the coupling coefficient, ǀS21ǀ, while as all other dimensions organized in Table
I are used. The results indicate that while the pipe burial depth increases, the coupling coefficient ǀS21ǀ
show a slightly decrease for both contaminated and uncontaminated soil. As the antenna to ground
spacing increases, the antenna radiation pattern results in reduction of the received signal from the
contaminated soil layer. This indicates that if the contaminated area is near to the surface of the
ground, it becomes easier to be detected. The contaminated area most likely decreases the
backscattered power by a considerable amount due to the increased attenuation. Hence, it is more
Brazilian Microwave and Optoelectronics Society-SBMO received 11 May 2017; for review 13 May 2017; accepted 24 July 2017 Brazilian Society of Electromagnetism-SBMag © 2017 SBMO/SBMag ISSN 2179-1074
Fig. 11. Simulated ǀS21ǀ coefficient for contaminated and uncontaminated dry sandy soils plotted for different pipe burial
depth
C. Effect of antenna spacing
The determination of spacing between the transmitting and receiving antennas (S) and the tilting
(orientation) of the antennas are very critical as they control the direct coupling between the
transmitting and receiving antennas In order to accomplish the best soil contamination detection, this
direct coupling ought to be minimized. With the increase of the spacing between the two antennas, the
direct coupling decreases. However, the received reflected signal from the contaminated soil likewise
becomes weaker. The optimized spacing between the transmitter and receiver antennas is 50cm at
which the direct coupling is minimized and meanwhile the received reflected signal from underground
contaminated soil is significantly notable. Figure 12 illustrates the effect of increasing the direct
coupling between the transmitting and receiving antennas by decreasing of antenna spacing (S) from
50 cm to 40 cm while keeping all other dimensions constant as in Table I. The comparison is
presented over the entire range of frequency for the clean and contaminated soils as shown in the figure. The results indicate that as the antenna spacing increase, considerable increase occurs in ǀS21ǀ at
the resonance dips of soil models due to the decrease of the direct coupling between the two antennas.
Fig. 12. Simulated ǀS21ǀ coefficient for contaminated and uncontaminated dry sandy soils plotted for different antenna
Brazilian Microwave and Optoelectronics Society-SBMO received 11 May 2017; for review 13 May 2017; accepted 24 July 2017 Brazilian Society of Electromagnetism-SBMag © 2017 SBMO/SBMag ISSN 2179-1074
V. CONCLUSION
The present study discuss the validity and effectiveness of utilizing GPR as a tool for detecting soil
contamination due to leakage of oil from underground oil pipelines. Supported by full-wave
electromagnetic simulations, we have discussed analytical aspects and design considerations of a
prototype model of a pipe filled with lubricant oil and buried in sandy soil. The model is used to
evaluate electromagnetic measurements taken in contaminated soil due to oil pipeline leaks. Two
identical horn antennas operating at L-band frequencies has been designed and exploited for bi-static
GPR system. Based on this design, it is proved that there is a noticeable contrast in the reflected signal
in the presence and absence of oil leaks. One finding in this work is that the performance of the GPR
system is highly dependent on three parameters: soil moisture content, pipe burial depth, and the
antennas configuration. The obtained results indicate that GPR system can be customized for
detecting soil contamination.
The work described in this paper has enormous potential for further research. Some of future
possibilities resulting from the current research include:
(1) Fabrication of the designed pyramidal horn antenna and measurement of its parameters then
comparing the measured values with simulated parameters in this study.
(2) Performing the real-world laboratory experiments of soil contamination detection model exhibited
in the current study and compare the laboratory measurements with the simulated results presented in
this work.
(3) Investigation of whether it is feasible to determine the proportion of soil contamination by
utilizing samples contaminated with different concentrations and studying the impact on reflected
signals to the ground penetrating radar receiving antenna.
(4) Investigation of this study utilizing multi-static radar architecture where multiple receiving
antennas in an array configuration are used for the receiving of signals and compare the results with
current study.
REFERENCES
[1] S. Yanxun, W. Yani, Q. Hui, and F. Yuan, “Analysis of the groundwater and soil pollution by oil leakage,” Procedia
Environmental Sciences, vol. 11, pp. 939–944, 2011
[2] M. Huang, C. Lui, L. C. Shen, and D. Shattuck, “Monitoring soil contamination using a contactless conductivity
probe,” Geophysical Prospecting, vol. 43, pp.759–778, 1995
[3] R. G. Pîrnăua, A. Mihu-Pintilieb, G. Bodib, A. Asănduleseic, and L.Niacşu, “Ground penetrating radar as noninvasive
method used in soil science and archaeology,” Soil Forming Factors and Processes from the Temperate Zone, vol. 13,
no. 1, pp. 15–31, 2014
[4] S. Cardimona, “Subsurface investigation using ground penetration radar,” Proceeding of 2nd Annual Conference on the
Application of Geophysical and NDT Methodologies to Transportation Facilities and Infrastructure, 2002
[5] A. H. Abdelgwad, T. M. Said, and A. M. Gody, “Developing of A Ground Penetrating Radar Antenna for Detecting
Water Pollution in Underground Pipelines,” International Journal of Microwaves Applications, vol. 4, no. 1, 2015
[6] H. M. Jol, “Ground penetrating radar: theory and applications,” Elsevier, Oxford, UK.,2009
[7] A. Kaya and H. Fang, “Identification of contaminated soils by dielectric constant and electrical conductivity,” J.
Environ. Eng., vol. 123, no. 2, pp. 169–177, 1997
[8] S. Darayan, C. Liu, L. C. Shen and D. Shattuck, “Measurement of electrical properties of contaminated soil,”
Brazilian Microwave and Optoelectronics Society-SBMO received 11 May 2017; for review 13 May 2017; accepted 24 July 2017 Brazilian Society of Electromagnetism-SBMag © 2017 SBMO/SBMag ISSN 2179-1074
[9] R. K. Rowe, J. Q. Shang, and Y. Xie, “Complex permittivity measurement system for detecting soil contamination,”
Canadian Geotechnical Journal, vol. 38, no.3, pp. 498–506, 2001
[10]N. Ahmadian, S. Hasan, and O. N. Calla, “Permittivity and backscattering coefficient of diesel oil contaminated soil at
C band (5.3 GHz),” International Journal of Microwave Science and Technology, vol. 2013, pp. 1–9, 2013
[11]A. H. Abdelgwad and T. M. Said, “Measured dielectric permittivity of contaminated sandy soil at microwave
frequency,” Journal of Microwaves, Optoelectronics and Electromagnetic Applications, vol. 15, no. 2, 2016
[12]A. R. Von Hippel, “Dielectric Materials and Applications,” MIT Press, Cambridge, Mass., UAS, 1961
[13]M. S. Venkatesh and G. S. V. Raghavan, “An overview of dielectric properties measuring techniques,” Canadian
Biosystems Engineering Journal, vol. 47, no. 7, pp. 15-30, 2005.
[14]R. L. Van Dam, B. Borchers, and J. M. H. Hendrickx, “Methods for prediction of soil dielectric properties: A review,” In Detection and Remediation Technologies for Mines and Minelike Targets XProc. SPIE, vol. 5794, pp. 188-197, 2005
[15]C. Mätzler, “Thermal microwave radiation- Applications for remote sensing,” IET Electromagnetic Waves Series 52,
London, UK, 2006
[16]P. Cao, Y. Huang and J. Zhang, “A UWB monopole antenna for GPR applications,” 6th European Conference on
Antenna and Propagations EuCAP, 2012
[17]C. A. Balanis, “Antenna Theory: Analysis and Design,” John Wiley and Sons Inc., Hoboken, New Jersey, 2005
[18]H. Trang, “Simulation of mine detection over dry soil, snow, ice and water,” Proc. SPIE, vol. 2765, pp. 430-440, 1996
[19] A. H. Abdelgwad, T. M. Said, A. M. Gody, “Microwave Detection of Water Pollution in Underground Pipelines,” International Journal of Wireless and Microwave Technologies, IJWMT, vol.4, no.3, pp. 1-15, 2014