VII
Radiol Bras. 2010 Mai/Jun;43(3):VII–IX
Jaílson Lopes1, Marcelo Bordalo-Rodrigues2
Study developed at Instituto de Ortopedia e Traumatologia (IOT) and at Instituto de Radiologia (InRad) of Hospital das Clínicas da Faculdade de Medicina da Universidade de São Paulo (HC-FMUSP), São Paulo, SP, Brazil. 1. MD, Resident, Division of Musculoskeletal System at Instituto de Radiologia do Hospital das Clínicas da Faculdade de Medicina da Universidade de São Paulo (InRad/HC-FMUSP), São Paulo, SP, Brazil. 2. MD, Director for Instituto de Ortopedia e Traumatologia of Hospital das Clínicas da Faculdade de Medicina da Universidade de São Paulo (IOT/HC-FMUSP), São Paulo, SP, Brazil. Mailing address: Dr. Marcelo Bordalo Rodrigues. Avenida Doutor Eneas de Carvalho Aguiar, 255, Pinheiros. São Paulo, SP, Brazil, 05403-001. E-mail: [email protected]
0100-3984 © Colégio Brasileiro de Radiologia e Diagnóstico por Imagem
Which is your diagnosis?
•
Qual o seu diagnóstico?
Lopes J, Bordalo-Rodrigues M. Which is your diagnosis? Radiol Bras. 2010;43(3):VII–IX.
A male, 29-year old, black patient presented with a mass on his right gluteal region that had developed during his first infancy. The mass size was unchanged for at least ten years and the patient was asymptom-atic and seeking clinical assistance for aesthetic reasons, being referred to the Service of Radiology at Instituto de Ortopedia e Traumatologia (IOT) of Faculdade de Medicina da Universidade de São Paulo by the IOT group of tumors to rule out the possibility of a malignant neoplastic process in the right gluteal region.
Figure 1. Magnetic resonance imaging, coronal, T1-weighted image without fat-saturation (A) and STIR (B) image.
A B
Figure 2. Magnetic resonance imaging, axial, T1-weighted image without fat-saturation (A) and STIR image (B).
A B
Figure 3. Magnetic resonance imaging, coronal and axial STIR images (A,B).
VIII Radiol Bras. 2010 Mai/Jun;43(3):VII–IX
Images description
Figure 1. Magnetic resonance imaging, coronal, T1-weighted image without fat saturation (A) and STIR image (B) demon-strate an expansile heterogeneous, ill-de-fined mass in contact with the right gluteus maximus and the ischio-rectal fossa, infil-trating the subcutaneous tissue, com inter-mediate signal intensity on T1-weighted, and high signal intensity on STIR images.
Figure 2. MRI, axial, T1-weighted im-age without fat-saturation (A) and STIR image (B) demonstrate an expansile mass in the ischio-rectal fossa in contact with perineal structures and infiltrating the sub-cutaneous tissue, with intermediate signal intensity on T1-weighted, and high signal intensity on STIR images.
Figure 3. MRI, coronal and axial STIR images (A,B) demonstrate bilateral, sym-metrical, well-defined, enchained fusiform structures adjacent to the bilateral piriform muscle, typical of deep plexiform neurofi-bromas.
Diagnosis: Plexiform neurofibroma – deep and superficial variances in a patient with type 1 neurofibromatosis.
COMMENTS
Type 1 neurofibromatosis (NF1) is an autosomal dominant disease that in more than 90% of cases is associated with a spo-radic or inherited NF1 gene mutation, af-fecting one in every 3,500 individuals, rep-resenting the most common phakoma-tosis(1). This disease presents a range of
focal and, most frequently, systemic signs in the chest, abdomen, pelvis and limbs, among others(1,2). The diagnosis is clinical,
and generally the disease onset occurs in the childhood but in about 10% of cases a late onset is observed in a frustrating or atypical form of neurofibromatosis(3).
Classically, neurogenic tumors are found out of the central nervous system and include the typical (non-plexiform) neu-rofibromas and plexiform neuneu-rofibromas (PNF). These tumors are benign and origi-nate from the connective tissue of the ner-vous sheaths, particularly the endoneu-rium(2).
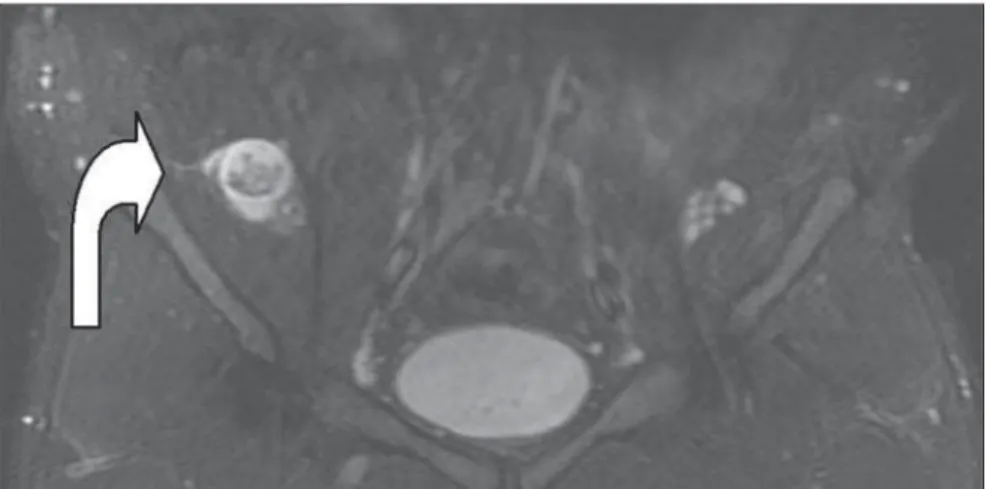
The typical neurofibroma presents a hyperintense halo on T2-weighted se-quences, with low signal intensity in the
center, that may be less intense according to the amount of fibrous tissue within the mass, corresponding to the classical target sign(4), and that was also observed in the
present case (Figure 4, curved arrow). Among the clinical findings of NF1, the presence of a PNF itself is sufficient to complete the diagnosis. The term “plexi-form” refers to a network-like pattern of growth, with the tumor development in multiple nerve fascicles, this nerve becom-ing thickened and surrounded by a pro-teinaceous matrix forming nodules or masses(4). In the spectrum of NF1, the
fre-quency of PNFs may range from 25% to 30%(5,6), but other authors consider such
statistics as underestimated as just clinical findings are taken into consideration(3,4).
Frequently, PNFs involve nervous plex-uses and dorsal roots, as well as other deep structures, particularly major nerves(7).
Generally, PNFs are present at birth, be-coming more noticeable in a later phase(5).
Such disease may be asymptomatic but, differently from typical neurofibromas, cause aesthetic problems, pain and func-tional disorders, with a remarkable morbid-ity because of the continuous growth of the mass and about 10% o risk for transform-ing into a malignant nerve sheath tumor(8).
PNFs are classified according to their location as follows: superficial PNFs, those arising between the skin and the muscle fascia; and deep PNFs, those arising under-neath the muscle fascia. Some lesions may be located in both compartments and the site of their largest volume (> 50%) will define their categorization(7).
Superficial and deep PNFs present dif-ferent characteristics which can be clearly recognized on imaging studies such as magnetic resonance imaging (MRI), high-lighting that, generally, superficial PNFs are unilateral, presenting as ill-defined, infiltrating masses, with a diffuse pattern and no target sign (Figures 1 and 2); and the deep ones tend to be bilateral, presenting as well-defined masses, with a nodular, target or fascicular pattern, also observed in the present case (Figure 3). Increased vascularization is observed in both types of PNF. High signal intensity is observed on T2/STIR-weighted sequences, but high/ intermediate signal intensity may be ob-served on T1-weighted sequences because of the proteinaceous content of the tumor. Gadolinium presents a highly variable hancement pattern, thus gadolinium en-hanced imaging is not utilized as a standard protocol(7,9).
These tumors do not require histopath-ological analysis, since clinical and imag-ing criteria are satisfactory to achieve a di-agnosis. A tailored, individualized thera-peutic management is required, focusing on the greatest possible aesthetic satisfac-tion, functional rehabilitasatisfac-tion, pain and neurological deficit management. A fast growth of the mass and persistent pain draw the attention to a possible maligni-zation(1,7,9).
CONCLUSION
The imaging recognition superficial plexiform neurofibromas allows the
IX
Radiol Bras. 2010 Mai/Jun;43(3):VII–IX
lishment of a diagnosis of type 1 neurofi-bromatosis, in many situations ruling out the presence of a malignant process.
REFERENCES
1. Boyd KP, Korf BR, Theos A. Neurofibromatosis type 1. J Am Acad Dermatol. 2009;61:1–14.
2. Fortman BJ, Kuszyk BS, Urban BA, et al. Neuro-fibromatosis type 1: a diagnostic mimicker at CT. Radiographics. 2001;21:601–12.
3. Jett K, Friedman JM. Clinical and genetic aspects
of neurofibromatosis 1. Genet Med. 2010;12:1– 11.
4. Korf BR. Plexiform neurofibromas. Am J Med Genet. 1999;89:31–7.
5. Huson SM, Harper PS, Compston DAS. Von Recklinghausen neurofibromatosis. A clinical and population study in south-east Wales. Brain. 1988;111(Pt 6):1355–81.
6. Tonsgard JH, Kwak SM, Short P, et al. CT imaging in adults with neurofibromatosis-1: frequent asymptomatic plexiform lesions. Neu-rology. 1988;50:1755–60.
7. Lim R, Jaramillo D, Poussaint TY, et al. Superfi-cial neurofibroma: a lesion with unique MRI characteristics in patients with neurofibromatosis type 1. AJR Am J Roentgenol. 2005;184:962–8. 8. Rasmussen SA, Yang Q, Friedman JM. Mortality in neurofibromatosis 1: an analysis using U.S. death certificates. Am J Hum Genet. 2001;68: 1110–8.