Fatma Ayari1, Fayza Ayari 2 Emin Bayraktar2, Chokri Ben Amar 1
1
University of Sfax, Electrical Engineering Department,
National School of Engineers Sfax (ENIS), B.P.342, Soukra Street, B.P. 1173, 3038 Sfax
2
University of Paris 6, LISSMA/SUPMECA Paris 6,
SUPMECA Paris, 3, rue Fernand Hainaut - 93407 Saint Ouen Paris France
Abstract
Finite element analysis is the most used methodology to predict the mechanical behavior of a large spectrum of materials. It covers many research areas. In the case of metal matrix composites the reinforcing particles are being approximately represented by general regular geometries; i.e. spherical, rectangular, cylindrical and pyramidal shapes. Their distribution is generally arbitrary or approximately distributed with regular homogenous distribution but it doesn’t represent the real configuration of reinforcing particles into the composite matrix, in many cases. We are dealing in this paper with a comparative finite element study of two dimensional and three dimensional microstructure based model of a composite reinforced with ceramic particles. In this study we have discussed the advantages and limitations of each particular reinforcing particle shape in finite element models based on experimental results. In fact, microstructure based Finite element modeling is a very developed field, in which it is supposed that finite element models predict with high accuracy the properties and the behavior of either particles and matrix of the composite material. Some conclusions are emphasizedbased on comparative studies.
Keywords: Finite Element Modelling, Microstructure Composites, experimental tests.
1. Introduction
Seeking to optimize the microstructure of particular composite materials, the analysis of their mechanical properties is an ongoing activity, which is mainly assumed within experimental tests and also numerical simulations. Indeed, reducing the materials density associated to a high elastic modulus and a high strength is a compromise that cannot be achieved without the materials microstructure optimization. This task is being possible within the development of computerised control production processes [1-2]. In the most
general cases the finite element built-models of composite material production analysis are based on a representative volume element (RVE) of the whole composite material. Fibers reinforcing composites are usually illustrated with simple geometries i.e spheres, cylinders, prisms etc.. Their distribution is often associated to either a random distribution rule or a regular distribution rule, all depends on the composite process fabrication; those rules can represent less or more the real behaviour of the material. Thus, composite materials with metal matrix and ceramic reinforcing fibers are mostly used in many engineering fields because of their accurate characteristics. But, the principle difficulties to predict their macroscopic mechanical behavior lies into their micro scale non homogeneity of the reinforcing particles orientation and distribution [3-4]. The main research efforts were focalized on the deduction of the mechanical stress-strain fields in the simulated composite and their comparison with experimental values. Often the discrepancy of the numerical results and experimental results was associated to the physical condition of experimental tests and also to the geometrical parameters of the finite element model. Nevertheless, the inhomogeneity of the microstructure wasn’t considered to be at the origin of discrepancy between experimental facts and simulated one. Few recent studies have been interested with the microstructure but they don’t give an objective approach how to move from the original real microstructure of the composite material to the finite element build model [5-6]. Also, in their study there is no quantitative measurement of the errors being issued from the different ways of building the representative volume element and the shape of reinforcing fibres embedded into the matrix composite.
give an overview about the influence of the cells geometry shape on the response of the finite element model under a particular loading condition. Specifically, researches nowadays are joining the design of new metal matrix composites based on iron matrix reinforced with ceramic materials to improve stiffness, therefore elastic modulus in addition to reducing the density of the material. This iron matrix composite material should also allow a better weldability and good metallurgical structure. A large number of works has been developed in the last decade trying to optimize the microstructure of those materials based on their manufacturing processes using computerised approaches. [7-10]
2. Experiments
An innovative metal-ceramic composite Fe-TiB2 metal matrix composite (MMC) material has been developed using particular process based on pure iron, IFS (interstitial free steels) was developed by ARCELOR-MITTAL. The development of this product requires a better understanding of the relationship between crack propagation and microstructure. For this purpose it is aimed in this paper to study in-depth quantitatively the metallurgical structure using (image analysis software’s and FE method), on thin sheet Fe-TIB2 metals. In a second step, using a homogenisation scheme, a finite element based model is build which is inspired from the microstructure of the material. The micro hardness testing and the compressive tests are selected to compare between performances of this material based on experimental tests results and also numerical macro FE structural study.
The dispersion of TiB2 particles in iron matrix is somewhat heterogeneous. We note that the geometry of TiB2 particles is regular but different particle sizes are observed as far as the specimen is in a particular plane. Fig.1
Fig.1 microstructure of the MMC iron TiB2 with different scales observation
Because the studied material is assumed to be slightly homogeneous, the microstructure in Figure 2 shows the existence of some large particles of TiB2. This fact has incited us to take hardness measurements on a ceramic substance. The
microstructure shown by Fig.2 illustrates the fragility of TiB2. In fact, the application of a 500 mN force causes an explosion of the particle and large cracks. In addition, the measured hardness 3188 HV is very high compared to the average harness of the material presented by Figure.3
Fig.2 a - TiB2 particle under compressive load with brittle fracture, b- the impress of the indenter
Fig.3 average hardness of the MMC Fe-TiB2 material.
In Fig.2, we see an impression of the indenter on the ceramic particle. Under a load of 500 mN, the particle is cracking; this explains that the particle is fragile. Its hardness is about 3188 Hv, and Young's modulus is 361 Hv. A micro indentation test has allowed us to define the hardness and Young's modulus of each area of the material, then in ceramic particles.
Ferrite steels show a transition of fracture (fragile-ductile mode). In fact, (fragile-ductile fracture is mainly related to the presence of inclusions or precipitates. In this mode of failure, macroscopic plastic deformation is significant and leads to the final fracture characterized with micro relief.
Brittle fracture is characterized by the absence of macroscopic plastic deformation, and therefore by the very rapid crack propagation with low energy consumption. The break is clean, it follows crystallographic planes, and we can observe cleavage fracture. The material breaks before leaving the elastic regime, in the case of ceramic TiB2, MMC metals at low temperature.
Fig. 4 The choc test specimen designed by Bayraktar [11], a– real specimen, b- a FE stress distribution model with Abaqus
stress analysis.
Fig.5 Absorbed energy after choc test of the Fe-TiB2 (105A)
The first relevant point that emerges from Figure 4, is the non continuity of fracture energies, in fact, a rapid change of transition energy between the two zones. A slow variation in the ductile field is denoted; this zone is marked with a high energy. The fracture brittle field has low energy. There is a significant dispersion, and the area of fracture energy is greater, compared to the brittle ductile zone. This result is due to the characteristic of the microstructure of the composite steel that has not homogenization in the spread of TiB2 particles. It was concluded also that thickness has no effect on the transition temperature, and thus the toughness stiffness of this MMC material. In view of these results, we can build a FE model and try to compare between those results.
3. FE microstructure model
Mechanical behaviour through variety of experimental approaches is ongoing; nevertheless, to clarify the effects of the shape, size and distribution of particles on (Fe-TiB2) MMC material, deformation behaviour still remains a huge motivation that attract attention of many authors.
Before building the FE model to simulate the MMC behaviour, it is necessary to collect information
about the microstructure of the material via the images provided by micrographic observation. After the composite surface preparation and observation, we have to apply image processing techniques in order to ensure the reduction or elimination of images distortions introduced in the system used to acquire the image in order to obtain the closest image possible to the ideal micrographic image that would be obtained if the acquisition system was perfect. Reducing the noise to get more precise items is possible via different approaches. The second task is to identify contour detection of different constitutive phases in the microstructure. In fact, a contour is corresponding to an intensity variation or a discontinuity between the properties of two sets of points. The edge detection methods do not lead directly to a segmentation of the image because the contours are rarely related. Often it is required requires a closing edges step.
3.1 Edges detection and image processing
The contours represent high frequencies of the image, a high-pass filter is habitually used, and the derivative operator can also bypass the filtering. Thus, two approaches are used; the estimation of the first derivative and also the second derivative. The steps towards contour edges detection can be resumed as follows:
• Image filtering
• Calculation of the modulus and the direction of the gradient
• Extraction of the local maxima or zero crossings. • Simple thresholding or hysteresis thresholding • Closing contours and eliminating noise • Tracking and tracing contours
Fig. 6 Original image which represents the dispersion of TiB2 grains in the matrix of Iron.
Fig. 7a After applying the algorithm Bernard results are observed following the early iterations Image
Fig.7 b Edge Detection at the end of iterations
Fig.8 SEM image of microstructure of TiB2 origin (second example)
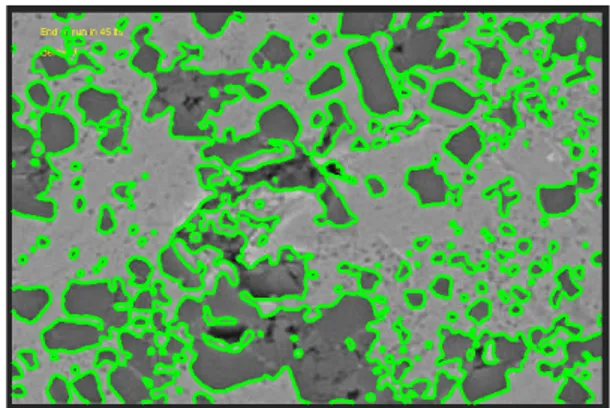
Fig. 9 contour detection algorithm using Bernard (Microstructure of TiB2 circled in green).
Phase image segmentation is a crucial step in particular in the case of images microstructures because it is a complex data for which the algorithm must adopt the most appropriate view point and replicate precision contours.
3.2 FE model and theoretical fundaments
In order to discover the stress strain mechanism of TiB2 particles reinforcing the metal matrix composite, we have build a finite element model (FEM) based on the actual microstructures. This model is inspired from the micromechanical composition of the Fe-TiB2 MMC material. Also, this model can provide the distribution of von Mises effective stress, strain and the maximum principal stress in the matrix and particles. The model is used to perform a comparison between experimental results and numerical results of compressive tests. As it is shown by Figure 11, we describe schematically the conditions of experimental compressive tests, under a rigid indenter. Figure 11 b, illustrates the geometric variables used in this model. Figure 6a and Figure 6 b, provide the geometry and mesh parameters used to analyse these experimental tests.
periodic boundary conditions to the external faces of the specimens. The inclusion positioning is constrained by the practical limitation of generating an acceptable FE mesh. A criterion is applied to the minimal distance between each inclusion surface and the external faces of the specimen. The volume of one particular cell inclusion is less than 1 mm diameter.
The representative cells are meshed with quadratic tetrahedral elements. FE simulations are performed using ABAQUS (2010) [13] and the whole volume is meshed using 4-node C3D4 tetrahedra in ABAQUS), enabling us to better capture the strain gradients in the matrix. Convergence study was successfully conducted by comparing the predictions (effective response and average inclusion response) to those obtained with finer meshes. Figure 8, show typical meshes for a composite with various inclusions. The macroscopic stress predicted by the FE analysis is computed from a volume average of the stress tensor given at each integration point over the REV of domain i:
∑
=
σ
=
σ
NK1 k
k k
V
V(i)
1
( 1)4. Numerical procedure
It is aimed to compute the macroscopic stresses and strains using a homogenization procedure according to the Mori-Tanaka (M-T model) [14]. In fact, the computations of the matrix average stress and the macroscopic stress are identical to the M-T model. The procedure is fully history-dependent, the deformation state at each integration point in the FE discretization as well as the current matrix average state depends on the corresponding state at the previous step time. Therefore, FE analysis provides an alternative approach for estimating the material properties. Development of an effective parametric FE procedure requires automation of model creation, submission, results extraction, and comparison with experimental data. Within the context of Abaqus, the Python scripting language allows for such automation. The inclusion average stress may be directly extracted from the FE simulation using a Python script file. The computation of the average stress in each phase affects only the effective response of the composite, not the prediction of the stress-strain partitioning. Here, a combination of tools was used to drive the optimization process. A Matlab interface was developed to create the Abaqus input file with all the necessary geometries, material parameter assignments, and also FE results acquisition. Python scripts were used to extract reaction forces, displacements and other variables from the output
database, which were fed back into the Matlab process for comparison with the experimental data.
The FE solution is used to simulate two-phase composites consisting of an elasto-plastic matrix reinforced by linear elastic TiB2 inclusions. The predictions of the mean-field models are compared to reference results from FE computations on representative cells containing a random arrangement of multiple inclusions. As we are looking for optimising the computation process, we have opted for three cells geometries; cylindrical inclusions, spherical inclusions with randomised cell distribution in a first step of this work. A real shape inclusions deduced from the micrographic images provided by microscopic observation is used in a second step of this work. In fact our aim in this study is to enhance the impact of the FE modelling on the stress-strain response of the composite material compared with experimental results. Fig.11 and Fig.12 show the geometry of cylindrical cells used in the FEM first model. Fig.13 is representing the spherical cells geometry of the second FEM model. Uniaxial and plane strain loading are successively applied to the multiparticle cells. The average of the macroscopic strain over a representative equivalent volume (REV) computed at each time step provides the loading history for the corresponding models. Therefore, results corresponding to the same macroscopic strain history, consistently with a strain homogenization procedure are stored. The simulation is performed and results are compared to data from a comparable experiment data set. The agreement between the model predictions and the data is quantified and judged to be sufficient or insufficient. If the agreement is not adequate, the parameter values are updated, a new FE model is created and run, and the process continues.
Fig.11 MMC Fe-TiB2 under compressive test a- FE model, b the compressive scheme
Fig.13 different model parts and mesh representation
Average equivalent stress in the inclusions of two MMC material phases is determined for different volume fractions of the reinforcing phase. The multi-particle, FE predictions (FE with 20% volume fraction) corresponds to a uniaxial compression test, while the predictions of the FE model are obtained imposing the same strain history as in the multi particle simulation. Fig.14, show the stress distribution in the FE model based on cylindrical cells.
Fig.14 Two-phase MMC Fe-TiB2 under tension tests
The presence of TiB2 particles which strengthen a steel metal matrix composite modifies the rigidity of the material.
In a second step of the FE modelling a 2D representation of the microstructures is illustrating the morphology of the microstructure. Thus, a modeling approach based on the microstructure is needed to connect the microstructure of the material to its behaviour. In this part, we used a FE modelling approach based on the microstructure TIB2 particles distribution. Fig.15 shows schematically the steps taken in developing a model based on the microstructure using EF technique.
Fig.15 steps towards the FEM model based on the microstructure of the MMC Fe-TiB2
In order to simulate the mechanical behavior of a model microcellular 2D is established based on the microstructure of the material. Fig.16 shows a decomposition of the microstructure which represents TIB2 particles of different sizes and shapes. Fig.17 illustrates the separation of particles from the matrix and the sketches used to build the FEM (REV). It is clear that there is a quite similarity in the shapes, distribution, size and orientation of the particles compared to the real microstructure. Fig.18 shows the finite element mesh for the numerical simulation.
Fig.16 Microstructure of the material FeTiB2
Fig.17 Separation between the grains of TiB2 and Fe matrix
Fig.19 Boundary conditions of the structure (compression loading on the edges)
The boundary condition is so set that at the bottom border Ux, Uy, Uz = 0 and at the upper face of the specimen is imposed a negative displacement load Uy in y-direction via the rigid spherical or the plate indenter. A static step with small step time is used to assess the gradual evolution of stresses and strains in the elements model, the equivalent reaction force is calculated and used to furnishes the maximum load, when the deformation at the contact zone riches comparable value with the considered limited experimental one.
The mechanical Fe-TiB2 MMC material properties are derived from the particles inclusions properties of the TiB2 and those of pure Fe.
Fig.20 Distribution of stresses in the structure of iron and TiB2 particles. In this figure the TiB2 grains are solicited with the
highest stresses (the range varies from 2.2 103 to 5.02 103).
Fig.21 Stress distribution in the Fe matrix (we have removed virtually TiB2 grains separately to see the stress distribution on
the Fe matrix only)
Fig.22 Stress distribution σ (F / S) in the TiB2 alone.
Fig. 23 Distribution of displacements u in the material structure
Fig.24 Distribution of deformations in the TiB2
5. Results and Discussion
TiB2 particles are assumed to be linearly elastic with elastic modulus Ep = 500 GPa and Poisson's ratio P = 0.17. The matrix metal comprises a steel with elastic modulus Em = 200 GPa, Poisson's ratio = 0.3 and the stress-strain relationship is defined as linear for the particles but elastic plastic for the matrix. In general, the behavior of the true stress-strain curves of composites in a model is obtained by averaging the stresses and deformations.
The stress distribution represented by Fig.20 to Fig.25 shows the contour plot of Von Mises (effective stress in the matrix of Fe and in the particles). It should be noted that the distribution of the Von Mises effective stress in the matrix of Fe is very heterogeneous, as TiB2 grains occupy locations in the non-regular matrix. Due to the difference in deformation of the grains of TiB2 which are very hard and those of Fe and the remarkable difference of their elastic modulus. It is shown that deformations and stresses are not homogenous, maximum stresses are localized at the vicinity of the TiB2 particles.
However, it should be noted that the von Mises stress at the corners of TiB2 particles reaches their limits, there are stress concentrations. This concentration is proportional to the particle sizes. This implies that neighbouring particles are yield to higher stresses and strains.
Fig.24 shows a plot of Von Mises contours in the deformed particles. It should be noticed that the effective Von Mises stresses in particles are superior to those of the matrix, indicating that the TiB2 reinforcing particles are assumed to carry the maximum loads of the composite material.
The FE solution used to simulate two-phase composites consisting of an elasto-plastic matrix reinforced by linear elastic inclusions. The predictions of the mean-field models are compared to reference results from FE computations on representative cells containing a random arrangement of multiple inclusions. Uniaxial compressive loading are successively applied to the multi particle cells embedded in the metal iron matrix. The average of the macroscopic strain computed at each time step provides the loading history for the corresponding FE models.
Average equivalent stress in the inclusions of two phase MMC material is determined for 2 volume fractions of the reinforcing phase 10 % and 20%. For comparison, the predictions of the compressive results, by mean of deformation and maximum loading are shown for uniaxial compression Fig.20 to Fig.25. The average volume fraction for
The analysis of stress and strain in the case of a tensile load of the two axes is made by adopting two recessed edges (the edge of the bottom and that of the left) and the other two edges are subjected to displacements Ux and Uy uniformly distributed over these edges.
It should be noted that the deformations of TiB2 are very low since the color blue represents the minimum distortion as shown in Fig.24. We can conclude that in this case the maximum deformations are supported by iron, whereas the maximum stresses are supported by the TiB2 grains.
At this stage we have conduct a comparative study of the composite material response under axial loading for the three studied cases. The average stress-strain responses of the FE models build with three different particles geometry were compared.
Fig. 26 Stress-strains of the composite for cylindrical, spherical and microstructure particle cells.
The sphere and cylindrical particles had an aspect ratio of one, (close to the average aspect ratio of the TiB2 particles). Al alloy (up to the ultimate tensile strength), was used as the input for the matrix. A 2% uniaxial strain was applied to all models by fixing the displacement of the x-z plane, and applying a uniaxial displacement on the parallel y direction. In the microstructure-based model, this corresponds to loading along the extrusion axis. The rotation of the model was also constrained along all three axes.
ratio and alignment of the TiB2 particles along the loading direction.
We have also examined a comparison of all predicted modulus compared to experimental tensile data on the same composite. It was demonstrated according to Table.1 that the most representative modulus is obtained via the microstructure particles cells model. The two 3D spherical and cylindrical particles cells models do not correlate very well with the experimentally determined Young’s modulus. The complex geometry of the TiB2 real particles does affect significantly the simulated results. According to these results it is important to consider the geometric parameters (like the cell sizes, their orientation and distribution) into account in the case of MMC composites reinforced with ceramic particles because of the dependence of simulated results on the real microstructure of the material. Nevertheless, the microstructure-base FE model do devotedly represent the experimental behavior only when we respect all the steps illustrated via figure 15 and especially the identification of the particles cells via image processing on the observed surface. From figures 24 and 25 it was shown also that the small evolution of plastic strains is being developed at the corners of TIB2 particles, so that plastic flow is at sharp angular corners of the particles associated to a localization of high strains between particles this result is obtained either with cylindrical, spherical and microstructural cells particles models and it is well correlated with previous literature results [15].
Table.1: FEM Properties vs Experimental results
6. Conclusion
In the present work we are is exploring the effects of particles size, number spread and orientation on the matrix of a MM composite on the response of the model to predict experimental facts.
Comparison of stress strain predictions from FE models with experimental results show that the microstructure based model is the most accurate in predicting the experimental results.
These simplifications make modelling and analysis more efficient and straightforward, for example, by minimizing computing resources.
Nevertheless, it is discernible to us those microstructural complexities such as the inhomogeneous spatial distribution of particles,
irregular morphology of the particles, and often anisotropy in particle orientation significantly affect deformation behavior.
In the case of TIB2 particles a simplified hypothesis of spherical or cylindrical self shape is from the reality. Thus, while conventional models can provide general information of damage, they are unable to accurately predict the effective properties and local damage characteristics that are intrinsically dependent on the real composite microstructure. In this work we have shown that the performance of simulation models based on finite element microstructure of materials to replicate actual tests. This also allowed us to understand the contribution of metallic reinforcing elements (TiB2 ceramics) to bring greater rigidity to the base material (iron or steel in our case). Often the types of experimental tests quite complicated to achieve, it is very interesting to go through a simulation that helps to understand the experimental phenomena. The performance of the finite element models is that they are accurate and can simulate different loading configurations, with a fast and efficient manner. Indeed, this model can easily be used to simulate other class of materials. It follows that an accurate prediction of macroscopic deformation behaviour and understanding of localized damage mechanisms can only be accomplished by capturing the real microstructure of the material as a basis for the model.
References
[1] J. L. Jordan, R.D. Dick, L. Ferranti, N.N. Thadhani, R.A. Austin, D.L. McDowell, and D.J. Benson, "Equation of state of aluminium iron oxide (Fe2O3) – epoxy composite: modeling and experiment", American Institute of Physics, 2006, pp 157-160 [2] H. J. Bôhm and F. G. Rammerstorfer,
"Micromechanical investigation of the processing and loading of fibre-reinforced metal matrix composites", Materials Science and Engineering, A 135, 1991, pp. 185-188
[3] S. Youssef, E. Maire, and R. Gaertner, "Finite element modeling of the actual structure of cellular materials determined by x-ray tomography", Acta Materialia, 2005, 53(3) pp 719 – 730.
[4] H.K. Jung, Y.M. Cheong, H.J. Ryu, and S.H. Hong, Scripta Mater., (1999) 41, pp 1261-1267.
[5] Narayanasamy R. and Pandey K.S., "Some aspects of work hardening in sintered aluminium–iron composite perform during cold axial forming", Journal of Materials Processing Technology, V84, 1998, pp 136–142.
[6] Zhang W X, Li L, Wang T J., "Interphase effect on the strengthening behavior of particle-reinforced metal matrix composites", Computational Materials Science 41(2), 2007, pp 145-155.
[8] Narayanasamy R., Ramesh T. and Pandey K.S., "Some aspects on cold forging of aluminium–iron powder metallurgy composite under triaxial stress state condition", Materials and Design 29, 2008, pp 891–903.
[9] Zhang W X, Li L, Wang T J., "Interphase effect on the strengthening behavior of particle-reinforced metal matrix composites". Computational Materials Science 2007; 41(2): 145-155.
[10] Yan Y W, Geng L, Li A B. "Experimental and numerical studies of the effect of particle size on the deformation behavior of the metal matrix composites", Materials Science and Engineering: A 2007; 448 (1-2): 315-325.
[11] Bayraktar E., Masounave J., Caplain R., Bathias C., "Manufacturing and damage mechanisms in metal matrix composites", Journal of Achievements in Materials and Manufacturing Engineering, JAMME, 31/2, 2008
[12] O. Bernard, D. Friboulet, P. Thevenaz, and M. Unser, "Variational B-Spline Level-Set: A Linear Filtering Approach for Fast Deformable Model Evolution", IEEE Transaction on Image Processing (2009)
[13] ABAQUS, Simulia, Providence, RI, USA
[14] Mori, T., Tanaka, K., "Average stress in matrix and average elastic energy of materials with misting inclusions". Acta Metall, 1973. 21, pp 571-574 [15] J.N. Goodier, J. Appl. Mech., 55-7(1933) 39.
Fatma Ayari: is Graduate Research Assistant of Electrical engineering. She is a PhD student in Electrical Engineering at the National School of Engineering,
Tunisia. She teaches undergraduate courses in
Programming Mathematics and Informatics. She’s
research areas of interest include experimental and computational signal processing, neural networks and automatics. She has published in journals and proceeding conferences as IEEE proceedings.
Fayza Ayari: received the B.S. degree in Mechanical Engineering from the High school of science and techniques of Tunisia (1994), the M.S. and PhD degrees in Mechanical engineering from the National school of engineering Tunisia in 2004 she is currently teaching as associate professor in the Department of Mechanical Engineering of the IPEIM Tunis. Her research interests include Fluid mechanics, Non-linearity of structures, Instability phenomenon. Static and dynamic elastic-plastic stress-strain analysis. Fracture mechanics and wear. She is participating in many international conferences and authors in many international journals and conferences proceedings.
Emin Bayraktar: Full Professor, academic and research staff-member at SUPMECA/LISMMA-Paris and research staff at CNAM industrial materials laboratory Paris since 1994. He earns a B.Sc., M.Sc. and PhD- DSc in Mechanical and manufacturing engineering (1983), from (OSU-USA). He has also a B.Sc., M.Sc. and PhD. in materials science and engineering (1997) (CNAM - Arts et Métiers/Paris), (CNRS-CNAM-Paris). Fellow of WAMME. Editorial Board of JAMME, OCSJ and f IJCCS. Editor: Welding and Bonding Technologies, Volume 6 (ELSEVIER SCIENCE -England, Major reference Work (MRW) - Handbook). Editorial & Steering Committee of AMPT - Advanced Materials Processing technologies. Organizing committee of AMPT - 2010. Advisory - Steering Committee of APCMP. His major research areas are Weldability of steel, sheet metal forming, advanced manufacturing processes, dynamic tensile test (crash test), fatigue damage, damage mechanisms of materials (metallic,
intermetallics, rubber & composites), design of new composites and damage characterization.
Chokri Ben Amar: he joined the Sfax University (USS), where he is currently a professor in the Department of Electrical Engineering of the National Engineering School
of Sfax (ENIS), and the Vice director of
![Fig. 4 The choc test specimen designed by Bayraktar [11], a–](https://thumb-eu.123doks.com/thumbv2/123dok_br/18276715.345141/3.892.110.401.118.324/fig-choc-test-specimen-designed-bayraktar.webp)