Abstract
This paper presents a series of uniaxial compressive experiments on natural lake ice under moderate strain-rate in the range of 10−1 to 102 s−1 at −0.1 °C. Natural lake ice samples of 8 cm by 8 cm in cross section and 20 cm high were used to investigate strain-rate dependence of uniaxial compressive strength and flaw effects on ice strength under moderate strain rates. The fracture modes of ice at moderate strain rates were also systematically investigated by using high-speed camera. It is found uniaxial compressive strength of natural lake ice increases with increasing strain-rate in the em-ployed moderate strain-rate range. And natural flaws such as air bubble have a significant effect on uniaxial compressive strength of ice under moderate strain-rate, higher air content ice possesses lower compressive strength. Ice fracture mode depends on strain-rate (or compressive velocity) of ice specimen, varying from split-ting at strain rates lower than 10 s−1 to crushing at strain rates higher than 10 s−1. Ice specimen crushes into fine fragments may due to insufficient time for micro cracks to propagate, thus results in higher strength. In addition, dependence of compressive strength on strain-rate in a wide strain-rate range is also discussed.
Keywords
Ice mechanics, dynamic compressive strength, moderate strain-rate, fracture modes, air content, melting point temperature, high-speed camera.
Dynamic Compressive Strength and Failure of Natural Lake Ice
Under Moderate Strain Rates at Near Melting Point Temperature
1 INTRODUCTION
Mechanical properties of ice have been investigated for a long time since their close relationship with production as well as life safety. Offshore oil platforms located in ice affected regions and ships sailing in ice season may encounter the risk of collision with sea ice floes or icebergs. As inland riv-ers in cold region freeze up in winter, ice covriv-ers produce static expansive forces to the riverbanks.
Chunfeng Qi a Jijian Lian a
Qunan Ouyang a, *
Xin Zhao a
a State Key Laboratory of Hydraulic
Engineering Simulation and Safety, Tianjin University, People’s Republic of China. [email protected]
* Corresponding author
http://dx.doi.org/10.1590/1679-78253907
When ice covers break-up in the following spring, then, broken ice floes generate dynamic impact forces to hydraulic structures in the rivers. In the past several years, study on ice mechanics has been attracting great attention in China. Ice-related issue was one of the most concerned issues that cause problems for water delivery in ice season of South-to-North Water Transfer Project, which is aimed at mitigating water shortages state in the northern of China (Guo-Bin et al., 2010; Mu et al., 2011).
Issues above-mentioned are all closely related to ice mechanical properties, and there have exist-ed several reviews and monographs focusing on this field (Cole, 2001; Dempsey, 2000; Michel, 1978; Schulson and Duval, 2009). Through considerable work on the compressive and tensile strength in both uniaxial case and multi-axial case, the ice strength dependences on strain-rate, temperature and microstructure are well understood. However, lots of existing literature mainly focused on me-chanical properties of ice at creep and quasi-static strain-rates, usually in range of 10−7 to 10−2 s-1. While some issues relating to ice in engineering practice may correspond to higher strain-rates, such as high-velocity collision between ice and bridge piers or between ice and ships. Therefore, investiga-tion on mechanical properties of ice at elevated strain-rates is extremely necessary. It is the basis of better modelling ice dynamic behavior and predicting impact force in high-velocity collision between ice and structures.
(Combescure et al., 2011; Shazly et al., 2009). Combescure et al. (2011) conducted impact failure tests applying bullet-like ice samples, it was found that fracture mode was cleavage for inclined im-pact and fine fragmentation for flat imim-pact, more finer fragments with higher imim-pact velocity.
Though we have obtained some useful achievements on ice mechanical behaviors under moder-ate and high strain-rmoder-ate, it is disappointing that there are still a lot of uncertainties. As above-mentioned, conclusions of previous studies on strain-rate dependence of compressive strength over elevated strain rates are inconsistent. Apart from this, in most of the previous experimental studies under moderate and high strain-rate, artificial ice samples of centimeter magnitude size were adopt-ed. Artificial ice can possesses the similar grain structure as natural ice, but it is difficult in air bub-bles and impurities. Artificial ice of small size may get a higher strength than natural ice, due to the former contains few internal flaws. While in engineering practice, most encountered is natural ice, to investigate mechanical properties of natural lake ice at moderate and high strain-rate may be more practical and meaningful than artificial ice in aspect of practical application.
In present study, we utilize natural lake ice samples with size of 8 cm by 8 cm in cross section and 20 cm in length for dynamic behavior tests. A customized electro-hydraulic servo dynamic test-ing machine was employed for loadtest-ing and a High-speed camera is adopted for recordtest-ing fracture process. The testing nominal strain-rate ranges from 0.5 to 75 s−1 and testing temperatures is −0.1 °C, a near melting point temperature. The relationship between dynamic compressive strength of natural ice and strain-rate over elevated strain rates is investigated, as well as the air content effect on the uniaxial compressive strength.
2 EXPERIMENTAL PROCEDURES
2.1 Ice Specimens
Natural ice was harvested from an artificial lake—Jingye Lake. Lake ice samples in this study were harvested on Feb. 7, 2015, when the air temperature was −2.0 to −1.0 °C. First, we obtained square ice blocks with edge length of 40 cm by utilizing chainsaws in the pre-selecting sampling sites, where no obvious cracks existed and are safe for operating. In order to investigate air content effect on compressive strength at elevated strain rates, two sampling sites were selected. One site is with no-obvious air bubbles ice plate and the other is with no-obvious air bubbles ice plate. Special care was taken to avoid formation of artificial cracks in ice in the process of cutting ice blocks. After that, these ice blocks were carried to the cold room as soon as possible and were stored in freezers at −1.0 °C.
In order to better quantify quality of ice, air content was chosen as a main measure parameters though transparency was also important. Ice harvested from sampling site where ice possesses no-obvious air bubbles contain few and tiny air bubbles and had better transparency, we regard these ice samples as “Lower Air content” (LA) ice. While ice harvested from sampling site where ice pos-sesses obvious air bubbles, which are spherical or elongated, and the transparency was at a poor level, we regard these ice samples as “Higher Air content” (HA) ice (as shown in Figure 1). The elongated bubbles included in HA ice may reach 5 mm in diameter and 20 mm in length and were the same order as columnar grains. Impurities contained in both site ice mainly consisted of leaf debris of millimeter magnitude size, and the surface ice contained more in general. This was another reason for surface ice being removed. Air content was indirectly measured based on apparent densi-ty of ice. After ice specimens were carefully observed and their dimensions were measured, they were numbered with the prefix LA for “Lower Air content” ice specimens and HA for “Higher Air content” ones, and then they were stored in a freezer. All ice samples were stored in the freezer with a constant temperature of −0.1 °C and were stored for at least two days prior to testing.
(a) (b)
Figure 1: Air bubbles and impurities included in Jingye Lake ice. The yellow subject in (a) is a narrow willow leaf; the gray dots in (b) are impurities.
2.2 Apparatuses and Methods
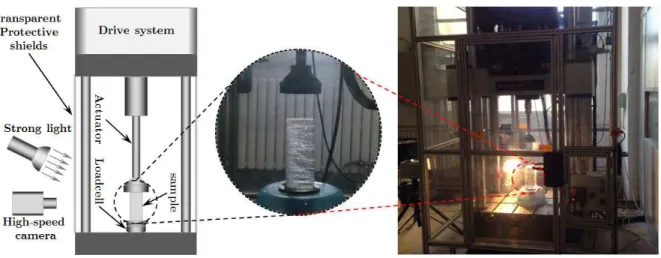
In order to better understand the failure process of ice, FASTCAM SA-X2 high-speed camera (HSC) was used to capture the failure process and the recording rates of HSC is up to 13500 frames per second (fps) at megapixel image resolution with high image quality, and higher recording rate can be reached with lower image resolution. The recording rate employed in this study was 45000 fps with image resolution of 512 by 512 pixels. At least, two or three frames were obtained in the failure process even at the highest loading velocity of 15 m/s.
Figure 2: Instron VHS High Rate Testing System.
The ice specimen was taken out for testing after it had been storing in freezer for more than 48 hours. Exhaustive preparatory work should be carried out prior to test, that involves checking ap-paratus to ensure trouble-free, setting loading velocity, distance between the actuator and the bot-tom platen, stroke of actuator and clearing up of ice fragments produced in the last test. After well completion of the above preparatory work, ice specimen was taken out and placed on the center of the bottom support with longer edge along vertical direction, so the ice specimen was loaded per-pendicular to the length of the columns.
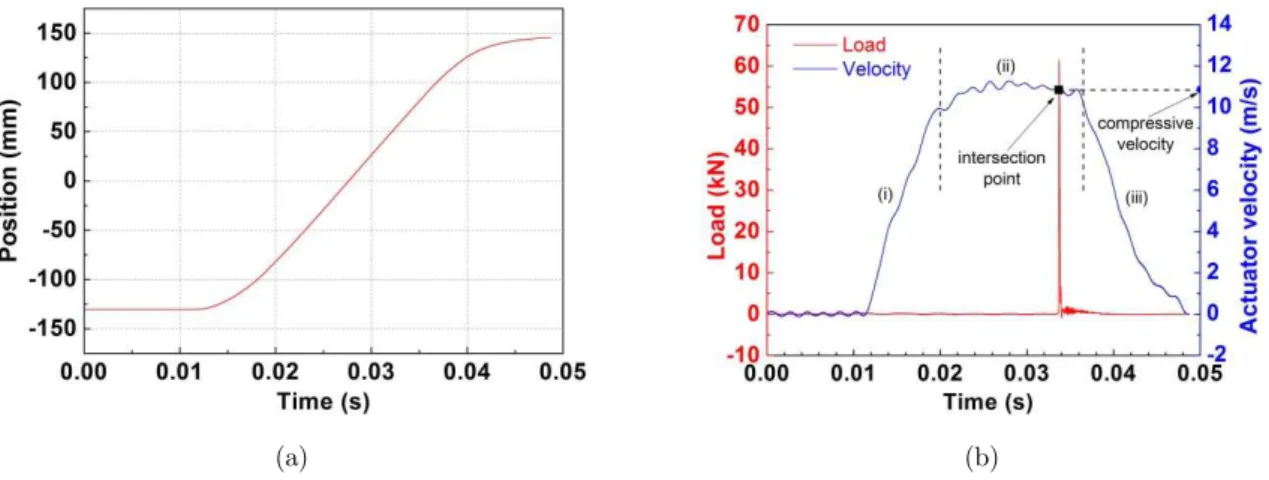
and specimen is comparatively short, usually no more than 0.1 second. Within such a short time window, the actuator velocity is almost unchanged. So the actuator velocities corresponding to in-tersections (black square mark shown in Figure 3 b) of the load profile and the velocity profile are regarded as compressive velocities. Though they are not exactly the same, differences between them are tiny, and either one of them can be chosen as compressive velocity. If we want to compress ice specimen at a pre-setting velocity, the intersections of the load profile and the actuator velocity profile should be located in the stable stage and this was succeed after many attempts. Actuator of HRTS needs to travel a certain distance both in rising stage and decline stage, and the distance varies depending on the pre-setting velocity. The key to make sure ice specimens are compressed at pre-setting velocity is to set the distance between platen and upper end of ice specimen greater than distance needed to reach the pre-setting velocity, so the crosshead could contact with ice specimen at constant pre-setting velocity. However, another caution is that the stroke of the actuator cannot be set too large in order to avoid collision with the bottom support. The strain rates mentioned in this study are all nominal strain rates and were calculated through compressive velocity divided by ice specimen length.
(a) (b)
Figure 3: (a) Actuator displacement profile; (b) Load profile and actuator velocity profile. The actuator velocity profile consists of (i) rising stage, (ii) stable stage and (iii) decline stage. The intersection point
(black square mark shown in b) of the load profile with the actuator velocity profile should be located in the stable stage in order to obtain a constant compressive velocity.
3 EXPERIMENTAL RESULTS
3.1 Compression of Ice with 0.1 and 0.2 m/s Compressive Velocity
Results of ice specimens at 0.1 and 0.2 m/s compressive velocity were presented in this sub-section. Four specimens were included at each compressive velocity. All of the specimens were rectangular of dimensions 8 cm by 8 cm in cross section and 20 cm in length, while their air content may be differ-ent. The experimental parameters and experimental results are summarized in Table 1 and 2, re-spectively. High-speed camera was used in order to capture the failure process of ice specimens at different compressive velocities and to identify whether non-simultaneous load exist during the compression. The unsuccessful samples were abandoned.
Test series Sample name Specimen dimensions Air content Length (cm) Width (cm) Height (cm) 0.1mps
HA0.1mps_1 7.8 7.8 19.8 1.51%
HA0.1mps_3 8.0 8.0 19.8 0.82%
LA0.1mps_4 7.6 7.7 19.8 0.10%
LA0.1mps_5 7.9 7.8 20.0 0.13%
0.2mps
HA0.2mps_1 7.9 7.8 19.9 2.10%
HA0.2mps_2 7.9 7.5 19.6 2.00%
LA0.2mps_5 7.8 7.9 20.0 0.21%
LA0.2mps_7 7.8 7.8 20.0 0.14%
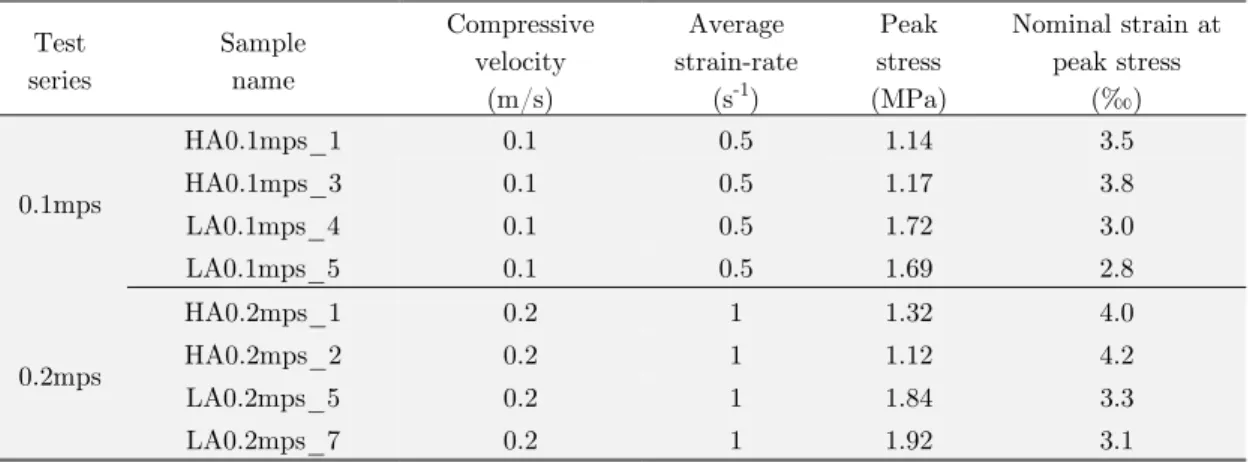
Table 1: Experimental parameters for compression of natural lake ice with 0.1 and 0.2 m/s compressive velocity.
Test series Sample name Compressive velocity (m/s) Average strain-rate
(s-1)
Peak stress (MPa)
Nominal strain at peak stress
(‰)
0.1mps
HA0.1mps_1 0.1 0.5 1.14 3.5
HA0.1mps_3 0.1 0.5 1.17 3.8
LA0.1mps_4 0.1 0.5 1.72 3.0
LA0.1mps_5 0.1 0.5 1.69 2.8
0.2mps
HA0.2mps_1 0.2 1 1.32 4.0
HA0.2mps_2 0.2 1 1.12 4.2
LA0.2mps_5 0.2 1 1.84 3.3
LA0.2mps_7 0.2 1 1.92 3.1
Table 2: Experimental results for compression of natural lake ice with 0.1 and 0.2 m/scompressive velocity.
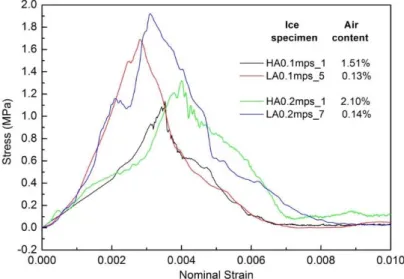
changes gently. Ice specimen with higher air content exhibits a slightly higher ductility, and gets peak stress at higher nominal strain than ice specimen with lower air content, which usually obtains peak stress in nominal strain range of 0.003 to 0.004.
Figure 4: Typical stress-strain curves with 0.1 and 0.2 m/s compressive velocity.
The compressive strength gained at 0.1 and 0.2 m/s compressive velocities were 1.0 to 2.0 MPa (as shown in Table 2). In general, compressive strength of ice specimens with 0.5 s−1 strain-rate is slightly lower than that with 1.0 s−1 strain-rate. The air content influences the strength. Ice speci-men HA0.1mps_1 and HA0.1mps_3 with air content of 1.51% and 0.82%, respectively, gain strength of about 1.1 MPa, that is lower than the strength of about 1.7 MPa gained by ice specimen LA0.1mps_4 and LA0.1mps_5 which with air content of about 0.1%. Comparison of ice specimen HA0.2mps_1 and HA0.2mps_2 with LA0.2mps_5 and LA0.2mps_7 also confirms this viewpoint.
(a) (b) (c)
(d) (e) (f)
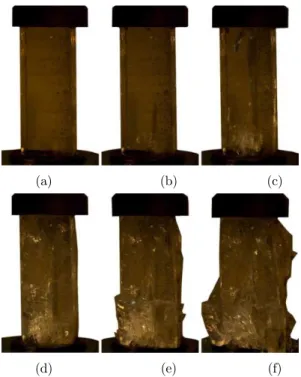
Figure 5: Failure processes of specimen LA0.1mps_4. Specimen possesses air content of 0.10%. (a)Pre-compression begins; (b)Cracks appear in both ends of specimen and cracks extend to middle; (c)Full height longitudinal through cracks form; (d)Ice columns form and stress reaches peak-stress; (e)Ice columns buckle; (f)Ice specimen totally fails.
(a) (b) (c)
(d) (e) (f)
Figure 6: Failure processes of specimen HA0.2mps_1. Specimen possesses air content of 2.10%. (a)Pre-compression; (b)Compression begins; (c)Cracks appear in both ends of specimen and cracks extend to middle section; (d)Stress
3.2 Compression of Ice with 1.0 and 2.0 m/s Compressive Velocity
Results of ice specimens at 1.0 and 2.0 m/s compressive velocity were presented in this sub-section. Seven specimens were conducted at compressive velocity of 1.0 m/s, among them five were LA ice specimens and two were HA ice specimens. Four specimens were conducted at compressive velocity of 2.0 m/s, two LA ice specimens and two HA ice specimens. The experimental parameters and results for these specimens were summarized in Table 3 and 4, respectively.
Test series Sample name Specimen dimensions Air content Length (cm) Width (cm) Height (cm) 1mps
LA1mps_4 7.8 7.9 20.0 0.14%
LA1mps_5 8.0 7.9 20.0 0.15%
LA1mps_6 7.8 7.9 20.0 0.10%
LA1mps_7 7.8 7.8 20.0 0.11%
LA1mps_8 7.8 7.9 20.1 0.17%
HA1mps_1 7.9 7.9 19.8 2.50%
HA1mps_2 8.0 7.8 19.9 2.01%
2mps
LA2mps_2 7.7 7.8 19.9 0.19%
LA2mps_3 7.8 7.9 19.9 0.08%
HA2mps_4 8.0 8.1 19.7 1.53%
HA2mps_5 8.1 8.0 19.7 1.37%
Table 3: Experimental parameters for compression of natural lake ice with 1.0 and 2.0 m/s compressive velocity.
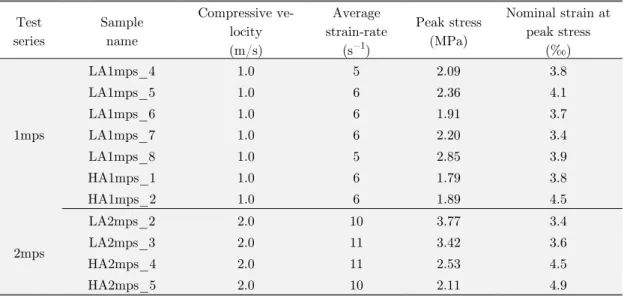
Test series Sample name Compressive ve-locity (m/s) Average strain-rate
(s−1)
Peak stress (MPa)
Nominal strain at peak stress
(‰)
1mps
LA1mps_4 1.0 5 2.09 3.8
LA1mps_5 1.0 6 2.36 4.1
LA1mps_6 1.0 6 1.91 3.7
LA1mps_7 1.0 6 2.20 3.4
LA1mps_8 1.0 5 2.85 3.9
HA1mps_1 1.0 6 1.79 3.8
HA1mps_2 1.0 6 1.89 4.5
2mps
LA2mps_2 2.0 10 3.77 3.4
LA2mps_3 2.0 11 3.42 3.6
HA2mps_4 2.0 11 2.53 4.5
HA2mps_5 2.0 10 2.11 4.9
Table 4: Experimental results for compression of natural lake ice with 1.0 and 2.0 m/s compressive velocity.
specimen HA2mps_4 and HA2mps_5 obtained strength of 2.53 and 2.11 MPa,respectively, while LA ice specimen LA2mps_2 and LA2mps_3 obtained strength of 3.77 and 3.42 MPa, respectively. The strength of HA ice are much lower than that of LA ice and the strength difference is more ob-vious than that of test series 1mps. Moreover, through comparing the peak stresses of ice specimens in test series 1mps and 2mps, it was obvious that the peak stress increases with an increase in strain rate, as was found in test series 0.1mps and 0.2mps.
Stress-strain curves show some particular features. Several peaks and valleys may exist in stress-strain curves both in ascending and descending branch (as show in Figure 7), this indicated both increase of stress and fracture of samples are gradually progressive process. Gradually progressive fracture may be the nature of uniaxial compression of ice at 5 to 10 s−1 strain rates.
Figure 7: Typical stress-strain curves with 1.0 and 2.0 m/s compressive velocity.
(a) (b) (c)
(d) (e) (f)
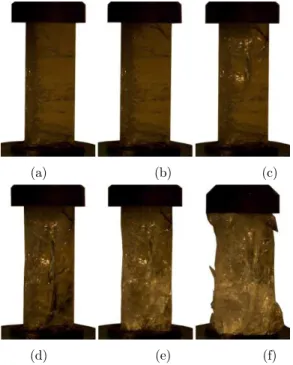
Figure 8: Failure processes of specimen LA2mps_3. Specimen possesses air content of 0.08%. (a)Pre-compression; (b)Compression begins; (c)Lots of cracks appear in upper end of specimen and cracks extend downward; (d) Lots of
interwoven incline cracks form in full height of specimen and stress reaches peak-stress; (e)Upper end begins to fragment and lower half separate into large ice floes; (f)Ice specimen totally fails.
(a) (b) (c)
(d) (e) (f)
Figure 9: Failure processes of specimen HA1mps_2. Specimen possesses air content of 2.01%. (a)Pre-compression; (b)Compression begins; (c)Lots of cracks appear in upper end of specimen and cracks extend downward; (d)Cracks propagate the full height of specimen; (e)Stress reaches peak-stress, both ends begin to fragment and separate into
3.3 Compression of Ice with 5.0, 10.0 and 15.0 m/s Compressive Velocity
Three series of experiments are presented in this sub-section, they are test series 5mps, 10mps and 15mps. Three LA ice specimens are included in test series 5mps, four LA ice specimens in test series 10mps, four LA ice specimens and two HA ice specimens in test series 15mps. The experimental parameters and results for these specimens are summarized in Table 5 and 6, respectively.
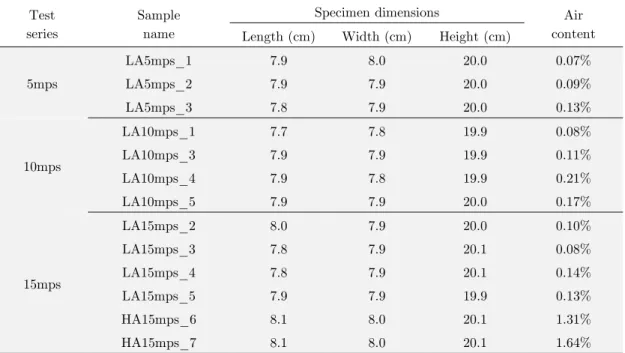
Test series
Sample name
Specimen dimensions Air content Length (cm) Width (cm) Height (cm)
5mps
LA5mps_1 7.9 8.0 20.0 0.07%
LA5mps_2 7.9 7.9 20.0 0.09%
LA5mps_3 7.8 7.9 20.0 0.13%
10mps
LA10mps_1 7.7 7.8 19.9 0.08%
LA10mps_3 7.9 7.9 19.9 0.11%
LA10mps_4 7.9 7.8 19.9 0.21%
LA10mps_5 7.9 7.9 20.0 0.17%
15mps
LA15mps_2 8.0 7.9 20.0 0.10%
LA15mps_3 7.8 7.9 20.1 0.08%
LA15mps_4 7.8 7.9 20.1 0.14%
LA15mps_5 7.9 7.9 19.9 0.13%
HA15mps_6 8.1 8.0 20.1 1.31%
HA15mps_7 8.1 8.0 20.1 1.64%
Table 5: Experimental parameters for compression of natural lake ice with 5.0, 10.0 and 15.0 m/s compressive velocity.
Ice specimens of test series 5mps obtain average strength of 6.73 MPa, 8.31 MPa for test series 10mps and 8.18 MPa for test series 15mps. Results of LA ice specimens conducted at different strain rates indicates that in the strain-rate of 25 to 75 s−1, uniaxial compressive strength increases with increasing strain-rate. Air content seems to have influence on strength. Specimen HA15mps_6 and HA15mps_7, with air content of 1.31% and 1.64%, obtains average strength of 6.96 MPa, this value is lower than that of LA ice specimens at 15.0 compressive velocity.
Test series
Sample name
Compressive velocity
(m/s)
Average strain-rate
(s−1)
Peak stress (MPa)
Nominal strain at peak stress
(‰)
5mps
LA5mps_1 5.0 26 5.03 4.6
LA5mps_2 5.0 26 7.75 3.6
LA5mps_3 5.0 26 6.33 4.2
10mps
LA10mps_1 10.0 51 7.19 5.4
LA10mps_3 10.0 51 10.05 4.4
LA10mps_4 10.0 51 9.45 4.5
LA10mps_5 10.0 51 6.58 5.3
15mps
LA15mps_2 15.0 76 8.52 7.6
LA15mps_3 15.0 77 8.15 7.6
LA15mps_4 15.0 78 8.08 6.3
LA15mps_5 15.0 78 7.97 5.0
HA15mps_6 15.0 78 8.39 8.8
HA15mps_7 15.0 75 5.53 6.8
Table 6: Experimental results for compression of natural lake ice with 5.0, 10.0 and 15.0 m/s compressive velocity.
Figure 10: Typical stress-strain curves with 5.0, 10.0 and 15.0 m/s compressive velocity.
specimens, rough conception can be obtained from the limited images. Cracks first appear in the upper end of specimen, as has been observed in compression of ice with 1.0 and 2.0 m/s compressive velocities. As the number of cracks in the upper end reaches a certain level, stress reaches its peak stress. At this moment, the upper end is full of cracks (as shown in Figure 11 c and Figure 12 c), while little or no cracks emerge in the remaining parts of specimen. Then the fragments in the up-per end begin to fly out along horizontal direction, and cracks propagate downward, ice specimens fail from top to bottom gradually. The carrying capacity of ice specimen is dominated by its upper end, fracturing into fragments of the upper end means the failure of the whole ice specimen. The fracture mode in strain rates range of 25 to 75 s−1 is fracturing into lots of small fragments through cracks nucleation mechanism. Cracks propagation mechanism is not dominated in determining ice strength.
(a) (b) (c)
(d) (e) (f)
Figure 11: Failure processes of specimen LA5mps_2. Specimen possesses air content of 0.09%. (a)Pre-compression; (b)Compression begins; (c)Upper end of specimen is full of lots of cracks and separated into lots of micro-scale
(a) (b) (c) (d)
(e) (f) (g) (h)
Figure 12: Failure processes of specimen LA10mps_1 and LA15mps_2. Both specimens possess air content of about 0.10%. (a) – (d) refers to specimen LA10mps_1 and (e) – (h) refers to LA15mps_2. (a) and (e) Pre-compression; (b) and (f)Cracks are full of the upper ends, peak stress is obtained; (c) and (g)
Number intensity of cracks increases in the full height; (d) and (h)Fragments begin to fly out.
4 DISCUSSION
4.1 Strain-Rate Effect on Compressive Strength of Natural Ice
The seven series of experiments could be classified into two categories based on air content con-tained in ice specimens: (i) Experiments of lower air content ice at different strain rates (LA ice) and (ii) Experiments of higher air content ice at different strain rates (HA ice).
Figure 13: Compressive strength of natural lake ice in the strain-rate range of 0.5 to 75 s−1 at −0.1 °C.
Figure 14: Compressive strength of ice over wide strain-rate range from 10−8 to 103 s-1 at near melting point temperature and −10 °C.
results of Jones et al (2003) are uniaxial compressive strength of iceberg ice over a very wide strain-rate range (10−8 to 101 s−1). According to studies of Yuan and Jones et al, though their testing temperatures are different, it is obvious to find uniaxial compressive strength of ice does not con-sistently increase with increasing strain-rate in the wide strain-rate range.
is more consistent with current actual observations. But there are still some suspicions, it should be noted that rock and concrete, they are also brittle materials, while uniaxial compressive strength of these materials does not show strength reduction trend in the wide strain-rate range (Bischoff &Perry, 1991; Zhang & Zhao, 2014). In recent ten years, ice mechanical properties over elevated strain-rate, i.e. 101 to 103 s−1, were investigated with increasing interests. Most of these work showed that compressive strength increases with increasing strain-rate in this strain-rate range. While, how compressive strength varies with strain-rate in the middle strain-rate range still confuses us. Before giving a firm conclusion, further systematical uniaxial compression experiments should be carried out over strain-rate range of 10−3 to 101 s−1.
4.2 Air Content Effects on the Uniaxial Compressive Strength
Air content is also one of factors that influence ice strength. Generally, air content contained in freshwater ice is much lower than that in sea ice. Sea ice contains not only air bubbles but also many brine pockets (Cole, 2001), both of them belong to pore volume. Compressive strength of sea ice is related to temperature and porosity, and strength decrease with increasing porosity (Timco and Weeks, 2010). In present study, compressive strength of ice specimen with higher porosity is also lower than that with lower porosity (as shown in Figure 13), this agrees with the results of previous experiments conducted at quasi-static strain-rate (Schwarz and Weeks, 1977; Timco and Frederking, 1990; Timco and Weeks, 2010). This fact indicates that air content or porosity also has an influence on the uniaxial compressive strength in moderate strain-rate range. The strength de-creases with increasing of air content. Timco and Frederking (1990) developed a model to calculate the strength of sea ice sheets under quasi-static situation, for horizontally-loaded columnar sea ice, the uniaxial strength is in the following form:
(
1 270)
c Ae T
s = - n (1)
Where nT is porosity and unit is in parts per thousand (ppt), Aeis a constant relating to strain-rate. According to Equation 1, a specimen with porosity of 0.1% gets strength of about 1.3 times that of a sample with 2.0% porosity. In present study, compressive strength of LA ice specimens is about 1.5 times strength of HA ice specimens, indicating that porosity sensitivity of uniaxial com-pressive strength at high strain rates is in consistent with that at quasi-static strain rates. While before drawing a firm conclusion, many further investigations are needed.
4.3 Fracture Modes of Ice at Moderate Strain Rates
splits into several ice columns along the vertical full height cracks. Every ice column can alone bear a certain load, when the load exceeds the carrying capacity of ice column, this column may buckle, then the load redistributes and other columns may fail. In short, longitudinal splitting accompany-ing bucklaccompany-ing is the major fracture mode in the strain rate range of 0.5 to 10 s−1. The peak stress is usually obtained when ice specimen begins to split (Sketch as shown in Figure 16).
(a) (b) (c)
Figure 15: Vertical full height crack forming in ice specimen. (a)No vertical through crack; (b) Vertical full height crack perpendicular to the grain columns; (c)Vertical full height crack along the grain columns.
(a) (b) (c) (d)
Figure 16: Sketch of fracture process of ice under uniaxial compression in strain-rate range of 0.5 and 1 s−1.
(a) Cracks initially emerge in the upper and lower end of specimen; (b) Cracks extend toward middle part and number intensity of cracks increases; (c) Linkage of cracks lead to formation of longitudinal full height splitting cracks,
(a) (b) (c)
Figure 17: Sketch of fracture process of ice under uniaxial compression in strain-rate range of 25 to 75 s−1. (a) Cracks firstly emerge in the upper end of specimen; (b) Cracks increases in number and propagate downward,
when the upper half is full of inclined cracks, peak stress is obtained; (c) The upper end crushes into fragments and failure zone moves downward, with fragments flying out at the same time.
When strain-rate is in the range of 25 to 75 s−1, ice specimen shows different fracture mode. The sketch of fracture process in this strain-rate range is shown in Figure 17. Micro cracks are first found only in the upper end of ice specimen, ice in this section is separated into lots of small frag-ments as lot of incline cracks form. When these fragfrag-ments begin to detach with each other, the peak stress is obtained. As deformation of ice increases, fragments begin to fly out along horizontal direc-tion and cracks propagate downward and new region of fragments forms. In short, crushing into fine fragments controls the fracture process in the strain-rate range of 25 to 75 s−1; this is definitely dif-ferent from splitting accompanying buckling fracture mode in the strain-rate range of 0.1 to 10 s−1.
Cylindrical specimens of dimensions 4 to 8 cm in diameter and 4 to 5 cm in height was em-ployed in drop test conducted by Fasanella et al. (2006). Study of Fasanella et al showed ice crushed into lots of small fragments as compressive velocity higher than 12 m/s and ice fractured into relatively large fragments instead as velocity lower than 12 m/s. This observation also indicates ice fracture mode varies with compressive velocity, consistent with observation in present experi-ment, though the compressive velocities corresponding to transition of fracture mode are different. Unsustainability of compressive velocity in drop test may interpret the higher transition velocity, instead of about 5.0 m/s in present experiment.
compressive velocity, i.e. higher than 5 m/s, propagation of cracks needs certain time and the spec-imen is compressed so quickly, the cracks are too late to extend a far distance. Lots of energy can-not be released in time, therefore energy needed to nucleation is satisfied, and then massive crack nucleation happens. So many short cracks were found in the upper end of ice specimen. With higher strain-rate, more crack nucleation processes are demanded to release the larger energy, so the strength increases with increasing strain-rate. Insufficient time for cracks to propagate a long dis-tance under high compressive velocity condition may be the inducement to transition of fracture mode.
5 CONCLUSIONS
In present experiments, two categories of natural lake ice specimen—one possesses air content of about 0.1% and the other possesses air content of 1% to 2%—are contained. Seven different com-pressive velocities, corresponding to nominal strain-rates 0.5, 1.0, 5.0, 10, 25, 50, 75 s−1, respectively, were employed. The testing temperature is −0.1 °C, a near melting point temperature. All ice spec-imens are dspec-imensions of 8 cm by 8 cm in cross section and 20 cm in length. High-speed camera was employed to capture fracture process of ice. Based on the experimental results, the following conclu-sions can be drawn:
(1) At near melting point temperature (−0.1 °C), uniaxial compressive strength of natural lake ice ranges from 1.0 to 10.0 MPa over strain-rate range of 0.5 to 75 s−1.
(2) Uniaxial compressive strength of natural lake ice increases with increasing strain rate in em-ployed strain-rate range, and this trend is not influenced air content.
(3) Air content or porosity influence the uniaxial compressive strength, ice trends to be weaker with higher air content.
(4) Ice fracture mode depends on strain-rate (or compressive velocity). In the strain rate range of 0.5 to 10 s−1, longitudinal splitting accompanying buckling is the major fracture mode. In the strain-rate range of 25 to 75 s−1, crushing into fine fragments controls the fracture process, ice spec-imen crushes into fine fragments due to insufficient time for micro cracks to propagate, and then resulting in higher strength.
Acknowledgements
References
Bischoff, P.H., Perry, S.H., 1991. Compressive behaviour of concrete at high strain rates. Materials and structures, 24(6): 425-450.
Cole, D.M., 1987. Strain-rate and grain-size effects in ice. Journal of Glaciology, 33(115): 274-280.
Cole, D.M., 2001. The microstructure of ice and its influence on mechanical properties. Engineering Fracture Me-chanics, 68(17–18): 1797-1822.
Combescure, A., Chuzel-Marmot, Y. and Fabis, J., 2011. Experimental study of high-velocity impact and fracture of ice. International Journal of Solids & Structures, 48(20): 2779–2790.
Dempsey, J.P., 2000. Research trends in ice mechanics. International Journal of Solids & Structures, 37(1–2): 131-153. Dutta, P.K., Cole, D.M., Schulson, E.M. and Sodhi, D.S., 2004. A Fracture Study of Ice Under High Strain Rate Loading. International Journal of Offshore & Polar Engineering, 14(3): 182-188.
Fasanella, E.L., Boitnott, R.L. and Kellas, S., 2006. Test and analysis correlation of high speed impacts of ice cylin-ders, 9th International LS-DYNA Users Conference.
Guo-Bin, X.U., Da-Ran, L.I., Yan, H. and Xin, Z., 2010. Laboratory study of problems in ice mechanics encountered in the Middle Route of South-to-North Water Transfer Project. Advances in Water Science, 21(6): 808-815.
Hawkes, I., Mellor, M., 1972. Deformation and fracture of ice under uniaxial stress. Journal of Glaciology, 11(61), 103-131.
Jones, S.J. and Chew, H.A.M., 1983. Effect of sample and grain size on the compressive strength of ice. Annals of Glaciology, 4: 129-132.
Jones, S.J., 1997. High Strain-Rate Compression Tests on Ice. Journal of Physical Chemistry B, 101(32): 6099-6101. Jones, S.J., 2007. A review of the strength of iceberg and other freshwater ice and the effect of temperature. Cold Regions Science & Technology, 47(3): 256-262.
Jones, S.J., Gagnon, R.E., Derradji, A. and Bugden, A., 2003. Compressive strength of iceberg ice. Canadian Journal of Physics, 81(1-2): 191-200(10).
Kim, H. and Keune, J.N., 2007. Compressive strength of ice at impact strain rates. Journal of Materials Science, 42(8): 2802-2806.
Lachance, J., and Michel, B., 1987. Experimental study of the brittle behaviour of iceberg ice. Proc. POAC’87, 3. Fairbanks, Alaska, pp. 11-19.
Lange, M.A. and Ahrens, T.J., 1983. The dynamic tensile strength of ice and ice-silicate mixtures. 88(B2): 1197-1208. Meglis, I.L., Melanson, P. and Jordaan, I.J., 1998. High speed testing of freshwater granular ice. Contractor Report. Michel, B., 1978. Ice mechanics. University of Laval Press, Cite Universitaire, Quebec, Canada G1K 7P4.
Mu, X.P., Chen, W.X., Cui, W. and Guo, X.C., 2011. Study on the characteristics of flow in Middle Route of South-to-North Water Transfer Project during freezing period. Journal of Hydraulic Engineering, 42(11): 1295-1307. Schulson, E.M. and Duval, P., 2009. Creep and fracture of ice. Cambridge University Press.
Schulson, E.M., 1997. The Brittle Failure of Ice under Compression. Journal of Physical Chemistry B, 101(32): 6254-6258.
Schulson, E.M., 2001. Brittle failure of ice. Engineering Fracture Mechanics, 51(1): 1839-1887.
Schwarz, J. and Weeks, W.F., 1977. Engineering properties of sea ice. Journal of Chemical Physics, 37(1): 197-198. Shazly, M., Prakash, V. and Lerch, B.A., 2009. High strain-rate behavior of ice under uniaxial compression. Interna-tional Journal of Solids & Structures, 46(6): 1499-1515.
Sinha, N.K., 1981. Rate sensitivity of compressive strength of columnar-grained ice. Experimental Mechanics, 21(6): 209-218.
Sinha, N.K., 1982. Constant strain- and stress-rate compressive strength of columnar-grained ice. Journal of Materi-als Science, 17(3): 785-802.
Timco, G.W. and Frederking, R.M.W., 1990. Compressive strength of sea ice sheets. Cold Regions Science & Tech-nology, 17(3): 227-240.
Timco, G.W. and Weeks, W.F., 2010. A review of the engineering properties of sea ice. Cold Regions Science & Technology, 60(2): 107-129.
Wu, X. and Prakash, V., 2015. Dynamic strength of distill water and lake water ice at high strainrates. International Journal of Impact Engineering, 76: 155–165.
Yuan, Z., 2010. Research on Inland River Ice Mechanical Property and Ice Impact Force on Bridge Pier. Doctoral Thesis, Northeast Forestry University.
Zhang, Q.B., Zhao, J., 2014. A review of dynamic experimental techniques and mechanical behaviour of rock materi-als. Rock mechanics and rock engineering, 47(4): 1411-1478.
APPENDIX
Reliability and Accuracy of Nominal Strain-Rate Derived from Actuator Compressive Velocity
Figure A-1: Simplified compression test system.
sample acuator fixtures loadcell otherpart
H =L +L +L +L +L (A-1)
Where Lsample, Lacuator, Lfixtures, Lloadcell denotes length of ice sample, actuator, test fixtures, and load cell, respectively. Lother part is the length of other parts. For the total height H keep
un-changed, so the recorder displacement dR should be equal to the summation of deformation of sam-ple dI, deformation of actuator dA, deformation of load cell dL, deformation of fixtures dF and deformation of other parts dO.
(
)
R I A L F O =0
H d d d d d d
D = - + + + + (A-2)
Then:
R= I A L F O
d d +d +d +d +d (A-3)
As deformation could be expressed by total forceFand stiffness k,d=F k, so the ratio of
de-formation of actuator and dede-formation of sample could be expressed as:
A I
I A
k k
d
d = (A-4)
Ratio of deformation of load cell and deformation of sample:
L L I I k k d
d = (A-5)
Ratio of deformation of fixtures and deformation of sample:
F F I I k k d
d = (A-6)
Ratio of deformation of other parts and deformation of sample:
O O I I k k d
d = (A-7)
Where kI, kA, kL , kF and kO denote stiffness of ice sample, actuator, load cell, test fixtures and other parts, respectively.
Substituting Equation A-4 to A-7 in Equation A-3 yields:
(
)
I= R 1 kI kA kI kL kI kF kI kO
d d + + + + (A-8)
The average normal strain-rate of ice sample eI could be expressed as:
(
)
I= I LI t
Where Substituting Equation A-8 in Equation A-9 finally yields:
(
)
RI
I
1 =
t
1 kI kA kI kL kI kF kI kO L
d
e ⋅
⋅ D
+ + + +
(A-10)
According to Equation A-9, nominal strain-rate derived from displacement of machine recorder displacement dR is higher than actual nominal strain-rate of ice sample, and the former is
(
1+kI kA +kI kL +kI kF +kI kO)
times the latter.For a certain machine, stiffness of every component is a given value, given the stiffness of sam-ple, values of kI kA, kI kL , kI kF , kI kO can be calculated. For Instron VHS High Rate Testing
System adopted in present experiment, the length of actuator is 60 cm and the diameter is 3 cm, stiffness of load cell is about 6.0 kN/μm. Young’s modulus of high strength stainless steel is about 200 GPa, then the stiffness of actuator is about 0.236 kN/μm. Cross section of ice sample is 8cm by 8 cm, and 20 cm in height, assuming Young’s modulus of ice is about 5 GPa, then the stiffness of ice sample is about 0.160 kN/μm. Now we have:
=68.5%
I A k k
kI kL=2.7%
The stiffness of test fixtures cannot be determined very well, while if the fixtures are mounted tightly, their deformation could be neglected. Stiffness of other parts may be related to contacts between sample and platen. If sample is not smooth and parallel, poor contacts may lead to low stiffness, then deformation between contacts cannot be ignored. In present study, ice samples were machined as smooth and parallel as possible in order to reduce contacts deformation. Though ice samples were well prepared, the value of kI kO is difficult to calculate.
For the machined and ice samples employed, apart from the contribution of kI kF and kI kF ,
the value of
(
1+kI kA +kI kL +kI kF +kI kO)
is about 2. Therefore, according to EquationA-10 the actual nominal strain-rate of ice sample is only half of nominal strain-rate derived from dis-placement of machine recorder disdis-placement dR, or may be less than half.