Statistis of Plasma Flutuations in
Runaway Disharges in TCABR Tokamak
M.S. Baptista, I.L. Caldas, W.P. de Sa, and J.I. Elizondo
InstitutodeFsia,UniversidadedeS~aoPaulo
C.P.66318,CEP05315-970S~aoPaulo,S.P.,Brasil
Reeivedon26June,2001
InthisworkweanalyzethespikesintheH
emission,anddensityturbuleneinrunawaydisharges
intheTCABRtokamak. Fortheplasmaedgedensityutuations,wenda
symmetri-reurrent-type turbulene,with thesame statistis foundinmeasures oflow-dimensional reurrent haoti
systems.Fortheplasmaoreutuations,wenotethatthelinedensityosillationsaresynhronized
to theH osillations. Inaddition,we suggestthat boththe onsetof theH spikesandthe line
densityosillationsaretriggeredbyaproesssimilartothebifurationresponsiblefortheringof
neurons.
I Introdution
Thegenerationofrunawayeletronsduring
disrup-tions is a ommon feature of tokamaks [1℄. They an
be a severe problem in some experiments sine their
losstothewallmayausesevereloalizedsurfae
dam-age. It is thus desirable to study plasma disharges
with runawayprodution as wellas methods to avoid
this prodution.
Anewregime ofrunawaydishargesisobtainedin
TCABR initiating the disharge with low lling
pres-sure and, after the initial urrent rise, maintaining a
largellingrate[2℄. Themagnetionnementis
pro-vided mainlybytherunawaybeam. Inthisregimethe
plasma proles are kept approximately onstant, the
H
emission inreases substantially and shows strong
spikes, possibly triggeredby the relaxationinstability
typial of runaway disharges. As the lling rate
in-reases further, the spikeperiod dereases andits
be-haviorhangesinatransitionsimilartothoseobserved
in experimentsin largetokamaks[3℄.
Thedishargeshaveaplasmaurrentaround70kA,
loopvoltageof1V,Z
eff
>4, 0.1. Plasmadensity
of 2.5x10 19
m 3
in the ore and 1 10 19
m 3
at the
edge.
Inthiswork,weonsiderosillationsobserved
dur-ing approximately 10 ms of the stationary phase of
eleven runawaydishargeswith onstantloopvoltage,
meanplasmaurrent,andplasmadensity. Weanalyze
thesequeneofsharpspikesintheH
emission,
orre-lated with positive spikesin the line density, negative
and positivespikesin the loopvoltage, smalloutward
displaementsintheradialplasmaposition,andbursts
spikesourinwholeplasmaandtheirshapeand
repe-titionfrequenyhangewiththellingrate. Forthese
disharges,weanalyzealsothelinedensityosillations
simultaneouslymeasuredat theplasma edge and
en-ter.
The main interest of this work is to nd invariant
statistis in the reported new runaway regime. We
hoose to work with two types of data, one
present-ing turbulent behavior, the utuating density, and
theotherpresentingamoreregular,however,
undeter-minedbehavior,theH
emission. Attheplasmaore,
thedensitypresentspeaksofosillationwhihhappens
in synhrony with theH
peaks. As wemeasure this
utuationawayfromthe ore,near theplasma edge,
thedensity beomes moreturbulentand not
synhro-nizedwiththeH
peaks. Theprobabilitydistribution
of this density utuationis a symmetriPoisson-like
and the data is reurrent. These properties are
typi-al of reurrent low-dimensional haoti systems that
presentaPoisssondistributionforthereturningtimes.
For the H
emission we found some laws for the
peaksshapethatmightgiveusindiationofthe
physi-alproessrelatedto thisline emissions. Inpartiular
we found that the relation between the width of the
peaks and their heights follows a logarithmi law. A
onsequeneof this lawis that the spike should have
anexponentialdeay. Infat,weobservethat theH
spikeissimilartospikeinneurons,whatsuggeststhat
thedynamisbehindthetriggeringofthespikein
neu-rons might desribe the H
spikes (and also the line
linear law bothwith the time interval between spikes
or with the spikeheigth. Eah law are haraterized
bytwodierentoeÆients,whihreetthehangeof
osillationfrequenyobservedin theH
emissions. In
fat,forallthedishargesanalyzed,weseetworegimes
forthe H
emission. Inthersthalf of thedisharge,
thetimebetweenthespikesare shorterandthe peaks
are smaller. On the seond half of the disharge, the
ontraryhappens,i.e.,thetimebetweenthespikesare
largerbut thepeakstaller.
II Statistial Analysis
The plasma in this high-density runaway
dis-harge is haraterized during the at-top by
station-aryplasmaproles. Asanexampleweshowtheplasma
urrentproleinFig.1.
0
100
200
t (ms)
0
20
40
60
80
100
I
p
(kA)
Figure1.Theplasmaurrentforarunawayplasmashot.
Wedene D
n
for thevalue of the density
utua-tion D(n) at the time t = n, where =4 s is the
sampling rate. Fig. 2showsD
n
for the plasma edge
andfortheplasmaore. WedeneR
n
asthedierene
R
n =D
n+1 D
n
: (1)
The utuating dierene is reurrent, i. e., its
am-plitudeeventuallyomebakto arefereneintervalof
valueswithsize of 2Æ at =0. Next,in this gure,we
dene the returning time, T
n
, as the interval of time
in whih R
n
repeats avalue inside a hosenreferene
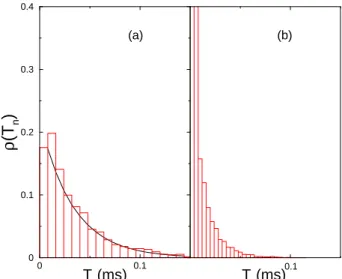
interval. TheprobabilitydistributionsofT
n
in
normal-izedunits(T
n
),obtainedforthedataofFigs. 2(a-b),
an be seen in Figs.3(a-b) respetively. We see that
bothdata,from theplasmaoreandedge,havea
dis-tribution of the return time given by a Poisson [4℄ of
0
20
40
60
80
100
120
140
t (ms)
(a)
(b)
0
5
10
15
5
10
15
Density (x 10
18
m
−3
)
Density (x 10
18
m
−3
)
Figure 2. Plasma density at the edge (a)and at the ore
(b).
0
0.1
0
0.1
0.2
0.3
0.4
ρ
(T
n
)
0.1
T
n
(ms)
T
n
(ms)
(a)
(b)
Figure3.DistributionforthereturntimeT
n
intheplasma
edge(a)andintheplasmaore(b).
[T
n ()℄=
1
2<T
n >
e T
n =<T
n >
(2)
NotethatthisPoissondistributionsareinvariantto
dif-ferenttimeintervals.
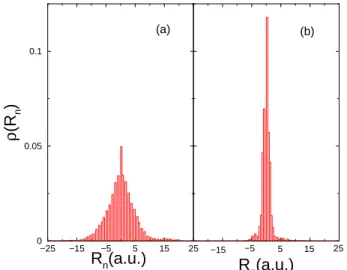
WealsondthattheprobabilitydistributionofR
n ,
(R
n
), in the plasma edge shown in Fig. 4a is a a
Poisson-likedistribution representedas[4℄
[R
n ()℄=
1
2<R +
n >
exp
(jRn <Rn>j=<R +
n >
); (3)
whih orresponds to a sum of two Poisson
distribu-tions,where<R
n
>istheaverageoftheR
n
'sandR +
n
representsR
n
biggerthan<R
n
>. ThisPoisson-likeis
haraterized bythe average width ofthe distribution
whih isequalto <R +
n
>. Note thatthe distribution
form is invariant to dierenttime intervalsof the
den-−25
−15
−5
5
15
25
R
n
(a.u.)
0
0.05
0.1
ρ
(R
n
)
−15
−5
5
15
25
(a)
(b)
R
n
(a.u.)
Figure 4. The probability distribution of R
n
, for plasma
edge (a) and ore (b) density utuations, alulated
re-spetivelywiththedataofFig. 2(a-b).
Forthe typeof turbulene observedat the plasma
edge,weansaythatthereturntimeT
n
isstatistialy
equivalent to the density dierene, R
n
. In addition,
these variables are also statistially equivalent to the
rst Poinarereturn time, whih measures thetime a
haotitrajetorytakestoreturntoagivenintervalof
values. Infat, forhaotisystemsweare ableto
ex-plain the reasonfor whih the distributionof R
n is a
symmetriPoisson-likedistributionandalsothereason
for whih thedistributionof T
n
isaPoisson. This
ap-proahonsidersthat theobservedreurreneisresult
of theexistene ofan unountable numberofperiodi
orbits embedded in the observed set. More details of
this equivalenean befoundin [5,6℄.
Fig.5ashowsthe H
emission. One we are
inter-ested in analysing the shape ofthe spikes,weput the
base of thespikesin to thesamegroundlevel. Wedo
thisbysubtratingthedataoftheH
withitsrunning
average alulated over a time interval of 100. The
treateddata anbeseeninFig.5b,where weindiate,
in thesmall box, the referenevalue with whih we
alulatethetimeintervalofthespikeÆT,andthetime
betweentwospikes,representedbyT. Notethat the
frequenyof appearane ofthepeaksin Fig. 5ais the
sameoftheabrupthangeofthedensityprolein the
plasma ore of Fig.2b. Therefore, the density
osilla-tionin theplasmaoreisphasesynhronizedwiththe
H
emission.
Muh an be understood of the dynamis behind
the H
emissionnding orrelationsbetweenthe time
width ofthespikes,ÆT (thatwereeraspeakwidth),
and the time interval between two spikes, T, for a
given. Toimprove thestatistis of ouranalysis, we
use aonatenatedle with data from the eleven
dis-harges. ForT >1:57ms,and =0:05,wefoundan
exponentialdeay, withoeÆientof 1:600:09,for
the probabilitydistributionofT asshownin Fig. 6.
spikestoouratmostwithinthetimeforthe
distribu-tiontodeayhalf. Therefore,weexpetT <2:00ms.
0
50
100
150
200
t (ms)
−1
0
1
2
3
H
α
(n.u.)
−1
0
1
2
(a)
(b)
H
α
(n.u.)
∆
T
δ
T
χ
Figure5. Hemission(a)andnormalized H (b)by
run-ningaverages. Inthesmallboxof(b),foragivenreferene
,thetimeinbetweenspikesisrepresentedbyT,andthe
timeintervalofthespikeisrepresentedbyÆT.
0
2
4
∆
T (ms)
0
20
40
60
80
ρ
(
∆
T)
Figure6. Distributionof timeintervalbetween twospikes
T, for 11 disharges in the runaway regime. The solid
urveindiatesanexponentialdeayforhighT.
Duetothefatthatthespikesourintwodierent
frequenyregimes,amoreappropriatevariabletolook
atisthedierenebetweentwotimeintervals,i.e.,
n
=T
n+1 T
n
: (4)
ThisnewvariablehasasymmetriPoisson-like
proba-bilitydistribution, shown in Fig.7, indiationthat the
dynamisbehindthetriggeringofthespikeanbethe
resultoflow-dimensionalsystems.
Itisinterestingtounderstandtherelationbetween
therefereneoftheH
peakemissionwithrespetto
be-wealulateaveragesvaluesofT andÆT,denoted
re-spetivellyby<T >and<ÆT >,foragivenalong
the11 disharges. In Fig.8weshowthree salings
re-lating < ÆT > with respet to the referene value
(a), <T >with respetto (b), and<T >with
respetto <ÆT >. Notethat (a)isalogarithmilaw,
while in (b-) we havelinear relations. This
logarith-midependene isonsequeneofthegeometrishape
ofthe spike. Itis alsoworthwhileto ommentthat in
both(b)and(),wendlinearlawswithtwodierent
oeÆients,whihisaonsequeneofthefatthatthe
timebetweenspikesfortheseondhalfofthedisharge
isshorterthantheoneinthersthalfofthedisharge.
−400
−200
0
200
400
ξ
n
0
50
100
150
ρ
(
ξ
n
) (arb. units)
Figure7. Distributionofthedierenen,for11disharges
intherunawayregime. Thesolidurveindiates an
expo-nentialdeay.
0.02
0.04
0.06
0.08
<
δ
T (ms)>
1.5
2
2.5
3
3.5
4
<
∆
T (
m
s)>
0
0.1
0.2
0.3
0.4
0.5
χ
(n.u.)
0.02
0.04
0.06
0.08
0.1
<
δ
T (
m
s)>
0
0.1
0.2
0.3
0.4
0.5
χ
(n.u.)
1.5
2
2.5
3
3.5
4
<
∆
T (
m
s)>
(a)
(b)
(c)
Figure8.Salinglawsshowingthelogarithmdependeneof
<Æt>withrespettothereferenevalue(a),thelinear
dependeneof<T>withrespetto(b),andthelinear
dependeneof<T >withrespetto<Æt>.
TheonsequeneofhavingalogarithmilawinFig.
8aisthattheH
spikeshould haveanexponential
de-the funtion Atanh(Bt)e Bt
. The result an be
seen in Fig.9. The use of this partiular tting
fun-tionisduetothefatthatittswellspikesinneurons.
Therefore, this suggeststhat thedynamis (a
bifura-tion) behindthetriggeringofspikesinneurons[7℄an
explainthetriggeringofthespikesintheH
emission.
−0.2
0
0.2
0.4
0.6
0.8
A tanh(B t)*e
−B t
, (t>0)
H
α
spike
t (
µ
s)
0
5
10
Figure 9. Filled squares shows one H spike and in the
straightline thettingfuntion.
III Conlusions
Therearefourpropertieswenotieasweompare
the utuatingplasma density on theore to that on
theedge. Inreaseofutuationamplitude,symmetry
in the distribution form of R
n
, invariane of the
dis-tributionsformfordierenttimeintervals,and
preser-vation of short and long range orrelations. The rst
threepropertiesaredisussedinthisworkandthelast
oneis reportedinRef. [5℄.
Thesymmetryobservedinthedensityplasmaedge
is named symmetri-reurrent-type turbulene. It is
reurrent beause of the symmetry of the probability
distribution. It is reurrent beause the statistis of
thereturntimeisequivalentto thestatistisof return
timesofhaotitrajetories.
Weseethat theH
spikeissimilartospikein
neu-rons. That suggests the dynamis that governs the
triggering of the spike in neurons might desribe the
dynamis behind the triggering of the H
emission.
Furtherworkould,indeed,presribeproeduresin
or-dertobeabletoavoidsuhbifuration, andtherefore,
avoidtheonsetof H
emissions. Inaddition,one the
H
emissionissynronoustothedensityintheplasma
ore,thisbifurationproessouldalsoexplainthe
Finally, the equivalene betweenthe reurrene in
dynamial systems and the reurrene in this speial
turbulentregime,allowsustodesribetheevolutionof
measurementsinthistypeofturbulenewithmeasures
oflow-dimensionaldynamialsystems.
Aknowledgements This work was partially
sup-ported by Brazilian governmental agenies FAPESP,
CNPq, andCAPES.
Referenes
[1℄ A.Wesson,R.D.Gill,H.Hugonetal.,Nul.Fus.29,
641(1989).
[2℄ R. M. O. Galv~ao et al., to appear in Plasma Phys.
Contr.Fus.
[3℄ R.D.Gill,Nul.Fus.33,1613 (1993).
[4℄ I.L.Caldas,M.S.Baptista,C.S.Baptista,A.A.
Fer-reiraeM.V.A.P.Heller,PhysiaA287,91(2000).
[5℄ M.S.Baptista,I.L.Caldas,M.V.A.P.Heller,A.A.
Ferreira,\OnsetofSymmetriPlasmaTurbulene",to
appearinPhysiaA.
[6℄ M. S.Baptista, I. L. Caldas, \Stok Market
Dynam-is",submittedforpubliation.
[7℄ E.M.Izhikevih,Int. J.ofBifurationandChaos10,