Analysis of Radar Cross Section Reduction
of Fighter Aircraft by Means of Computer
Simulation
Luiz Alberto de Andrade1, Luan Silva Carvalho dos Santos1, Adriana Medeiros Gama1
INTRODUCTION
he goal to reduce a military aircrat’s RCS is directly related to the distance at which it can be detected by hostile radars. he radar equation given below (Eq.1) provides a quantitative way to analyze the impact of a target’s RCS reduction in its distance for monostatic radars (Knott et al., 1993):
R
max = [(PtG
2λ2σ) / (4π)3 P minL)]
1/4 (1)
Where: R
max is the maximum range of the radar detection, Pt is
the radar antenna’s transmission power, P
min is the minimum
power detected by the radar, G = G
r = Gt is the radar gain, L are
the losses associated to the radar electronics and the environment, and σis the RCS (Gama and Rezende, 2010; CST, 2012).
When analyzing Eq.1, it is revealed that among the variables of the radar equation, only one possible control by the target aircrat is its RCS, all others are inherent to either the hostile radar system or the environment. herefore, from the point of view of the aircrat, the radar parameters and the environment can be considered as a constant of the detection system. An examination of Eq.1 shows that the RCS of a target should be decreased by sixteen times, so that the maximum detection distance R falls by its half.
METHODOLOGY
he computational resource used in this study was the CATIA V5 software, responsible for the development of 3-D models of the aircrat which shall have the reduction of its
ABSTRACT: This paper presents a preliminary study of the
Radar Cross Section (RCS) reduction on the ighter aircraft. First, it was studied the RCS of the aircraft from computational simulations based on prior knowledge of vulnerable areas of this aircraft to radar threats. Subsequently, the possible applications of Radar Absorbing Materials (RAM) on the surface of the aircraft were evaluated, in order to reduce its RCS. The absorber material used in the simulations was denominated FC70, which has good attenuation in the range of 10 to 12 GHz. The study of this reduction was accomplished by applying RAM in four different scenarios at the frequency of 11.1 GHz, where the material is more sensitive. The RCS simulations of the ighter aircraft and its RCS reduction by RAM application were carried out with the support of the software “Computer Simulation Technology” (CST), version 2012. Such technology makes it possible to simulate the application with an absorber material layer on the surface of the aircraft. For the study of the RCS reduction on the ighter aircraft, it was irst necessary to develop a detailed 3D model of the ighter aircraft, and it was developed with the software “Computer Aided Three-Dimensional Interactive Application” (CATIA). In conclusion, it is impossible to make much progress attempting to retroit stealth onto a conventional aircraft because if the shape is wrong, no amount of absorbing material treatments will reduce the RCS.
KEYWORDS: Radar cross section, Radar absorber material,
Computational simulation, Radar cross section reduction.
1.Instituto de Aeronáutica e Espaço – São José dos Campos/SP – Brazil
Author for correspondence: Luiz Alberto de Andrade | Instituto de Aeronáutica e Espaço – Divisão de Materiais | Praça Marechal Eduardo Gomes, 50, Vila das Acácias, São José dos Campos/SP | CEP: 12228-904 – Brazil | Email: [email protected]
RCS studied. In order to study the electromagnetic scattering, the package A-Solver (asymptotic solver) of the Computer Simulation Technology sotware – CST 2012 version – was used (Gama and Rezende, 2005). In the interest of studying the RCS reduction, the RAM FC70 was inserted on the library of the CST (Gama and Rezende, 2010; Gama and Rezende, 2005; Gama et al., 2011),which simulated its application in parts of
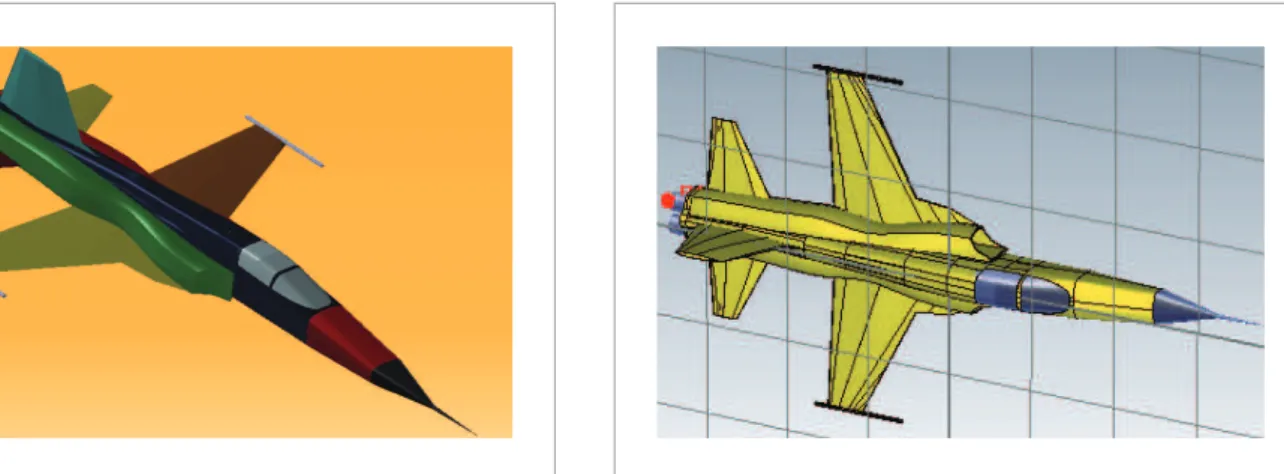
the surface of the aircrat, called Scenarios 1, 2, 3 and 4. In order to facilitate the RCS’s simulations on the F-5 and to modify the aircrat, because it is still in operation, some of its characteristics were modiied (CST, 2013; CATIA, 2010; EMBRAER, 2005). he simpliications were: the setting of a metallic canopy, the removal of external antennas, the withdrawal of navigation and training lights, as well as the removal of “probe” for refueling during light, weapons and engines. Figure 1 shows, in detail, a three dimensional model
Figure 1. 3-D perspective model of the ighter aircraft developed with the CATIA software.
Figure 3. Fighter aircraft partially coated with RAM, Scenario 2.
Figure 4. Fighter aircraft partially coated with RAM, Scenario 3.
Figure 2. Aircraft ighter aircraft partially coated with RAM, Scenario 1.
split to enable the necessary RAM application according to Scenarios 1, 2, 3 and 4 (Alves et al., 2006).
In Scenario 1, an almost covered aircrat is presented. he RAM were not applied on the canopy because it would compromise the pilot’s vision nor on the Radome’s surface because it could attenuate the signal emitted and received by its own radar.
In Scenario 2, in addition to the surfaces uncovered in Scenario 1, the turbine palettes and exhaust were not coated either.
In Scenario 3, in addition to the parts not covered in Scenario 2, the air inlet of the aircrat was not coated, and in Scenario 4, only the horizontal and vertical stabilizers were coated, in addition to the uncoated parts in Scenario 3, the wings, fuselage’s parts and aircrat’s rear.
Figure 6 and Table 1 show the comparison between the relectivity measured and simulated with the CST sotware, and the RAM FC70 used in this study of RCS reduction.
he diference between the theoretical and the measured curve is due to inhomogeneity of the material and the variation in the thickness of the sample.
RESULTS
he preliminary study of RCS reduction on the ighter aircrat, by managed application of RAM, was performed at the frequency of 11.1 GHz, with aspect angles ranging from 0° to 360° with increments of 1°. All simulations were performed in the same frequency because RAM is more sensitive.
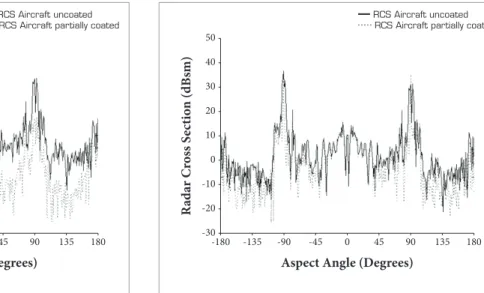
All RCS simulations were made using the package Asymptotic Solver (A-Solver), with a Gaussian excitation, vertical polarization and Triangular Mesh. Around 2,000,000 elements were generated. Figure 7 shows a comparison between RCS of the fighter aircraft at the frequency of 11.1 GHz, partially coated and uncoated with RAM, as shown in Fig. 2 (Scenario 1).
Figure 8 shows a comparison between RCS of the ighter aircrat at 11.1 GHz, partially coated and uncoated with RAM, as shown in Fig. 3 (Scenario 2).
Figure 9 shows a comparison between RCS of the ighter aircrat at 11.1 GHz, partially coated and uncoated with RAM, as shown in Fig. 4 (Scenario 3).
Figure 10 shows a comparison between RCS of the ighter aircrat at frequency 11.1 GHz, partially coated and uncoated with RAM, as shown in Fig. 5 (Scenario 4).
Table 2 shows a comparison between peak values of RCS at 11.1 GHz and RCS in the frontal, lateral, and rear portions of the ighter aircrat.
Tables 3 and 4 show values of RCS at 11.1 GHz in units of decibels square meter (dBsm) and square meter (m2), respectively.
he average was taken in intervals of 10° for RCS in the frontal, lateral, and rear portions of the ighter aircrat.
Typical radars detect aircrats with a frontal RCS of 5m2
within 165 km of distance. Using the Eq. 1 and the results from Table 4, the reach of radars ater applications of RAM, according to the scenarios presented, was estimated. Table 5 shows the reach of radars before and ater applications of RAM. Figure 5. Fighter aircraft partially coated with RAM,
Scenario 4.
Table 1. Comparison between the measured and the simulated relectivity of the RAM FC70.
Frequency (GHz) Relectivity
Measured Theoretical
8.2 -5.48852 -8.28
11.1 -26.17 -22.60
11.2 -28.06 -22.06
12.4 -16.5625 -16.96
Figure 6. The relectivity curve of the RAM FC70 used for RCS reduction.
R
efl
ec
tiv
it
y (dB)
Frequency (GHz)
12.4 8.4
5
0
-5
-10
-15
-20
-25
-30
Table 2. Comparison between the RCS of the ighter aircraft at 11.1 GHz frequency, uncoated and partially coated with RAM FC70.
Incidence
Peak RCS in dBsm
Uncoated
Scenarios (Coated with RAM)
1 2 3 4
Frontal 0º 15.20 -5.42 7.79 13.6 17.2
Lateral 90º 33.10 21.40 17.00 16.6 36.7
Rear 180º 30.50 5.41 11.30 15.3 16.2
Figure 7. Scenario 1 – Comparison between the RCS of the ighter aircraft at 11.1 GHz, partially coated and uncoated with RAM. R ad ar C ross S ec ti o n (dBs m)
Aspect Angle (Degrees)
180 -180 50 40 30 20 10 0 -20 -30
-135 -90 -45 0 45 90 135 -10
RCS Aircraft uncoated RCS Aircraft partially coated
RCS Aircraft uncoated RCS Aircraft partially coated
Figure 8. Scenario 2 – Comparison between the RCS of ighter aircraft at 11.1 GHz, partially coated and uncoated with RAM. R ad ar C ross S ec ti o n (dBs m)
Aspect Angle (Degrees)
180 -180 50 40 30 20 10 0 -20 -30
-135 -90 -45 0 45 90 135 -10
RCS Aircraft uncoated RCS Aircraft partially coated
Figure 9. Scenario 3 – Comparison between the RCS of the ighter aircraft at 11.1 GHz, partially coated and uncoated with RAM. R ad ar C ross S ec ti o n (dBs m)
Aspect Angle (Degrees)
180 -180 50 40 30 20 10 0 -20 -30
-135 -90 -45 0 45 90 135 -10
RCS Aircraft uncoated RCS Aircraft partially coated
Figure 10. Scenario 4 – Comparison between the RCS of the ighter aircraft at 11.1 GHz, partially coated and uncoated with RAM.
R ad ar C ross S ec ti o n (dBs m)
Aspect Angle (Degrees)
180 -180 50 40 30 20 10 0 -20 -30
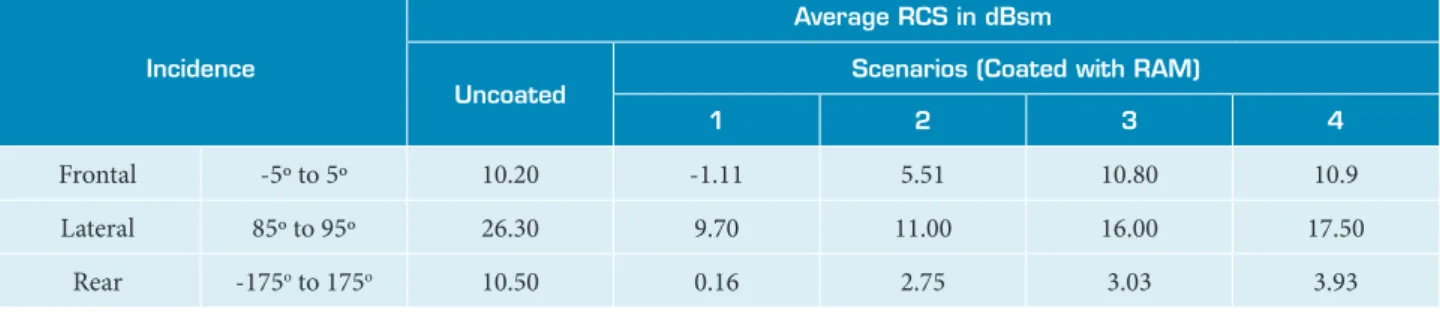
Table 3. Comparison between the ighter aircraft RCS average at 11.1 GHz frequency uncoated and partially coated with RAM FC70.
Incidence
Average RCS in dBsm
Uncoated
Scenarios (Coated with RAM)
1 2 3 4
Frontal -5º to 5º 10.20 -1.11 5.51 10.80 10.9
Lateral 85º to 95º 26.30 9.70 11.00 16.00 17.50
Rear -175o to 175o 10.50 0.16 2.75 3.03 3.93
Table 4. Comparison between the ighter aircraft RCS average at 11.1 GHz frequency uncoated and partially coated with RAM FC70.
Incidence
Average RCS in m2
Uncoated
Scenarios (Coated with RAM)
1 2 3 4
Frontal -5º to 5º 10.47 0.77 3.55 12.02 12.30
Lateral 85º to 95º 426.58 9.33 12.59 39.81 56.23
Rear -175o to 175o 11.22 1.04 1.88 2.00 2.47
Table 5. Comparison between the detection distance of the ighter aircraft in the frequency of 11.1 GHz to a typical radar using the average RCS, uncoated and coated with RAM FC70.
Incidence
Rmax in km
Uncoated
Scenarios (Coated with RAM)
1 2 3 4
Frontal -5º to 5º 222.5 116.0 169.8 230.3 231.7
Lateral 85º to 95º 562.2 216.2 233.0 310.7 338.8
Rear -175o to 175o 226.4 124.8 144.8 147.1 155.1
After the application of RAM with a theoretical attenuation of 22.6 dB at 11.1 GHz, for Scenario 1, the average of frontal RCS presented around 10 dB of attenuation. While the maximum range of the radar detection fell from 222 km to 116 km, i.e. the aircraft fighter could get 48% closer to the target before executing the mission. For Scenario 2, whose differences are only changing by the exhaust turbine and the application of RAM for metal, the average of frontal RCS presented around 7dB of attenuation. While radar reach fell from 222 km to 169.8 km, i.e. the aircraft fighter could get 25% closer to the target before executing the mission. For Scenarios 3 and 4, the application of RAM proved to be inefficient for frontal RCS reduction.
CONCLUSIONS
REFERENCES
Alves, M.A., Andrade, L.A. and Rezende, M.C., 2006, “Inluência da discretização de modelos em simulações de seção reta radar” In: Anais do VIII Simpósio de Guerra Eletrônica, São José dos Campos, Br, Vol. 1, pp. 1-4.
CATIA, 2010, Manual do Usuário, Available from: www.catia.com. Acessed on: 20 May 2013.
CST, 2013, Manual do Usuário CST Studio Suite versão 2012. Available from: www.cst.com. Acessed on: 20 May 2013.
EMBRAER. T.O. 1F - 5EM - 1, 2005, São José dos Campos, BR.
Gama, A.M. and Rezende, M.C., 2005, “The relationship between Mn-Zn ferrites with different iron ion contents and the absorption energy in X-band”, Proceedings of the IEEE, Vol. 1, pp. 322-325. doi: 10.1109/IMOC.2205.1580009.
Gama, A.M. and Rezende, M.C., 2010, “Complex permeability and permittivity variation of carbonyl iron rubber in the frequency range of 2 to 18 GHz, Journal of Aerospace Technology and Management, Vol. 2, No. 1, pp.59-62. doi: 10.5028/jatm.2010.02015962.
Gama, A.M., Rezende, M.C. and Dantas, C.C., 2011, “Dependence of microwave absorption properties on ferrite volume fraction in MnZn ferrite/rubber radar absorbing materials”, Journal of Magnetism and Magnetic Materials, Vol. 323, No. 2, pp. 2782-2785. doi: 10.1016/j.jmmm.2011.05.052.
Knott, E.F., Schaeffer, J.F. and Tuley, M.T., 1993, “Radar Cross
Section”, 2nd edition, Artech House Inc., USA, Chen, W.K., 1993,