Monitoring the Depth Penetration of Dyes in Poly
(Ethylene Terephthalate) Films Using a Two
Layer Based Photoaousti Model
L. Olenka,A. N. Medina, M. L. Baesso, A. C. Bento
,
UniversidadeEstadual deMaringa,Departamento deFsia
Av. Colombo5790, 87020-900,Maringa-Parana,Brazil
and A. F. Rubira
UniversidadeEstadual deMaringa,Departamento deQumia
Av. Colombo5790, 87020-900,Maringa-Parana,Brazil
Reeivedon27November,2001
Inthis workweproposeaphotoaousti modelbasedonthe Rosenwaig-Gersho theorytostudy
dyed polymer samples. The modelis similar to a two layer systemand it is usedto obtain the
thermaldiusivityandtheoptialabsorptionoeÆientofonesidedyedpolymerfoils. Thetested
samplewasthe polyethyleneterephthalatedyedwithdisperse dye,theBlue SamaromHGS.The
resultsshowedthatthedyedepthpenetrationanbeaessedfromthetteddataandthedyeing
proessanbebetterontrolledbyusingtheretrieveddata.
I Introdution
Photoaousti (PA) is an optial tehnique that has
beendevelopedtostudymaterialswhihannotbe
in-vestigatedwith onventional Transmissionand
Ree-tionmethods. PAisbaseduponheatgeneratedbythe
absorbedpartofaninidentlightontoaprobematerial
and it wasdesigned to solvethe diÆulties presented
by theonventional Optial Spetrosopy, that
gener-ally an not be applied to study very weak absorbing
material, and also sattering and opaque substanes.
Thestandardtheoryon photoaoustieet forsolids
waspioneeringintroduedin 1976anditisreferredto
as Rosenwaig and Gersho (RG) model [1, 2℄. Sine
then,severalmodelsandmethodshavebeendeveloped
to exploit the eet, not only for a single layer at
sample, but also for layeredsamples. Helander et al.
[3℄havepresentedaspetrosopibasedphotoaousti
theoryforlayeredsampleinwhihthethermaldiusion
lengthisusedfortheanalysis. Thismodelwasapplied
toathreeabsorbinglayersofaphotographilm. Also
basedin theRGtheory, Morita[4℄ obtainedageneral
expressionforaperioditemperaturefromthe
sample-gasboundaryformultilayeredpolyesterlm,wherethe
relationshipbetweenthephaseandthelmsinterfaes
were studied. In his simulation, the layers were
per-formed bya polyester bakingin whih aoloredlm
isxedandstudied asafuntion ofbakingthikness.
sure thermal parameters in a two layer solid system
and pointed the existeneof a partiular behaviorfor
samples having dierent thikness. In this ase, only
thermaldiusivity of thethermallythiklayeranbe
aessed, whereas if thermal thiknesses of the layers
arelose,thenthermaldiusivityofbothlayersanbe
aessed. Mansanaresetal. [6℄usingatwolayermodel,
showedthatthermaldiusivityandthermal
ondutiv-ity an be measured by means of a eetive thermal
diusivity model. They showedthat eetive thermal
diusivity is strongly dependent on the thermal
on-dutivityofeahindividuallayer,whenaglass/polymer
areusedasthetestingsample. Amatoetal. [7℄showed
thatsubstrateanaetthephotoaoustiresponsein
atwolayersystem. Theyproposed a generalized
the-ory for the two layersystem in whih the interation
betweenoptialandthermalparametersmustbetaken
into aount.
Generally,thethermalosillationduetothe
absorp-tionof modulatedlightat apointbeneath thesurfae
ofasample,ontributestothephotoaoustisignaland
itisruledbythethermaldiusionlength
i
,denedas
i =(2
i =!)
1=2
, being!=2f andf isthe
modula-tionfrequeny ofthelight. Basedupon thisequation,
one anobservethatadepth proleinspetion[8℄an
bedoneifthefrequenyisseleted.
Thus, taking these photoaousti apability we
inside aaqueousbath. Althoughthetotalthiknessis
unhangedforthe wholesystem, theproposal isfaed
similartoatwolayersystem,butonsidersafrational
thikness being impregnated by a disperse dye. The
modelis appliedto somelmsof polyethylene
tereph-thalate(PET)wherethedyearediusedfromonefae
of thePET. Thedisussion will be addressedin order
to haveinformation aboutthehangesin thephysial
propertiesandalsotomonitorthedepth penetration.
Thetheoretialexpressionisusedfortting
param-eterslikeoptialabsorptionandthermaldiusivityand
from theresults and usingthe signal dependene, the
depth penetrationofthedyeisevaluated.
II Photoaousti Model
Theproposedmodeltakesintoaountnothermal
re-sistaneintheinterfaebetweenthedyedandnon-dyed
layers of the polymer. The aim is to analyzethe dye
penetrationproess,usingadispersedye. Thiskindof
dyediusesalongthelmbulkwithouthemialbonds,
withnoativationenergyinvolved. Inthiswaywehave
toonsiderthatthesamplehasonelayerdyedandthe
other non-dyed, having an interfae in between that
will be aepted to be well dened in thikness. For
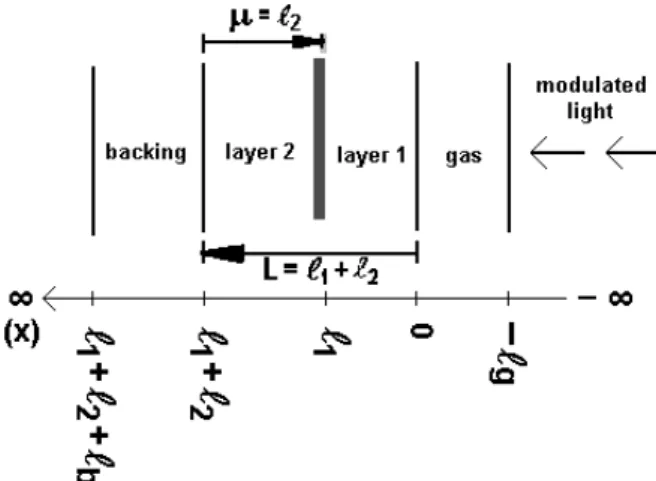
instane,weonsiderone-dimensionalgeometryforthe
photoaousti ell, shown in Fig. 1. The sample is a
semi-innite solid of thikness L=`
1 +`
2
, that
om-prisesanon-dyedlayer(`
1
)andthedyedone(`
2 ). The
modulatedinidentlightpasses throughthe
transpar-ent(nondyed)layer1anditismainlyabsorbedbythe
dyein layer2. Theinidentpowerat afrequeny !is
givenbyI(t)=I
0
=2(1+e i!t
)and aordingto Beer's
law we have I(x;t) = I
0
=2(1+e i!t
)e x
for x 0,
where istheoptialabsorptionoeÆient.
By onsidering that all absorbed light heats the
sample, the density of power at a point x, by unity
oftimeandunityofarea,isgivenby
S(x;t)= d
dx
I(x;t)= 1
2 I
0 (1+e
i!t
)e x
: (1)
Theanalytialexpressionforthetemperatureatthe
interfae sample-gas is written based on the diusion
equationforthemedium. Theset ofoupleddiusion
equation for allinvolved media, for the1-D ase, an
bewrittenas
2
x 2
T
j (x;t)
1
j
t T
j
(x;t)+f
j
(x;t)=0; (2)
where f
j
(x;t) = S(x;t)=k
j
, j= g (gas), b (baking),
s
1
(sample-layer1),s
2
(sample-layer2)andk
j
isthe
ther-malondutivityofthemedium j.
Figure1. Geometry ofthe photoaoustiell used in the
1-Ddyeingpenetrationmodel.
Consideringonlyonesideofthesamplebeingdyed
wehave:
2
x 2
T
1 (x;t)
1
1
t T
1 (x;t)+
1 I
0
2k
1
1 e
1x
(1+e i!t
)=0; 0xl
1
(3)
2
x 2
T
2 (x;t)
1
2
t T
2 (x;t)+
2 I
0
2k
2
2 e
2 x
(1+e i!t
)e
1 l
1
=0; l
1
xl
1 +l
2
(4)
2
x 2
T
g (x;t)
1
g
t T
g
(x;t)=0; l
g
x0 (5)
2
x 2
T
b (x;t)
1
b
t T
b
(x;t)=0; l
1 +l
2
xl
1 +l
2 +l
b
(6)
where l
i
is athikness,
i
is thelightinto heat onversioneÆieny,
i
is athermaldiusivity thatis dened as
=(k=
p
),inwhih isthemassdensityand
p
T
1
(x;t)=fAe
1 x
+Be
1 x
Ce
1 x
ge i!t
(layer1) (7)
T
2
(x;t)=fDe
2 (x l
1 )
+Ee
2 (x l
1 )
Fe
2 (x l
1 )
ge i!t
(layer2) (8)
d
T
g
(x;t)=e
g x
e i!t
(gas) (9)
T
b
(x;t)=Ge
b (x l
1 l
2 )
e i!t
(baking) (10)
wheretheomplexdiusionoeÆientisgivenas 2
j =
(i!=
j ).
ByusingEq. (7)into Eq. (3)onehas:
C=
1 I
0
1
2k
1 (
2
1
2
1 )
; (11)
and,usingEq. (8)in Eq. to(4),
F=e 1l1
2 I
0
2
2k
2 (
2
2
2
2 )
: (12)
Equations(7),(8),(9)and(10)areoupled
aord-ingtotwoboundaryondition,namely:
a) Temperatureontinuity
T
m
(x;t)=T
n
(x;t); (13)
b)Heatowontinuity
k
m d
dx T
m
(x;t)=k
n d
dx T
n
(x;t); (14)
in whihmand nstandforadjaentmedia.
By applying the boundary onditions the
oeÆ-ients ; A; B; D and E, are determined and so,
the temperature distribution in thephotoaousti ell
isobtainedasafuntionoftheoptialandthermal
pa-rametersofthesample,bakingandgas. The
tempera-tureofinteresthereisthatattheinterfaesample-gas,
thusatx=0onemayhave
(0)=A+B C (15)
being
(0) = fC[ 2(r s)(s+b)e l
1 (
1
1 )+2l
2
2
(r 1)(s 1)(s b)e 2
1 l
1
(1+r)(s 1)(s+b)e 2l22
+(r 1)(s+1)(s+b)e
2l11+2l22
+(1+r)(1+s)(s b)
2(r+s)(s b)e
l1(1 1)
℄ 2F[2s(r
2 b)e
l2(2 2)+l11
+s r
2
)(b+s)e
22l2+l11
(r
2
+s)(s b)e l
1
1
℄g=[(1+g)(s 1)(b s)e 2l
1
1
(g 1)(s 1)(b+s)e 2l
2
2
(g 1)(s+1)(b s)+(g+1)(s+1)(b+s)e
2l11+2l22
℄ (16)
d
Theinterfaeparametersaregivenby:
b = (k
b a
b =k
1 a
1
); g = (k
g a
g =k
1 a
1
);s =
(k
2 a
2 =k
1 a
1
); r=(
1 =
1 );r
2 =(k
2
2 =k
1
1 )
Itis worthyto observethat thesolutionfound for
thetwolayersystemanreproduethestandard
equa-tion ofthe RG model, if oneonsiders`
1 or`
2 equals
to zero. In the rst ase has a sample with ahigher
absorption oeÆient(dyed layer),whereas in the
lat-ter,thesampleistheoriginalsemi-transparentpolymer
III Experimental
III.1 Materials and method of
prepara-tion
Owingagoodtestsamplewehavesortedthe
om-meriallywell knownpolyethyleneterephthalatelms,
the so-alled PET, that wasimpregnated in only one
fae. This polymer is of partiular interest [9℄
be-ause its proessing depends on several ondition like
pressure,atalystandtemperaturewhihmayundergo
applied in fabris for bottles, toys and other objets.
Otherwise,ifPEThainsarebranhed andinterlaed,
they may be suitable for produing laminates, bags,
pakagesandalsoforoatingwiringapplianes.
Theommerialinterest forthis materialdemands
a great deal in improving its visual aspet and many
situation requires thePETto beimpregnatedordyed
to havebetter aspets. Allied to this fat, thedyeing
proessfortextileappliationisseenasaseriousobjet
ofstudy forseveralresearhes[10-13℄.
In this work we have used ommerial PET lms
with 100 m thik that were swollen in a bath of
modier N,N-dymethylarylamide (N,N-DMAA),
un-der temperatureand timeontrolat 85 0
Cfor15
min-utes. Afterbeingwashedandwipedtheyweredyedin
adispersebluedyesolution,undertemperatureof85 0
C
anddierenttimesexpositionofbathing. Bathingwas
performed at 2% dye onentration, in whih several
small bags of PET lms were plaed (3030 mm),
being drawn from the bath at times 1, 5, 10, 15, 25,
30,60,180and360minutes,suessively. Tensamples
werepreparedinordertohavedyepenetrationinonly
one side andsoto beused in thephotoaoustidepth
proleanalysis. Allsamplespresentedaverylightblue
olor that is attributed to the absorptionband of the
disperseSamaronHGS(DyStar)at about600nm.
III.2 Tehniques of analysis
Ahomemadeonventionalphotoaoustiellbuilt
from an Aluminium blok was used. The periodi
heating ofthe samplewas aomplishedbyusing a10
mWHe-Nelaser(Uniphase,model1135P)operatingat
=632:8nm,modulatedintherangefrom4to100Hz
by amehanialhopper(SRS, model540) oupledin
alok-in amplier(EG&G,model5110),thelightwas
fouseddiretlyontothePETsampleintothe
photoa-ousti ell. ThemirophoneBK(4166Bruel &Kjaer
20mV/Pa)wasoupledtotheellanditsvoltage
out-put, as afuntion of modulation frequeny, was
mea-suredusing thelok-inamplier. Themethodonsists
in varying the modulation frequeny and ollet data
automatially byaomputer.
As a onsequene we obtain the thermal diusion
length,whihpermitstoaessthesurfaestruture
and, therefore,thedierentlayerofthesampleanbe
dened. Onewemeasureandf,thedepth
penetra-tionisretrievedfromtheequation=(=f) 1=2
.
IV Results and disussion
By using Eq. (16) whih desribes the temperature
at the sample-gasinterfae, asetof theoretial urves
wassimulated and shown in Fig. 2. Thethiknessof
thesystemdye-samplewasonsideredasonstant. The
dyedsampleisplottedasaperentageofthetotal
thik-nessofthesystemvaryingfrom0% to100%. Forthe
simulationinthisgure,wehaveusedparametersfrom
literature[2℄forthebakingandgas: =0:97m 2
/s,
g
= 0:19 m 2
/s, k
b
= 2:37 W/mK and k
g
= 0:26
W/mK, also for the polymer's thermal ondutivity
[14℄: k
1
=0:0022W/mKek
2
=0:0030W/mK.As
wean see in Fig. 2,the setof urvespresenta
mini-mumaroundaspeiallyfrequenywhihweshallall
it as "harateristi frequeny f
". This f
hanges
withthe perentageof the dyed layerand itindiates
thatPAsignalundergoestoatransitionlayerfromthe
dyedlayerinto thenon-dyedone.
5
10
50
100
1
5
10
50
100
500
1000
thickness ratio
0 %
25 %
50 %
75 %
100 %
P
A
a
m
p
lit
u
d
e
(
a
u
)
Frequency (Hz)
Figure 2. Theoretial simulation for dierent perentages
of the dyed thiknesses.
1
= 0:9 10 3
m 2
/s,
2 =
1:110 3
m 2
/s,1=8m 1
,2=65m 1
.
If weinreasethe frequenytheremained signalis
attributed to the surfae layers. Yet, by onsidering
that light heats thesample from thesemi-transparent
layer, it should be noted that the higher the f
the
thikeris the impregnated layer. Thus, Fig. 2 shows
the expeted pattern for f
at higher frequenies for
thikerdyedlayer,likeobservedinurvessimulatedfor
25%,50%and75%. Furthermore,lookingatthelow
frequenyregime(f <20Hz),theurvesshowhigher
ontributionforthesignalforthemoreabsorbing
sam-ple,100%(uppermost),omparedtothatwithnodyes,
0%(lowest). Asweinreasesthefrequenyabovef
(
f >50Hz),thesignalisallduetoanopaquelayerand
thereisnof
in thisase(urvefor100%). Thesame
observation is valid for the semi-transparent urve, 0
%.
In Fig. 3 the theoretial urves are simulated for
aset of where wenote that atlowerfrequeniesthe
2
ontribution to the signalis more remarkable . If
2
isinreased from 55 m 1
to 110m 1
, thesignal
inreases. This isnoted by omparingurves (a) and
(b)or()and(d). Thisgurealsopresentaminimum,
f
,thatisbetterdenedforhighervalueof
2
. Onthe
otherhand,atfrequenieshigherthan50Hz,the
sig-nalforurves(a)and(b)areindistinguishablebeause,
layer1,with
1
8m 1
forbothofthem. Thesame
ommentsisappliableforurves()and(d)thatalso
havethesamevalueof
1
12m 1
.
!
Figure3. Theoretial simulation fordierentvaluesofthe
optialabsorptionoeÆient,xing1=0:910 3
m 2
=s,
2=1:210 3
m 2
/s;(a)1 =8m 1
,2=55m 1
;(b)
1 =8m 1
, 2 =110m 1
;()1 =12m 1
, 2 =55
m 1
(d)1=12m 1
,2=110m 1
.
!
Figure 4. Theoretial simulation for dierent values of
the thermal diusivity, xing
1
= 8 m 1
,
2 = 110
m 1
, (a) 1 = 0:8 10 3
m 2
/s, 2 = 1:2 10 3
m 2
=s, (b)
1
=0:810 3
m 2
=s,
2
=1:510 3
m 2
/s,
()
1
= 1:0 10 3
m 2
=s ,
2
= 1:210 3
m 2
/s, (d)
1=1:010 3
m 2
=s,2=1:510 3
m 2
=s,.
Thesimulation of the sensitivity of this model for
hanges in thermal parameters is plotted in Fig. 4.
Someurvesaresimulatedfor aset ofvaluesofand
itisnotedthat f
isshiftedasishanged. If
2 (1:2
10 3
m 2
/s) is xed and inreasesfrom 0:8! 1:0
(10 3
m 2
/s),f
alsoinreasesasshownbyurves(a)
and(). Thesamefeatureisseeninurves(b)and(d).
If
1
is xedinstead and
2
inreases from 1:2!1:5
(10 3
m 2
/s) theseobservationarestill valid ifurves
(a)and(b)or() and(d)areompared.
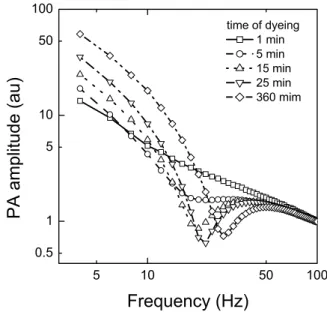
Thedependene of theexperimental signalagainst
modulation frequeny is now plotted in Fig. 5. The
signalisfromtheBluedyeoptialabsorptionfrom the
HeNelaserlightemittingat 632nm,that isverylose
to the absorption enter of the Samaron. The set of
urvesin Fig. 5showlearlythat there is af
higher
for a thiker dyed layerof the PET. For samples
ex-posed inside thebath for alonger time, the dyelayer
developedthiker,whihis inagreementwith the
pre-ditionofthepresentmodel,asshowninFig. 2.
!"#
Figure5.Experimentalsignal resultsforsamplesdyedat
dierenttimes.
Inthe1mindyedlm, thereisnof
,wemaysay
that this time is not enoughfor dyeinga well dened
layerofthePETlm. Ontheotherhand,fortheother
samples the minimum is present and beomes deeper
astheoptialabsorption inreases. Thisbehaviorwas
also predited in the model and indiates that using
more time in the bath means that more impregnated
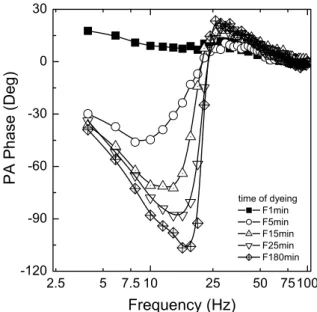
thePET lmwill be. Also,ifthephasesof thesignal
are analyzed, one ansee learly adened distintion
from sampletosample. Althoughwehavenotderived
a spei expression for the phase, the experimental
phasesbehaveslikesignals. Figure6showsPA
experi-mentalphasesversusmodulationfrequenyforasetof
samples. Itanbeobservedthatthephasesinthis
g-urearesimilarurvesthatdereaseintherangefrom10
to20Hzshowingaminimum. Aftertheminimumthey
inreaseabruptly,reahingamaximumnear25Hzand
they trend to join towardasaturation abovethis
hasaverylittledye, thistendenyisalmost notseen.
Theother observation isthatthe minimashifttoward
higher frequeny as the dyeing time is inreased. All
urvespresent an inreasingpeak-valley distane that
isorrelatedtothedyeingtime. Inthisgurethesolids
lines arejust guidetotheeyes.
!"#$
%&'("
%
%
%
%
)%
Figure6. Experimentalphaseresultsfor samplesdyed
atdierenttimes.
!"#$
Figure 7. Fitting of the experimental datafor some
sam-ples: (a)1 =0:9110 3
m 2
/s,2 =1:2210 3
m 2
/s,
1
=7:9m 1
,
2
=105m 1
;(b)
1
=0:8010 3
m 2
/s,
2 = 1:2510 3
m 2
/s, 1 = 8:0m 1
, 2 = 299m 1
;
()
1
= 0:85 10 3
m 2
/s,
2
= 0:99 10 3
m 2
/s,
1=7:4m 1
,2=250m 1
.
Figure 7showsa data tting forsamples dyed for
perature given in Eq. (16) For example, the
param-eters found for sample exposed 10 min were obtained
from thebest ttingfor thedata andthe valuefound
for the thermal diusivity of the non-dyed layer was
0:910:04 10 3
m 2
=s. This value is in
agree-ment with values usually found for PET lms in the
literature [15, 16, 17℄. For the dyed layer we found
1:220:0610 3
m 2
=s,showingthatthermal
diusiv-ityinreasedabitwiththedye. Theoptialabsorption
oeÆientwerealsottedforbothlayersandwefound
7:90:4 m 1
(transparent layer- PET) and 1053
m 1
(dyedlayer),with
2
t13
1
inthisase.
By taking the value of f
from some of the used
samplesand from =(=f) 1=2
, one analulate
andthen,evaluatethedepthpenetrationofthedye. In
Fig. 8weshowtheresultsforthealulateddye
pene-trationagainsttimeofdyeing. Thesolidlinerepresents
thettedurveforthedata usingthe empiri
expres-sion(t)=A[1 exp( t=)℄. Thesaturationwasfound
tobeA'62mandtheharateristidyeingtimewas
ttedto '253min. Thisresultpointedthatmore
than 50 % of the sample thikness is dyed veryafter
25min,showingthatifsampleweredyedonbothfae,
thistimeguaranteesawholeimpregnatedlm.
" "
#
$
%&'(&)
"#
$
#
"
*
+
))
,(
Figure 8. Kinetis for the dyeing time, A ' 62 m and
'25min.
Ontheotherhand,theexperimentalresultsdidnot
showthetotalimpregnationofthelmasexpetedin
themodel (see Fig. 2, urve 100%). Despite the
rel-ativelylongtimeof 360minbeingused, weevaluated
only60mfortheimpregnatedlayerinthisase.
Al-thoughwe believe thetime isquite enoughfordyeing
thewhole sample, it looks that the dye is stakingin
thebulk of PET lm, evenonsidering thetreatment
with N,N-DMAA It is expeted the intumesene of
Resultsforlongtimeofdyeingispointingthatdye
pen-etrationisfastatrstandslowsdownaftersometime.
Thiseet,ifitistrue,mightbereetingthereduing
oftheopenedhannelsinthePET bulkasthetimeis
going. Theonsequeneofthatisveryseriousonethis
maybeunderstoodasanonhomogeneousdyeing.
Inourmodel itis assumedthat dyepenetrationis
homogeneous but the unexpeted penetration for the
sampledyedfor360minsuggeststheexisteneofa
gra-dient in the dyediusion in thePET lm bulk. This
pointanbeseenin Fig. 5,wheresampledyedduring
360 min presented the harateristi frequeny (f
) a
littlehigherthan theothers,sayf
'30Hz, whilstit
wasexpetedafrequeny somehownear 80Hz or100
Hz, just likesimulatedin Fig. 2, urvefor 75% dyed
sample. Besides, theminimain Fig. 5are muh more
pronouned than that predited in the model and a
possibleexplanationforthatmightbeinthetreatment
proess. We haveno guarantee that the treatment of
the PET produed intumesene in the whole volume
ofthelm,althoughthetreatmentissureeetive[18℄.
Theinformationaboutthetreatmentdepthisnot
avail-ableforusatthistime. Underthisstatementonewould
ask if theFik'slawis notbeing broken. In fat,the
Fik's law demonstrates that a diusion of any
sub-stane throughout a ontinuous medium ours when
there exists a onentration gradient of atoms of the
impurity or moleules (in our ase is a disperse dye)
in the solid. In equilibrium ondition, this impurity
should diuse uniformly, so that a ontinuity law, or
Fik's law rules the ux of these atoms or moleules
into thesolids. Ontheotherhand,samplesstudied in
this paper presented saturation after 30 minutes and
behave like that for times up to 6 hours. We do not
believeFik'slawhasbeenbrokenbeausethedyedo
notdiuses until theother fae of the lm. It anbe
related to the previous treatment of the lms, where
thesolventmakeshannelstoalloweasypenetrationof
the dyethat is hold in thevoids of the polymerlm.
Thus, themain reasonforthe saturationmightbe
re-lated tothefat of lmsbeingpre-treatedin onlyone
side. Westress that this was madein order to follow
thedyepenetrationatoneside;otherwisewewouldnot
beabletoevaluatethepenetration.
V Conlusion
The twolayersimilar model proposed hereshowed to
bereliableforanalyzingimpregnatedpolymerwith
dis-persedyes. Thetheoretial expression derived forthe
PA signaltteddata verywell, showingthat, at least
for dispersedyes, it may be appliableto study
pene-trationanddiusionofliquidsintoatransparentsolid
support. Byperformingthefrequenyvariationfrom4
to100Hzweobserveatransition frequenyinthePA
signalbetweenthedyedandnon-dyedlayerofthe
poly-mer. Thisharateristifrequenyisdierentfromeah
sampleandallowustoalulatethedepthpenetration
, by varying modulation frequeny and from tting
thermaldiusivity. Thealulatedpenetrationshowed
samplesis pratially50 %dyed. Thisis duethe fat
thatthesamplesarebeendyedinonlyonefae. Dyeing
bothsidesthistimemaybesuÆienttodyeompletely
a100mpolymerlm. Finally, theresultspresented
herepointtoasaturationin theimpregnatingproess
afterswellingtimesabout30minutes.
Aknowledgments
L.O.gratefully aknowledgestoCapesandalsoto
CNPqforthepartialsupportin thiswork.
Referenes
[1℄ A. Rosenwaig, A. Gersho, J. App. Phys. 47(1), 64
(1976).
[2℄ A. Rosenwaig and A. Guersho,Photoaousti e
pho-toaoustispetrosopy,JohnWiley&Sons,NewYork,
1980.
[3℄ P.Helander,I.Lundstrom,andD.MQueen,J.Appl.
Phys.52(3),1146(1981).
[4℄ M.Morita,Japn.J.Appl.Phys.20(5),825(1981).
[5℄ T.Tominaga,K.Ito,Japn.J.Appl.Phys.27(12),2392
(1988).
[6℄ A. M. Mansanares, A. C. Bento, H. Vargas, N. F.
Leite,andL.C.M.Miranda,Phys.Rev.B42(7),4477
(1990).
[7℄ G. Amato, G. Benedetto, L. Boarino, M. Maringelli,
andR.Spagnolo,Appl.Phys.A52,280(1981).
[8℄ M. G. de Oliveira, O.Pessoa Jr., H. Vargas, and F.
Galembek,J.Appl.Polym.Si.35,1791(1988).
[9℄ H.F.Mark,N.G.Gaylord,andN.M.Bilakes,
(exe-utiveeditoronsultant);Enylopedia ofPolymer
Si-ene and Tehnology, vol.11, (Intersiene Publishers,
1969).
[10℄ A.Bendak,S.El-Marsa, AnnalideChimia,82,603
(1992).
[11℄ H.L.Needles,C.Walker,andQ.Xie,Polymer31,336
(1990).
[12℄ F.J.C.Fite,TextileRes.J. 65(6),362(1995).
[13℄ A.N. Saligram,S.R.Shukla,andM. Mathur,JSDC,
109,263(1993).
[14℄ L. Olenka,
E. N. da Silva , W. L. F. dos Santos, E.
C.Muniz,A.F.Rubira,A.N.Medina,L.P.Cardoso,
L. C.M.Miranda,M. L. Baesso,and A.C.Bento,J.
Phys.D:Appl.Phys.34,2248 (2001).
[15℄ P. Korpiun, B.Merte, G.Fritsh,R. Tilgner, and E.
Lusher,Colloid&PolymerSi.261(4),312(1983).
[16℄ M. J. Adams, G.F. Kirkbrightm,Analyst, 102, 678
(1977).
[17℄ A. Lahaine, P. Poulet, Appl. Phys.Lett. 45(9), 953
(1984).
[18℄ W. L. F. dos Santos, M. F. Porto, E. C.Muniz, L.
Olenka,M.L.Baesso,A.C.Bento,andA.F.Rubira,