On the Appliation of the Photoaousti Methods
for the Determination of Thermo-Optial
Properties of Polymers
A. C. Bento*, D. T. Dias, L. Olenka, A.N. Medina, and M. L. Baesso
UniversidadeEstadualde Maringa, Departamentode Fsia,
Av. Colombo5790,87020-900, Maringa-PR,Brazil
Reeivedon6November,2001
Inthispaper,theappliationofphotoaoustimethodstostudythermo-optialandspetrosopi
propertiesofpolymersisdesribed.ThePhotoaoustiSpetrosopy,theTwo-BeamPhase-Lagand
also theso-alled OpenPhotoaousti Cellmethodswill be presented. Thetheoretialbasis for
quantitativemeasurementsisdisussedtogetherwiththeadvantagesandlimitationsofthemethods
as ompared with onventional measurements. Appliations for spetrosopi and depth prole
analysisandalsofor thermalpropertiesmeasurementsinseveralpolymerssamplesaredisussed.
I Introdution
The sound eet indued in a heated solid by an
in-termittentlightbeamwasrstobservedbyBellin the
eighteenth entury [1℄. This eet was understood as
aphotothermal(PT)phenomenaandwastheoriginof
theso-alledphotoaoustieet. Nowadays,thereisa
wide range of PT tehniques and most of them were
derived from the Photoaousti Spetrosopy (PAS).
Basially,theirdierenesare relatedtothe employed
detetion shemes. There aredetetionsystemsusing:
photodiodes[2℄,pyroeletris[3,4℄,piezoeletris[5,6℄,
thermopiles[7℄,andmirophones[8,9℄.
Photoaousti (PA) is a photothermal phenomena
that hasbeenwidelyusedto studythethermo-optial
propertiesofmaterials. Inbrief,PAeetonsistsin
il-luminatingagivensamplewithamodulatedlightbeam
andmeasuringthesubsequenttemperatureutuation
induedin thesample resultingfromthelight
absorp-tion,duetononradiativede-exitationproesseswithin
the sample. Sine thesignal responds onlyto the
ab-sorbed light, the eets of sattered light playno
sig-niant role in these measurements. In addition, this
methodpermittosolvethediÆultiespresentedbythe
onventional OptialSpetrosopy[10-13℄,whih does
notgenerallyallowstudiesofveryweakabsorbing
ma-terials and also opaque samples. Some PA studies in
the infrared are based on Fourier Transform method
(FTIR-PA),whihallowsthemeasurementstobe
per-formed inthemedium infrareduptoabout400m 1
:
PA ispartiularlyusefulin this regionsineitan
de-tetthehydrogenbonds(C-H,O-HandN-H)thatmay
presentovertonesand ontribution from the
ombina-bonds. Areviewin theliteratureshowsthata
onsid-erable number of the FTIR-PA study is in analytial
sienesapplied topolymerarea[14-19℄.
Inthepolymerarea,there areseveralkindsof non
homogeneoussamplesthatpresenthighlevelof
satter-inglightandalsosamplesthatareopaqueina
onsider-ablepartofthespetrum. Due to that, photothermal
method is reognized to be an important
experimen-talproeduretoaessthethermo-optialpropertiesof
polymerimaterials.
In this paper a seletion of PA methods for
har-aterization of polymers is presented. The UV-VIS
PhotoaoustiSpetrosopy(PAS)andPhaseResolved
PAS,theTwo-BeamPhase-Lagand also theso-alled
OpenPhotoaoustiCell(OPC) [13℄will bedesribed
Thetheoretialbasisandexperimentalresultstogether
withtheperspetivesoffuture studiesinthisareawill
alsobedisussed.
II Standard Rosenwaig-Gersho
model modied for two-beam
aessment
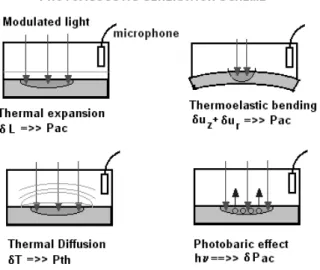
ThePA eetanbeproduedbyanykindof
absorp-tionthatresultsinaperiodialheating. Someshemes
ofPAgenerationaredepited inFig. 1. Althoughthe
heat diusion model (ThermalPiston) [8℄ is themost
ommon mehanism responsible for the generation of
(Ther-fet)[21,22℄andthegasevolution(PhotobariEet)
[23℄mayalsoontributetoprodueadetetable
aous-tisignal.Alltheseeetsresultinapressurevariation
insidethegashamberofthephotoaoustiell.
Figure1. PossiblePAgeneratingmehanisms.
TheRosenwaig-Gersho(RG)theoretialtreatment
for the photoaousti eet (known asthermal piston
model) onsiders that the pressure inside the
photoa-ousti ell is proportional to heat generated by the
absorbed light and depends on both the geometry of
theellandthethermo-optialpropertiesofthe
inves-tigatedsample. Thetwo-beammodiedRGmodel[21℄
anbeestablishedusing thediagramshowninFig. 2.
Theone-dimensionaloupleddierentialequationsthat
desribetheheatdiusionaregivenasfollow[24℄
Figure2. RGbasedPAgeometryfor dualbeam.
2
z 2
i (z;t)
1
i
t
i
(z;t)= F
i
(z;t) (1)
with i = \g"(gas)=> (l
g + l
s
=2) < z < l
s =2;
i = \b"(baking)=> l
s
=2 < z < ( l
s =2 + l
b );
i = \s"(sample)=> l
s
=2 < z < ( l
s
=2); the term
F
i
(z;t) = (f
i (z;t)=k
i
) represents the heat soure,
be-ing f
g
(z;t) = f
b
(z;t) = 0 and f
s
(z;t) 6= 0;
i is the
thermaldiusivity,denedas
i =k
i =(C
p )
i ;k
s isthe
thermal ondutivity, C
p
is the volumetri heat
a-paity,and l
i
isalength. Boundary onditionsforthe
ontinuity of temperature and heat ow are speied
foradjaentmediumsattheinterfaeij as
i =
j
; k
i
z
i =k
j
z
j
: (2)
Thesolutionofoupledequationsis
(l
s =2;t)=
1
k
s
s Z
l
s =2
ls=2 "
(b 1)e s(z+
ls
2 )
(b+1)e s(z+
ls
2 )
(g 1)(b 1)e
s l
s
(g+1)(b+1)e
s l
s #
f(z;t)dz; (3)
d
inwhih
b= k
b a
b
k
s a
s ; g=
k
g a
g
k
s a
s
; r=(1+j)
2a
s =
s
: (4)
Theomplexparameter
i
=(1+j)a
i
isfrequeny
dependent, in whih a
i
= (!=2
i )
1=2
and
i = 1=a
i
namedasthethermaldiusionlength; andl
=1=
are the absorption oeÆient and optial absorption
Front illumination
UsingtheilluminationI(t)=I
o (1+e
j!t
),the
den-sity of absorbed power an be expressed as f(z;t) =
I
o e
(l
s =2 z)
(1+e j!t
). Solvingthe integralin Eq.
F (l s =2)= I o k s 2 s (r 2 1)
(b+1)(r 1)e
s l
s
(b 1)(r+1)e
s l
s
+2(b r)e l
s
(g+1)(b+1)e sls
(g 1)(b 1)e sls
: (5)
d
this is the RG derived equation. This temperatureis
dampedinthegaslength2
g
andtheaoustisignal
isgivenby
S F = P o (l s =2) l g g T o e jF : (6)
ThegasllingthePAellisassumedtobeanideal
gas with PV
=te, with = C
p =C
v
asthe gas
spe-iheatratio;P
0 andT
0
aretheambientpressureand
temperature. TheEq. (6)givesaomplexnumberthat
hasamodulekS
0
kand aphase
0 .
Rearillumination
In this geometry, we assume I(z) = I
o (1 + e (l s =2+z)
) and the heat soure in the form f(z) =
I
o e
(ls=2+z)
,thus Eq. (3)gives
R (l s =2)= I o k s s (r 2 1)
[(b+1)(r+1)e
s l
s
(b 1)(r 1)e s l s ℄e l s
2(b+r)
(g+1)(b+1)e sls
(g 1)(b 1)e sls
: (7)
d
Bytaking therelationof
s withl
s andl
,the
ex-pressions (5) and (7) an be simplied sine one
on-siderssomelimitingasesinthePAmodel. Theytake
into aount the thermal thikness (thermally thik
(
s <<l
s
)orthermallythin(
s >>l
s
))andthe
opa-ity(transparent(l
>>l
s
)andopaque(l
<<l
s )). In
the aseofspetrosopistudy,highly absorbing
sam-ple may presentasaturatedPAspetrum(l
s >>1),
whihonstitutesin aserioustroubleforresolvingthe
optial absorption bands. Fortunately, as opaity
de-pendsonthikness,usuallyoneandrivethePA
spe-trum to a resolved ase (
s
< 1 and l
s
< 1), by
adjustingsamplethiknessorseletingasuitable
mod-ulationfrequenyrange.
As mentioned before, for polymer samples, PAS
is partiularly useful in the near infrared (NIR) and
medium infrared(MIR),whereHydrogen bonds(C-H,
O-HandN-H)maypresentovertonesandontribution
fromtheombinationsofthestrethingandvibrational
modes.
III Open Photoaousti Cell
The Open PA Cell onsists in a ommerial eletret
mirophone that reeivesdiretlyon topaatslabof
a solid sample [25, 26℄. The mirophoneis loated in
thebakingpositionifweonsiderthegeometryofFig.
2. A metallized Teonfoil 12m thikwith aoating
minimum volume hamber with an air gap 45 m.
Pressurevariationinduesavoltageintheeletretand
foranopaquesampleitfollowsthat
P = P 0 I 0 ( g s ) 1=2 2l g T 0 k s f e j(!t 2 ) sinh( s l s ) : (8)
The limiting ases are given for two situations:
thermally thin l
s a
s
1, where pressure is
depen-dent on f 3=2
, and for thermally thik l
s a
s
1,
with signal deaying exponentially with frequeny as
S/(1=f):e b
p
f
. Fittingdatatohaveb,thermal
dif-fusivity is obtainedfrom
s = (l 2 s =b 2
). Even though
this method is designed for opaque sample, it is
a-epted that a thermally thin evaporated oatingon a
transparentsampleoraverythin metalfoilxedonit
analsobestudied withthisproedure[27℄.
IV Photoaousti methods
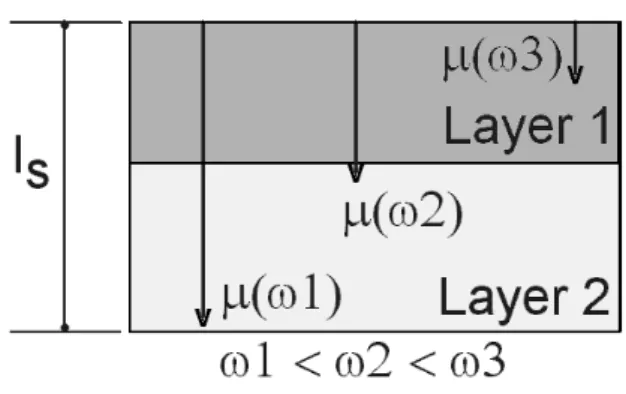
IV.1Depth proling: frequenysanning
Ifthe light isabsorbedin alengthl
,the only
de-tetableheatisthatinsidethethermaldiusionlength
=(=f) 1=2
, whihgivesthe \thermalskin depth"
of thesample. Varying frequeny f, one anperform
thedepthprolingofalayeredsample,Fig. 3. The
pa-rameterlassiessampleintwoategoryisthermally
thik(
s <<l
s
)orthermallythin (
s >>l
s
)and for
s =l
s
wedene the ritial frequenyf
=(=l 2
(varyingwavelength)andthermalproperties
measure-ments(xedwavelengthandvaryingfrequeny).
Figure3. Depthpenetration(!)foralayeredsample.
IV.2 Phase Resolved method
PhaseResolvedisanumerialmethod usedinPAS
[28℄ to separate a spetrum, when it is omposed by
morethanoneabsorbingomponent. Forexample,PA
signals S
A (
1
) and S
B (
2
) with bands superimposed
andbeingenteredat twonearwavelengths(
1
2 ).
In priniple, if PA signals present a phase dierene
6=0atahosenwavelengthwemaybeableto
re-solvethespetraforeahomponent. Theinstrumental
aurayrequires greaterthan5 0
. Inthis method,
PAsignalisrepresentedinaphasorialpiture,whereit
should beseparatedin twoomponents: in phaseand
inquadratureasshowninFig. 4. Forapartiular
pro-jetingangle
B
wehaveseparatedontribution from
absorbingenter B and its PA signal is maximum at
B 90
0
.
Figure4. PhasorialdiagramforPhase ResolvedPAS.
IV.3 Thermal expansion
Forauniformheating,thereisnotemperature
gra-dient on sample (see Fig. 1), thus thermal expansion
maybepresent. Solvingtheoupleddierential
equa-tions by onsidering sample poor thermal onduting
(b > r), transparent (l
> l
s
) and in the thermally
thik(
s <l
s
), thesurfaedisplaementz =l
s
T
s
is evaluated. If no heat is transferred to the gas
k
s s(0)
z
=0; sample-gasinterfae),thenthepressure
isÆP =(P
o l s =l g ) T s e j!t
[29℄andthetemperature
s ' I 0 2 s k s ( s 1) 1
(1+j!)
: (9)
BytakingthemoduleandthephaseofEq. (9)both
thethermal diusion time and thenon-radiative
re-laxationtime =(1=a s 2
)arealulated.
IV.4 Thermoelastibending
Whenaatsampleisunderanon-uniformheating,
expansion and ontration may undergoto a thermal
gradient (seeFig. 1), thus athermoelasti bending is
likelytoriseasdisplaementu
z (r;l
s
=2)[21,22℄. This
eet takes into aountthe sample's displaement in
bothdiretionu
r
radialandu
z
longitudinalorz
(nor-maltosampleplane). Thetemperature
s
isalulated
from Eq. (3)byonsidering strongsurfaeabsorption
andusingf(z
0 )= s I 0 Æ(z 0
). Itfollowsthat
s (l s =2)= s I o k s s osh[ s (z l s 2 )℄ senh( s l s ) ; (10) P th = P o T o l g Z 2 g o s (l s =2)e sz dz; (11) s
isthethermalontributionand
s
isadimensionless
absorption oeÆient and the signal\+" means front
(
F
)and\ "isforrear(
R ).
Integratingthedisplaementproduedbythefront
illuminationtheaoustipressureisobtained[22℄P
a = P o =V o R R 0 o 2 g u z (r;l s
=2)dr. Aording to
MDon-ald and Wetzel [30℄, the total pressure is then P =
P
th +P
a
. Ifthermoelastibendingispresent,onean
retrievethermalpropertiesfrom thephaseofthe
pho-toaousti signal. Inthe thermally thik ase(high f
withl
s a
s
1), thephaseofthesignalasafuntionof
themodulationfrequenyhastheform:
= 2 +artan 1 Z 1 (12)
where \ " refers to
F
and \+ " to
R , yet
Z = l a = b p
allows one to alulate thermal diusivity
s using
b=(l 2
s =
s )
1=2
.
IV.5 Two-Beam phase lagmethod
TheTwo-BeamGeometryusesthesignalsS
F (front
beam) and S
R
(rear beam), whih are obtained from
themodiedRGmodel(seeFig. 2)[31℄. Itrequiresan
air baking (g = b = 0), opaque ondition (l
s 1)
and sample must have surfae absorption ( a
s ).
The typial twobeamPA signals ratioand the phase
lag are given by(S
F =S
R )= (I
F
F =I
R
R )[osh
2
(Z)
sin 2
(Z)℄ 1=2
andtan()=tanh(Z):tan(Z),with Z =
l
s :a
s
and=(
F
R
). Oneanevaluatethe
param-eterZ fromtan()atasinglefrequeny. Thus,
ther-mal diusivity
s
is obtained using
s
= f(l
s =Z)
2
.
This model was adapted for transparent samples by
foringoptialabsorptionoeÆientatthesample
sur-fae,e.g.,usingametallioatingorathinAlfoil[27℄.
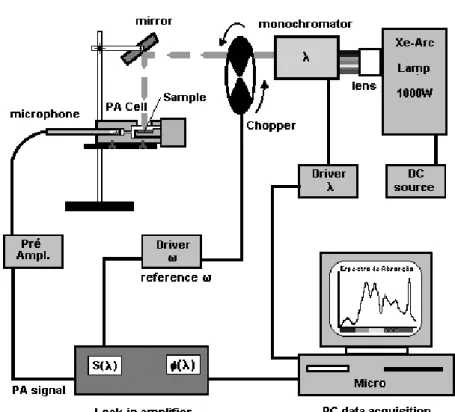
IV.6Photoaousti typial arrangements
Figure 5 shows the experimental setup for PAS,a
homemadePAspetrometer. Inthis setup,whitelight
(Halogen or Xe ar lamp, 150 W to 1000 W) passes
throughoutamonohromator(180nmto3800nm). A
mehanialhoppermodulatesthe lightandthebeam
goes to the PA ell. PA onventional ell must have
anoptialwindowtoallowradiationto reahthe
test-ingsampleplaedinside. Ahopperdriver(1Hz to3
kHz)givesthepulsereferenethatsynhronizesthePA
signal(1Vto2mV)olletedbythemirophone(20
mV/Pato50mV/Pa),whihismonitoredbyaLok-in
amplier. The PA experiment runs varying twomain
variables: wavelengthorfrequeny. Alternatively,OPC
usesthe same priniplebut, for the thermal property
evaluation, sample is plaed on top of a ommerial
eletret's mirophone. The sample onsists itself in a
sealingforthePAell. FortheOPC,usuallyitisused
axedwavelength(UV,VISorIR), alaser beamora
whitelight.
V Photoaousti spetrosopy
applied to polymers
V.1 Infrared PA depth proling
Manypapersarefoundinliteratureaboutpolymer's
studyusingFTIRwithPAdetetion. Fewofthemare
aboutpolymerizationoflatonesunderHydroxyapatite
preseneandinHydroxyalkylMetharylate,water
sol-ubleAryllamideopolymer,struturaltransformation
of PE phase in blends of oriented PE-Polypropylene
(PEPP), interfaial ties in thermoplastis olens
dur-ingstratiation[14,16,17,32,33℄,whilstmanyothers
treatthe depth proling analysis in analytialsiene
[18℄. Studies on ompositional gradientsin urethanes
and latexes, hain sission in UV exposed epoxy and
urethanelms,individualdistributionofthermoplasti
throughstratiationnearsurfaeinPPand
Ethylene-Propylenerubber,photooxidationin Styrene-Isoprene
opolymerarealsoreported. [19, 34,35, 36,37℄.
The ability of the FTIR-PAS for depth proling
analysisinlayeredmaterialshasbeendemonstratedby
Dittmar and oworkers[38℄, that use thethermal
dif-fusionlength=(=!) 1=2
asakeyparameter. They
disussed about the dependene of the PA signal and
thermaldiusionlengthinhomogeneousand
inhomoge-neouslaminarsamples. Thistehniquewasappliedon
aVinylresin(EthyleneVinylAetate-EVA,DuPont
El-vax)thatwasastontoaPPsubstrate,andtostudya
Polyamidelm(DuPontKapton)that wassandwihed
between two layers of Fluorethylene (Teon). From
phaseresolvedanalysis theyseparatedthesurfaeand
bulk ontribution for the spetra of Polyamide. The
study of the integrated intensities of the EVA-on-PP
showed to be useful in loating the layers where the
band ontributions ome from. They loated the
ar-bonyl streth at 1730 m 1
(surfae layer), the C-H
bends at 1370 m 1
and at 1450 m 1
(surfae and
bulk),C-Clattievibrationat1160m 1
(bulklayer),
the C-H strething peaks at 2918 m 1
and at 2850
m 1
.
A similar depth analysis in near infrared (NIR) in
the range between 1.0 m up to 3.0 m is presented
by Oliveira et al. [39℄. Sanning a PEslab of 1mm
thik using frequenyin therangeof 10Hz to240Hz
theyprobeddepth in therange betweenabout56 m
and 11 m. The aim was to study the loation of
CH
3
, = CH
2
and OH groups. They studied the
Low-Density PE(LDPE)through PApeak intensities
ratios of CH
3
, = CH
2
and OH groups related to
thatofmethylenegroup. Theyobservedthat these
ra-tios inreased, showingthat thelayersof PEloserto
surfaeareriherin CH
3
, =CH
2
and OH groups
asomparedto thebulk.
V.2 Visibleoptial absorption ofpolyethylene
al. [40℄ for optial absorptionmeasurementsin a new
omposite material based on PE oated. It ombines
PA and transmission tehniques. The method states
thatasolidsampleofthiknessl,reetivityR ()and
absorption oeÆient (), will presenta transmitted
beam intensity T() and the PA signal S(). It
fol-lows that T and S an be represented expliitly by
terms dependent of , i.e., T() =(a=b)exp( ():l)
and S() = a[1 exp( ():l)℄. Parameters a and
b depend on through R (). Four testing samples
were used and the layer of MnO
2
presented
thik-nesses in the range of 17 nm to 200 nm. The PA
spetraandtransmissiondatawere obtainedfrom 450
nm up to 650 nm , being Mn peaking at 450 nm.
Theauthors haveshownthat for alulating() one
have to invert the T() and S() equation and
ob-tainspeiallyan expressionto give independently
as
T
() = (1=l)lnfa()=[T():b()℄g and
S () =
(1=l)lnf1 S()=a()g 1
. Theyderiveda()andb()
by tting the plots of S() versus T() whih is
lin-ear. Thevaluesfoundshowedanexponentially
deay-ing urveof
average
()that rangesfrom 1.0 m 1
to
3:2 10 5
m 1
when goes from 450 nm to 650 nm.
Theworkalsopointedoutthatsuhahighoptial
ab-sorption oeÆient ould be useful in the liningsolar
olletors.
V.3 Thermal diusion and non-radiative
relax-ation time
AnotherPA appliation is the investigation of the
kinetisoftheiodinedopingproess[41℄. IodineDoped
Polystyrene (PST:I
2
) was prepared using an atati
PST lmthatwereastfrom5%(w/w)hloroform
so-lution overaatleanglassplate,exposingPSTlms
to vaporphaseiodine. PAS spetrumofthe PST :I
2
showedtwomainpeaksat310nmand495nm. TheRG
model ismodiedforathermallythiksample, by
in-ludingtheeetsofanitenon-radiativede-exitation
time. The dependene of thephasein thermallythik
regimeisrewrittensimilarlytothatpresentedfor
ther-mal expansion and suitable for transparentmaterials.
Thephaseisgivenby
(!)= 3
4 tan
1
(!)+tan 1
"
1
p
2!
+1
#
(13)
showing that phase depends on both and
.
Re-sultsshowed
310
greaterthan
495
butbothpresenting
a minimum 20 ms for t = 120min and 180min.
In ontrast, it was observed
310
smaller than
495
but peaking to
100 ms in the same interval of
time. This behavior for and
was explained as a
seond-orderphasetransition.
V.4 Dyeingmonitoring in PET lms
ap-be adequately dyed in order to present a better
ap-pearane [42℄. The PAS tehnique is applied to
N,N-Dimethylarylamide (DMMA) modied and
non-modiedPETlmsthathavebeendyedwithSamaron
BlueHGSdyeandwithDianixFB-EReddye. Mainly,
visibleoptialabsorptionbandsofBlueDyeat632nm
andbandsofRedDyeat442nmweremonitoredusing
thePASspetraasafuntion ofproessingparameter.
Itwasfoundthatthebestonditionfordyeingisa2%
bathonentration,15minforlmstreatmentat85 Æ
C
with the modier DMMA and after that, dyeing over
30 min at 85 Æ
C. No dierene in proessing method
wasfoundwhenbothdispersedyesareompared.
V.5 Cross-linking proess
HereitisshownthepossibilityofusingthePASto
evaluate the ross-linkingof the opolymer from
EV-Trimethoxysilane(EVS), namedCop, and thegrafted
VinylTrimethoxysilane(VTS) onLDPE,named PEg.
PAS is used for monitoring the overtone bands and
strething frequenies ombinations of the groupings
Si OH, = CH
2 , CH
3
and CH
2 CH
3 , in
thenearandmediuminfraredrange. ThroughoutPAS
spetra, using theassigned absorption bands [39℄, the
omparisonbetweenarefereneandaross-linked
sam-pleispossible. PASisusedtostudypeaksevolutionin
both,opolymerEVSandgraftedLDPE.Thesamples
were typially preparedwith 3%, 5% and 7%of
ata-lystandross-linkedat70,80and 90 0
C,respetively,
whihresultedinninesamples. ThetypialinfraredPA
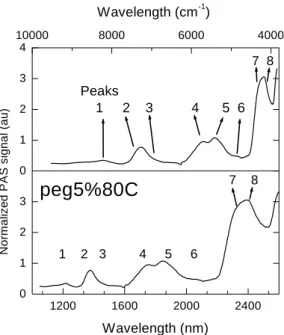
spetrumisshowninFig. 6andthebestombinations
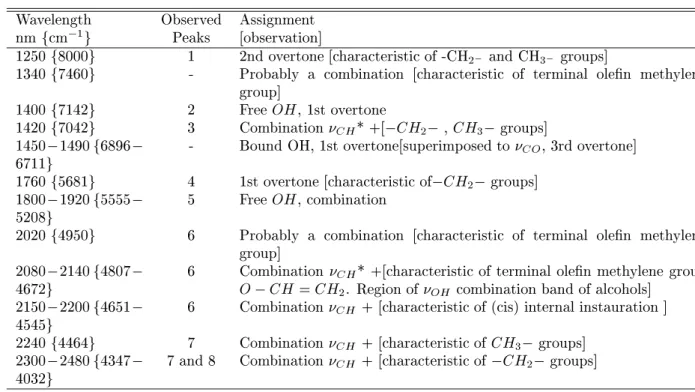
ofthepeakratiosaredepitedinFig. 7forNIR.Table
IpresentsthetabulatedbandsassignmentsforPE.
Takingtheanalysis oftheovertonebandsof OH
groups,thebetterross-linkedsamplewasfoundtobe
thatpreparedwith80 0
Candintherangeof5%to7%
ofatalyst, typially,asoneanobservebylooking at
theentralframesofFig. 7[43℄.
Phase Resolved PA method may be used in
spe-trosopy for separating spetra in sample with more
thanoneabsorbingenteratawavelengthinbothrange
NIRand MIR [38℄. In priniple,if there is phase
dif-fereneatasortedPASpeakwemaybeabletoresolve
thespetrafor eah omponent, regarding
instrumen-tal auray 5 0
. The PA spetrafor Cop and PEg
and their phases showed a phase dierene 7 0
for
Copand10 0
forthesuperimposedpeaks2and3,in
theNIRregion. ThephaseseparationforPEg770and
Cop770hasshownthatpeak2isseparatedat aphase
of50 0
,whihmeans thatits maximumisat 140 0
. On
theotherhand,peak3isseparatedataphase35 0
with
maximum at 125 0
. In the same way the peak 2 and
peak3ofCop770isalsoseparated.
TableI -TabulatedinfraredbandsassignedtoPEinNIRandMIRrange.[39℄
Wavelength Observed Assignment
nmfm 1
g Peaks [observation℄
1250f8000g 1 2ndovertone[harateristiof-CH
2
andCH
3
groups℄
1340f7460g - Probably a ombination [harateristi of terminal olen methylene
group℄
1400f7142g 2 FreeOH,1stovertone
1420f7042g 3 Combination
CH
*+[ CH
2 , CH
3
groups℄
1450 1490f6896
6711g
- BoundOH,1stovertone[superimposedto
CO
, 3rdovertone℄
1760f5681g 4 1stovertone[harateristiof CH
2
groups℄
1800 1920f5555
5208g
5 FreeOH,ombination
2020f4950g 6 Probably a ombination [harateristi of terminal olen methylene
group℄
2080 2140f4807
4672g
6 Combination
CH
*+[harateristiof terminalolen methylenegroup
O CH=CH
2
. Regionof
OH
ombinationbandof alohols℄
2150 2200f4651
4545g
6 Combination
CH
+[harateristiof(is)internalinstauration℄
2240f4464g 7 Combination
CH
+[harateristiofCH
3
groups℄
2300 2480f4347
4032g
7and8 Combination
CH
+[harateristiof CH
2
groups℄
*
CH
1200
1600
2000
2400
0
1
2
3
0
1
2
3
4
10000
8000
6000
4000
peg5%80C
7 8
1 2 3 4 5 6
No
rm
a
liz
e
d
PAS si
g
n
a
l (
a
u
)
Wavelength (nm)
7 8
Peaks
1 2 3 4 5 6
Wavelength (cm
-1
)
Figure6. PA spetrumofaross-linkedpolymerintheIR
range. GraftedPEwith5%atalystunderwatervaporat
80 Æ
C.
0
1
2
3
4
5
0
1
2
3
4
base
70
80
90
0
1
2
3
4
base
70
80
90
7 %
(a) Peak1/Peak2 Ratio
(-CH
2
e CH
3
) / (Si-OH)
7 %
(b) Peak2/Peak3 Ratio
(Si-OH) / (
ν
CH
+ -CH
2
-CH
3
)
5 %
N
o
rm
al
iz
ed P
A
S
I
n
te
nsi
ty
(
a
u)
5 %
3 %
3 %
Figure 7. PA intensity ratiosfor PEginNIR range(Cop
presentedthesameresult).
ThePAspetraintheMIRregionareshowninFig.
8andthisis anotherusefulexamplegivenforsamples
Cop770andPEg770,respetively. Forexample,Fig. 9
showsonlythephaseseparationoftheCop770, where
peaks4and 5are well dened and separable. In
on-trast, peaks 7 and 8 are very diÆult to be visually
separated in this gure. In fat, we found no phase
dierene in betweenpeaks7 and 8forbothsamples,
Cop770 and PEg770( 0 0
)as itis shown bythe
found24 0
forCop770(Fig. 9) and27 0
for
PEg770(gure notshown).
1600
1800
2000
2200
2400
2600
0
5
10
15
20
0
5
10
15
20
pk8
pk7
Wavelength(nm)
PE
g
770
pk8
pk7
pk5
pk5
pk4
pk4
PA
S S
ignal
(
au)
cop770
Figure8. Spetralsignalfor aross-linkedpolymerat7%
atalystand70 0
CinMIRrange.
1600
1800
2000
2200
2400
2600
-5
0
5
10
15
20
-5
0
5
10
15
20
-5
0
5
10
15
20
Cop770
peak 4 (-CH
2
)
33
0
43
0
23
0
13
0
Wavelength (nm)
peak 5 (Si-OH)
87
0
57
0
47
0
37
0
PA
S S
ig
n
a
l (
a
u)
peak 5 = 127
0
peak 4 = 103
0
Figure9. Examplesofnumerialphaseseparationforpeaks
4and5(resolved)andforpeaks7and8(notresolved).Note
thatpeaks7and8aresimultaneous(nophasedierene).
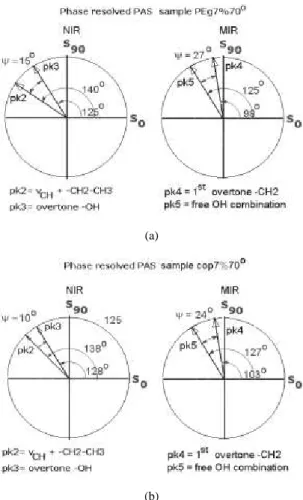
Makingthenumerialanalysis,weare ableto
of the methylene CH
2
. As expeted, the PA
analy-sisshowednoseparationforthestrethingombination
CH
thatisattributedto CH
2
and CH
3
overtones.
This observation is exemplied by Fig. 9 whilst the
overallphaseseparationsofthesesamplesareshownin
thephasorialdiagram,in Fig. 10a,forPEg770,andin
Fig. 10b,forCop770.
(a)
(b)
Figure 10. Phasorialdiagramof separatedomponentsfor
bothrangeNIRandMIR.a)ForPEg770,andb)Cop770.
VI Thermal diusivity
measure-ments
VI.1 Polymers foilsand resins
Many researhers in the material siene eld are
interested in thermal parameters,speially in thermal
diusivity() measurements[44℄. Fromonean
a-ess the thermalondutivity =C
p
, also thermal
diusivitymayreetindireteetsinthesolidlattie
thatarerelatedtostruturalhanges,likerystallinity,
dopingeets andproessingonditions.
Thermaldiusivitybasedpolymerfoilsstudieshave
been reported by several papers [27, 26℄. For
in-Polyester with dierent liquid baking [46℄, dierent
onduting foils like Polypyrrole (PPY) and
Polyani-line [47, 48, 49℄, temperature dependene of thermal
parametersin Polyvinylidene(PVDF) lms[50℄, olor
ellophanelms[51℄,arefoundinliterature. Alsomany
othersmethods basedon atwo-layeredpolymer, suh
asPolymethylMetharylate(PMMA)onstainlesssteel
andMylaronglassplate[52,53℄,orbasedon
multilay-eredpolymer[54,55℄are published. Partiularly,they
alled attention to thegreat inuene of thermal
on-dutivityratioontheeetivethermaldiusivityofthe
two-layersystem[53℄.
PhaseLag PA method and Thermoelastibending
have been exploited by Leite [27℄ and the OPC have
beendemonstratedbyPerondi[26℄forprobingthe
teh-nique for the measurement of thermal diusivity of a
set of polymer foils. Leite tabulated data for Teon,
Poly Vinyl Chloride (PVC), Cellulose Aetate (AA),
Polypropylene (PP) and LDPE by using front phase
datatting. Perondi presenteddata for LDPE,
High-Density Polyethylene(HDPE)andPP,basedonOPC
measurements. TableII showsalittlesurveyof
prop-ertiesforsomepolymers.
In addition, PA method allows the study of
ross-linking ofLDPE and someEpoxyResins. Cella et all
[56℄havestudied the LDPEafter beingswollenintoa
Diumyl Peroxide(Di-Cup) but the ross-linking
pro-esswasfollowedbymeansofthermaldiusivity
show-ingthatthis parameterinreaseswithimmersiontime
of the order of 10 hours, saturating for time up to
30 h.ours Also d'Almeida et al. [57, 58℄ showed that
thermaldiusivityis verysensitive formonitoringthe
hangesinepoxy-amine,induedonthe
maromoleu-larnetwork asafuntion of hardener/resinratio.
Ex-tendingthiswork,d'Almeidareportedthatthermal
dif-fusivityis suitableto monitorthe fraturebehaviorof
theepoxyresinunderimpatonditions,whendierent
hardenersareused.
VI.2 Modied and Dyed Polyethylene T
ereph-thalate
ThePAspetrosopyhasbeenusedto monitorthe
proessing variable in dyeing ommerial PET lms
modied by DMMA [59℄. The net eets in the
mi-rostruturewereaompaniedusingtheOPCPAell,
inwhihthermaldiusivityweremeasuredforaset of
sample, with dierent dyeing onditions (dyeing time
and temperature) [60℄. In the study presented by
Olenkaet al. [60, 61℄ itwasused a100m thik foils
ofPET lms. Themain resultshavepointed that the
PET lm improved the heat ondution power after
dyedattemperaturebelowglasstransition(T <70 0
C)
when time of dyeing is keptat 30 min. On the other
hand, for the set of sample dyed at higher
tempera-ture(T > 70 0
C) the results showed that the thermal
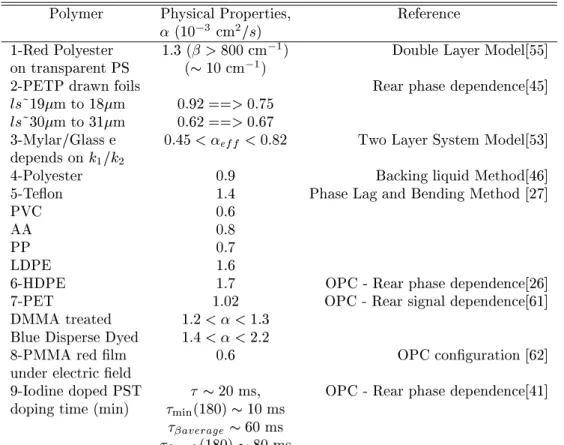
TableII-TabulatedphysialpropertiesofsomepolymersretrievedusingPA.
Polymer PhysialProperties, Referene
(10 3
m 2
=s)
1-RedPolyester 1:3(>800m 1
) DoubleLayerModel[55℄
ontransparentPS (10m 1
)
2-PETPdrawnfoils Rearphasedependene[45℄
ls~19mto 18m 0:92==>0:75
ls~30mto 31m 0:62==>0:67
3-Mylar/Glasse 0:45<
eff
<0:82 TwoLayerSystemModel[53℄
depends onk
1 =k
2
4-Polyester 0:9 BakingliquidMethod[46℄
5-Teon 1:4 PhaseLagandBendingMethod[27℄
PVC 0:6
AA 0:8
PP 0:7
LDPE 1:6
6-HDPE 1:7 OPC-Rearphasedependene[26℄
7-PET 1:02 OPC-Rearsignaldependene[61℄
DMMAtreated 1:2<<1:3
BlueDisperseDyed 1:4<<2:2
8-PMMAredlm 0:6 OPConguration[62℄
undereletrield
9-IodinedopedPST 20ms, OPC-Rearphasedependene[41℄
dopingtime(min)
min
(180)10ms
average
60ms
peak
(180)80ms
1.0
1.5
2.0
2.5
0
60
120
180
240
300
360
1.0
1.5
2.0
2.5
virgin
3
2
5
4
7
6
(a)
Samples dyed at 60
0
C
TR85C
TR60C
T
h
er
m
al di
ff
u
siv
it
y
(10
-3
cm
2
/s
)
virgin
3
2
10
11
9
8
(b)
Samples dyed at 85
0
C
TR85C
TR60C
Total dipping time (min)
Figure11. Thermaldiusivityresultsfor treatedPETasa
funtionoftimeofdyeing. (a)Samplesdyedat60 o
Cand
treatedatboth60 o
Cand85 o
Cand;(b)Samplesdyedat
85 o
Candtreatedatboth60 o
Cand85 o
C.Linesareguides
totheeyes.
ThermaldiusivitiesareplottedinFig. 11against
dye-ing time. Thermal diusivity inreases higherfor the
set dyedabovePETglasstransition,frame (b),
show-ingthat itdereasesforlongtermdyeing(6hours
typ-belowglasstransition, frame(b), itpresenteda
dier-entbehaviorwherethermaldiusivityinreasesallthe
wayastimegoes,but evensoitis notlinear. A
sum-maryoftheseresultsispresentedinTableIII.
The alulated thermal ondutivity is plotted
against integrated x-rayintensity areain Fig. 12. It
showsalinearbehaviorforsamplestreatedat60 0
C.In
ontrast,samplestreatedat85 0
Cshowedanerrant
be-haviorthat issuggested asa miro-struturalhanges
takingplaein thelattie.
VII Final Remarks
PAS havebeenshowntobeaveryusefuloptial
teh-nique for studying optial and thermal properties of
polymers. Partiularly when depth prole analysis is
needed,thefrequenydomainallowsonetostudy
prop-ertiesoflayeredsampleandseparatelayerontribution.
ApromisingmethodisthephaseresolvedPASthatan
giveusinsightaboutsuperimposedabsorptionbandsin
the NIRand MIR regionthat is veryrih in overtone
and ombinations of vibrational modes, usually found
in most polymer, opolymer, blends and resins.
Fi-nally,PAmethodisveryhelpfulforthermalparameters
ahievement,andthePhaseLagmethodsandtheOPC
haveproventobeworthyforderivingthermal
diusiv-ity for at and transparent polymer, suh as slabs or
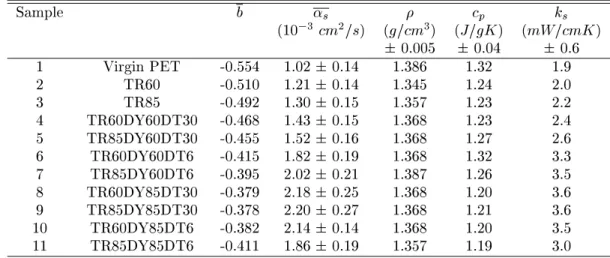
TableIII - Resultsofphysial properties foreahPET treated15minwith DMMAand dyebathonentration2
% Mol:L 1
.TR=temperatureoftreatment,DY=temperatureofdyeing,DT=timeofdyeing.
Sample b
s
p
k
s
(10 3
m 2
=s) (g=m 3
) (J=gK) (mW=mK)
0:005 0:04 0:6
1 VirginPET -0.554 1.020.14 1.386 1.32 1.9
2 TR60 -0.510 1.210.14 1.345 1.24 2.0
3 TR85 -0.492 1.300.15 1.357 1.23 2.2
4 TR60DY60DT30 -0.468 1.430.15 1.368 1.23 2.4
5 TR85DY60DT30 -0.455 1.520.16 1.368 1.27 2.6
6 TR60DY60DT6 -0.415 1.820.19 1.368 1.32 3.3
7 TR85DY60DT6 -0.395 2.020.21 1.387 1.26 3.5
8 TR60DY85DT30 -0.379 2.180.25 1.368 1.20 3.6
9 TR85DY85DT30 -0.378 2.200.27 1.368 1.21 3.6
10 TR60DY85DT6 -0.382 2.140.14 1.368 1.20 3.5
11 TR85DY85DT6 -0.411 1.860.19 1.357 1.19 3.0
Figure 12. Calulated thermalondutivity for dyedPET
lmsas afuntionofx-rayintegratedpeakarea. Theline
pointstothetendenyofinreasingthethermal
ondutiv-itywithrystallinity.
Aknowledgments
Wearein debt withtheBrazilianAgenies Capes,
CNPq,PADCTandFunda~aoArauariaforthe
nan-ialsupportofourresearhgroup.
Referenes
[2℄ A.C.Boara,D.Fournier,andJ.Badoz,Appl. Phys.
Lett.36,130(1980).
[3℄ A.Mandelis,Chem.Phys.Lett.108,388(1984).
[4℄ H.Coufal,Appl.Phys.Lett.44,59(1984).
[5℄ W.Jaksonand N.M.Amer,J. Appl.Phys.51,3343
(1980).
[6℄ J.Mura, L.C.M. Miranda, M.L. Baesso, A.C. Bento,
andA.F.Rubira,J.Appl.Pol.Si.82,2669(2001).
[7℄ S.O.Kanstad, P.E. Nordal, Powder Tehnol. 22, 133
(1978).
[8℄ A.Rosenwaig andA. Gersho, J. Appl. Phys.47, 64
(1976).
[9℄ M.D.daSilva,I.N.Bandeira,andL.C.M.Miranda,J.
Phys.E:Si.Instrum.20,1476(1987).
[10℄ A.Rosenwaig,PhotoaoustiandPhotoaousti
Spe-trosopy, Wiley,New York,1980.
[11℄ C.K.N.PatelandA.C.Tam,Rev.Mod.Phys.53,517
(1981).
[12℄ K. Klein, J. Pelzl, and H. Futterer, Photoaousti,
Priniples and Appliations, eds. E. Lusher, P.
Ko-rpiun, H. J. Coufal and R. Tilgner, Viewg,
Braun-shweig,1982.
[13℄ H.VargasandL.C.M.Miranda,Photoaoustiand
Re-lated Photothermal Tehniques; Phys. Rep. 161, 43
(1988).
[14℄ E.Helwig,B.Sandner,U.Gropp,F.Vogt,S.Wartwig,
andS.Henning,Biomaterials22,2695 (2001).
[15℄ L.Gonon,J.Mallegol, S.Commereu,and V.Verney
,Vibrat.Spetr.26,43(2001).
[16℄ M.B.Hoking,K.A.Klimhuk,and S.Lowen, J.Pol.
Si.A-Pol.Chem.39,1960(2001).
[17℄ P.Shmidt,J. Baldrian, J.Sudla, and J.Dybal, M.
Raab,K.J.Eihhorn,Polymer,42, 5325(2001).
[19℄ M.W. Urban, Progr. in Organ. Coatings, 40, 195
(2000).
[20℄ F.A.MDonald,J.Opt.So.Am.70,555(1980).
[21℄ P.Charpentier,F.Lepoutre,andL.Bertrand,J.Appl.
Phys.53,608(1982).
[22℄ G. Rousset, F. Lepoutre, and L. Bertrand, J. Appl.
Phys.54,2383(1983).
[23℄ P. Korpiun and B. Buhner, Appl. Phys. B30,
121(1983).
[24℄ A.C.Bento,MasterDissertation;presentedto
IFGW-UNICAMP,Campinas-SP,Brazil, 1987.
[25℄ G.M.Sessler,J.Aoust.So.Am.35,1354(1963).
[26℄ L.F.PerondiandL.C.M.Miranda,J.Appl.Phys.62,
2955(1987).
[27℄ N.F.Leite,N.Cella, H.Vargas,and L.C.M.Miranda,
J.Appl. Phys.61,3025(1987).
[28℄ C.L.Cesar, H.Vargas, J.Pelzl,andL.C.M. Miranda,
J.Appl. Phys.55,3460(1984).
[29℄ M.L. Baesso, Dotoral Thesis presented to
IFGW-UNICAMP,Campinas-SP,Brazil, 1990.
[30℄ F.A. MDonald, G.C. Wetsel Jr., J. Appl. Phys. 49,
2313(1978).
[31℄ O.PessoaJr.,C.L.Cesar, N.A.Patel,H.Vargas,C.C.
Chizoni,andL.C.M.Miranda,J.Appl.Phys.59,1316
(1986).
[32℄ S.Kammer,K.Albinsky,B.Sandner,andS.Wartewig,
Polymer40,1131(1999).
[33℄ J.M.Stegge,M.W.Urban,Polymer42,5479 (2001).
[34℄ B.R.Kiland, M.W. Urban, and R.A.Ryntz, Polymer
42,337(2001).
[35℄ H.Kim,M.W. Urban,Langmuir16,5382(2000).
[36℄ B.R.Kiland, M.W. Urban, and R.A.Ryntz, Polymer
41,1597 (2000).
[37℄ L. Gonon, O.J. Vasseur, and J.L. Gardette, Appl.
Spetr.53,157(1999).
[38℄ R.M. Dittmar, J.L. Chao, and R.M. Palmer, Appl.
Spetr.45,1104(1991).
[39℄ M.G.Oliveira,O.PessoaJr.,H.Vargas,andF.
Galem-bek,J.Appl.Pol. Si.35,1791(1988).
[40℄ C.L.Cesar, C.A.S. Lima,N.F.Leite,H. Vargas, A.F.
Rubira, and F. Galembek, J. Appl. Phys. 57, 4431
(1985).
[41℄ A.Torres-Filho,N.F.Leite,L.C.M.Miranda,N.Cella,
andH.Vargas,J.Appl.Phys.66,97(1989).
[42℄ L.Olenka,
E.N.daSilva,W.L.F.dosSantos,A.F.
Ru-bira,E.C.Muniz,A.N.Medina,M.L.Baesso,andA.C.
Bento,TheAnalyst,127,300(2002).
[43℄ D.T. Dias, Master Dissertation presented to
DFI-UEM, Maringa-PR, Brazil, 2001. D.T. Dias, M.F.
Porto, A. F.Rubira, A.N. Medina,M.L. Baesso, and
A.C.Bento,submittedtoJ.Appl.Pol.Si.2002.
[44℄ L.R. Touloukian, R.W. Powell, C.Y. Ho, and M. C.
Niolasu,ThermalDiusivity,vol.10,IFI/PLENUM,
NewYork(1973).
[45℄ P. Korpiun, B.Merte, G.Fritsh,R. Tilgner, and E.
Lusher,Coll.&Pol.Si.261,312(1983).
[46℄ A. Lahaineand P.Poulet,Appl. Phys.Lett. 45,953
(1984).
[47℄ A.C.R.daCostaandA.F.Siqueira,J.Appl.Phys.80,
5579(1996).
[48℄ W.L.B. Mello and R.M. Faria, Appl. Phys.Lett. 67,
3892(1996).
[49℄ J.E. deAlbuquerque, W.L.B.Mello, and R.M. Faria,
J.Appl.Pol.Si.B-Pol.Phys.38,1294(2000).
[50℄ B.Bonno,J.L.Laporte,andR.T.d'Leon,Meas.Si.
Tehnol.12,671(2001).
[51℄ A.Yoshida,H.Nogami,T.Kurita,andS.Washio,
An-nal.Si.17,s154(2001).
[52℄ T. Tominaga, K. Ito, Jap. J. Appl. Phys. 27, 2392
(1988).
[53℄ A.M.Mansanares,A.C.Bento,H. Vargas,N.F.Leite,
andL.C.M.Miranda,Phys.Rev.B42,4477(1990).
[54℄ P.HelanderandI.Lundstrom,J.Appl.Phys.52,1146
(1981).
[55℄ M.Morita,Jap.J.Appl.Phys.20,835(1981).
[56℄ N.Cella,H.Vargas,E.Galembek,F.Galembek,and
L.C.M. Miranda,J.Appl.Pol.Si.-C,27,313(1989).
[57℄ J.R.M. d 'Almeida, N. Cella, S.N. Monteiro, and
L.C.M. Miranda,J.Appl.Pol.Si.69,1335 (1998).
[58℄ J.R.M.d'AlmeidaandN.Cella,J.Appl.Pol.Si.77,
2486(2000).
[59℄ W.L.F.dosSantos,M.F.Porto,E.C.Muniz,L.Olenka,
M.L. Baesso, A.C. Bento, and A.F. Rubira, J. Appl.
Pol.Si.77,289(2000).
[60℄ L. Olenka,
E. N. da Silva , W.L.F. dos Santos, A.F.
Rubira,E.C.Muniz,A.N.Medina,L.P.Cardoso,M.L.
Baesso, L.C.M.Miranda,andA.C.Bento,Annal.Si.
17,s387(2001).
[61℄ L.Olenka,
E.N.daSilva,W.L.F.dosSantos,E.C.
Mu-niz, A.F.Rubira,A.N.Medina,L.P.Cardoso, L.C.M.
Miranda, M.L. Baesso, and A.C. Bento, J. Phys. D:
Appl.Phys.34,2248 (2001).
[62℄ H. Kobayahi, K.Yoshida,M. Kubo,T.Tsukada, M.
Hosawa, and M. Sato, J. Chem. Eng. Japan 33, 47