Article
J. Braz. Chem. Soc., Vol. 26, No. 3, 466-474, 2015. Printed in Brazil - ©2015 Sociedade Brasileira de Química 0103 - 5053 $6.00+0.00
A
*e-mail: [email protected]
A Prompt, Tough and Eco-Friendly (PTOCO) System for Mini-Scale Extraction of
Samples for Antioxidant Capacity Assays
Thiago Claus,*,a Oscar O. Santos Júnior,a Janksyn Bertozzi,a Swami A. Maruyama,a
Sylvio V. Palombini,a Eduardo J. Pilau,a Carlos A. P. da Camara,b Makoto Matsushitaa
and Jesuí V. Visentainera
aDepartment of Chemistry, State University of Maringa, Av. Colombo, 5790,
87020-900 Maringá-PR, Brazil
bDepartment of Chemistry, State University of Londrina, Rd. Celso Garcia Cid, Pr 445 Km 380,
86057-970 Londrina-PR, Brazil
The compound extraction is an important step before analyzing composition of samples with antioxidant capacity. Several extraction conditions can be employed (temperature, polarity of solvent and extraction time, for example), and the chosen variables exert great influence upon final results. Thus, in order to execute an efficient extraction, it is needed to manage them with rigor. In this work, a new device was designed and tested. The Prompt, TOugh and eCO-friendly (PTOCO) system is the first equipment in mini-scale that allows a good control of antioxidants extraction conditions. It is a simple and cheap device that only needs small amounts of sample and solvent to obtain sufficient volumes of extract for application in routine analytical methods. Twenty experiments from an experimental design were executed using only 0.5 g of oregano and 60 mL of water. The total antioxidant capacity assays, as well as the mass spectra, confirmed the extraction efficiency.
Keywords: green extraction, DPPH, FRAP, ORAC
Introduction
The analyte extraction (or extraction method) is an important step before analyzing the composition of a food matrix with antioxidant capacity. In laboratories specialized in food analysis, such procedure is performed routinely.1 There are several possibilities of extraction conditions considering the factors that might be chosen and employed, such as: temperature, solvent polarity, stirring frequency, sample particle size, among others.2,3 Since standardized extraction methods of antioxidant compounds do not exist and each matrix has its own variety of analytes, it is necessary to execute such extraction with procedures, which allow to optimize the chemical composition of obtained extracts.4,5 Exact extraction conditions must be selected with care, because wrong decisions might lead to undesired chemical reactions, and the identification/quantification of compounds which compose the extract will be compromised, and results will not correspond to the food matrix in question, generating
wrong conclusions.6 Normally, simple extractions with solvents under magnetic stirring, that take into account the principle of interaction through polarity between solvent and sample, are widely employed. However, such method does not allow a rigorous control of extraction conditions and, despite of statistical design applications, the system does not show satisfactory reproducibility conditions, leading to results with significant standard deviations, as the ones published by Rababah et al.7 Methods with magnetic stirring usually are not fast, and depending on how much time sample and solvent are in contact with each other, the analytes can react between themselves, generating other compounds, which are undesirable for a specific compound quantification. Besides, the conventional methods for antioxidant compounds extraction have serious problems, such as: low yields, steps that demand great amounts of time and solvents of acute toxicity.1
pressures and low temperatures are used; however, such extraction might take several hours. Besides this reason, total involved costs are high due to equipment prices and their high electric energy consumption. These factors prevent the use of such apparatus in laboratories, which possess low financial resources, despite their need of executing daily extractions of antioxidant compounds.11 Another frequently used extraction method is pressurized liquid extraction (PLE),4 but it is not a cheap technique, due to high acquisition/maintenance costs related with specified PLE equipments.
Since it is clear the importance of producing equipments which are simple, cheap and aimed to allow the control of important extraction variables, this work presents a new mini-scale antioxidant compound extraction device which attends these needs, the P = Prompt, TO = TOugh and CO = eCO-friendly (PTOCO) system. It allows optimizing the production of extracts for subsequent use in total antioxidant capacity assays because it controls with rigor the temperature, volume and solvent flow, while reducing extraction time to approximately 1 min per sample. The total cost of PTOCO system is low because it is simple to build, does not demand great amounts of sample/solvent for extraction, and the obtained extract may be used for direct analytical methods, eliminating the need of drying after extraction.
Experimental
Oregano sampling
For tests on PTOCO system, oregano (Origanum vulgare L.) was chosen as sample because it is a known food matrix of easy handling and known antioxidant compound composition.12-14 Besides, significant works13,14 in the food science area were published with it, allowing the comparison of results obtained from the proposed system (PTOCO) with the ones achieved by conventional magnetic stirring method. Five different batches of oregano leaves (all from the same brand) were acquired in the local commerce. Leaves were mixed, milled and sieved in order to standardize sample particle size between 0.177 and 0.297 mm. Prior to analyses, the sample was stored under vacuum at −18 °C.
Description of PTOCO system components
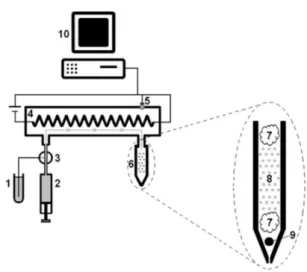
Figure 1 shows the PTOCO system schematics. A recipient containing the solvent for extraction (1) fills the automated piston pump (2). A multichannel solenoid valve (3) controls the solvent aspiration and injection and allows the solvent to enter inside heating zone (4) and to come in contact with sample (6). A temperature sensor (5)
sends a signal to command the Arduino software, to turn the resistance on/off, in order to keep the temperature at desired levels, without abrupt variations on them during extraction time. Sample cartridge (6) is formed by a pipette tip containing cotton (7), the sample itself (8) and a little glass pellet (9), which prevents tip obstruction. The system responsible by data collection/management (10) is composed of a computer with Arduino chip plate/software connected with the other parts of PTOCO apparatus through an USB cable. It is important to mention that the extraction mechanism of antioxidant compounds is based on their affinity (polarity) with the extraction solvent in question (water, in the case of this article).
Experimental procedure for extraction of antioxidant compounds
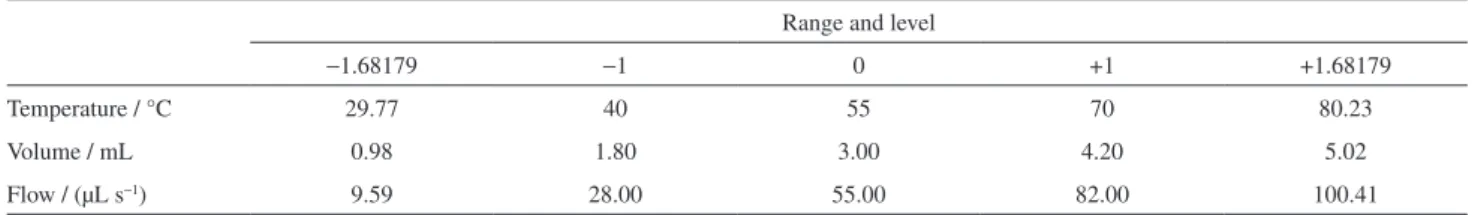
The pipette tips containing sample were individually prepared with 25.0 mg of oregano according to Figure 1. The solvent reservoir (1) was filled with Milli-Q water obtained from a purifying system (Millipore Corporation, Billerica, MA, USA). A central composite rotary design, generated by Design Expert 7 software was used to optimize the extraction of analytes by using different levels of temperature, volume and solvent flux with six replicates in central point, leading to twenty experiments. The levels and variable used are listed in Table 1.
Antioxidant capacity analysis of extracts through conventional DPPH assay
Initially, the antioxidant capacity of extracts was measured through a conventional
2,2-diphenyl-1-Figure 1. PTOCO system schematics (1: solvent reservoir, 2: automated
picrylhydrazyl (DPPH) free radical capture method, done according with Brand-Williams, Cuvelier and Berset,15 with some modifications. Extracts were diluted in a ratio of 1:10 sample/water, and then an aliquot of 25.0 µL was mixed with 2.0 mL of a methanolic solution of DPPH 6.25 × 10⁻⁵ mol L−1. The mixture was kept in the dark for 30 min and the absorbance was measured at 517 nm in a spectrophotometer model Genesys 10 UV-Vis (Thermo Scientific, Madison, USA). Methanolic solutions of Trolox [(±)-6-hydroxi-2,5,7,8-tetramethylcromane-2-carboxylic acid] with different concentrations were used to achieve the calibration curve and the antioxidant capacity was expressed in µmol of Trolox equivalent (TE) g−1 of fresh sample.
Oxygen radical absorbance capacity (ORAC)
The oxygen radical absorbance capacity (ORAC) was executed according to Zulueta et al.,16 with some modifications. The entire procedure was developed at 37 °C, using potassium phosphate buffer (75.0 mmol L−1, pH 7.0) as solvent. ORAC analysis was conducted in a microplate reader (Victor X4, Perkin-Elmer, USA) with fluorescence filters with excitation and emission wavelengths of 485 and 535 nm, respectively. In each recipient, inside the microplate, 150 µL of fluorescein (4.0 nmol L−1), 25 µL of diluted (1:10) sample extract were added. A blank with only phosphate buffer was obtained and quantification was executed with Trolox solutions in different concentrations. The microplate was heated to 37 °C for 10 min, and 25 µL of 2,2’-azobis(2-amidinopropane) dihydrochloride (160 mmol L−1) was added. Fluorescence was immediately measured after addition of radical and the other measurements were obtained at intervals of 1 min, during 30 min. Results were expressed in Trolox equivalent per µmol g−1of fresh sample.
Ferric reducing antioxidant power (FRAP)
The ferric reducing antioxidant power (FRAP) solution was prepared as described by Benzie and Strain,17 diluting
an aqueous solution of 10.0 mmol L−1 2,4,6-tris(2-pyridyl)-s-triazine (TPTZ) and 20.0 mmol L−1 ferric chloride in 300.0 mmol L−1 sodium acetate buffer (pH 3.6) at a ratio of 1:1:10 (v:v:v). Aqueous solutions of FeSO4.7H2O were used in calibration curve and results were expressed in Fe2+ g−1 of fresh sample.
Statistical analysis
All analyses were carried out in quadruplicate. The experimental results were analyzed through a response surface methodology generated by the Design-Expert 7 software (Stat-Ease Inc., USA). The response was adjusted to the factors through multiple regression. Model fit quality was evaluated by variance analysis and determination coefficients. The quadratic model was adjusted with the following equation:
2
0 i i ii i ij i j
i i i jj
Y
β
β
X
β
X
β
X X
ε
<
=
+
∑
+
∑
+
∑∑
+
(1)where Y is the response factor; χi the ith independent
factor; β0 the intercept; βi the first order coefficient of the
model; βii the quadratic coefficient of i factor; βij the linear
coefficients of the model for interaction between i and j factors; and ε the experimental error attributed to Y.
Mass spectra of antioxidant compound extracts
Mass spectra of the phenolic compounds profile were collected according to Zhao et al.,18 mass spectrometry with electrospray ionization (ESI-MS) was performed in a MICROMASS® Quattro MicroTM API. The mass spectra were recorded with ESI in the negative mode. The parameters were as follows: voltage of the employed capillar: 2.00 kV, cone voltage: 20 V, source temperature: 100 °C, desolvation temperature: 200 °C, desolvation gas flow rate: 350 L h−1, cone gas flow rate: 50 L h−1, scanning range: from 100 to 700 amu. These parameters were optimized in preliminary experiments to get the highest abundance of the targeted molecular-related ions. N2 was used as both dry gas and nebulizer gas.
Table 1. Experimental range and levels of variables for extraction procedures
Range and level
−1.68179 −1 0 +1 +1.68179
Temperature / °C 29.77 40 55 70 80.23
Volume / mL 0.98 1.80 3.00 4.20 5.02
Results and Discussion
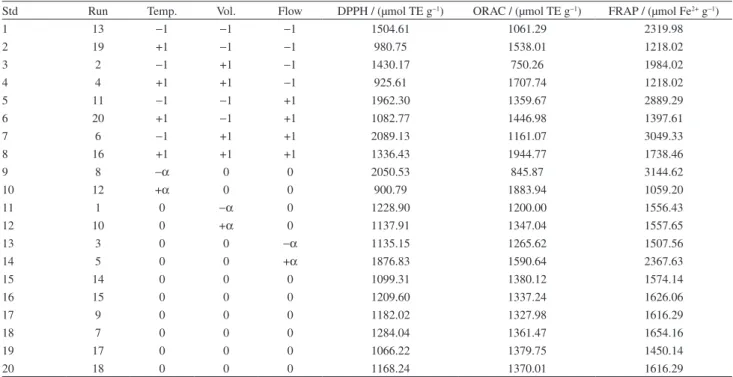
Table 2 shows the results of total antioxidant capacity (TAC) for every experiment.
The greatest DPPH results correspond to 5, 7 and 9 samples (1962.30, 2089.13 and 2050.53 µmol TE g−1, respectively). The same samples generated the best results for FRAP analysis (2889.29, 3049.33 and 3144.62 µmol Fe2+ g−1, respectively). The concordance between DPPH and FRAP results can be attributed to the similarity of their reaction mechanisms, since both are based on electron transference.19 For ORAC analysis, the best results came from 8 (1944.77 µmol TE g−1) and 10 (1883.94 µmol TE g−1). These values are superior regarding the ones obtained by Su et al.20 (1233 ± 41.36 TE µmol g−1) and Hossain et al.21 (1562.2 µmol g−1). These ORAC results differ from the observed for the other applied methods, because the mechanism of this assay goes through hydrogen atom transfer. Since different antioxidants are responsible for the reaction with the employed radicals, this is the reason for difference between results.22,23 Samples 15 to 20 refer to central points from the factorial design. Evaluating such points confirms the ruggedness of antioxidant compound extraction through PTOCO system, because in these experiments the experimental errors were not above 6%, regardless of TAC assay type.23
The strong correlation between DPPH and FRAP methods (r = 0.982) can also be observed in Figure 2.
Pearson correlation coefficients, −0.444 and −0.524, were calculated for DPPH vs. ORAC and FRAP vs. ORAC, respectively. The obtained values for Pearson correlation involving ORAC assay are lower than the achieved for DPPH vs. FRAP because of different antioxidant-radical reaction mechanisms, as mentioned before. However, every extraction of central point was executed with precision, because upon calculating mean and standard deviation (1359.43 ± 20.16), as well as the coefficient of variation (CV = 1.48%), it can be concluded that the empirical error is low, regarding mean value.
The responses shown in Figure 2 were analyzed through analysis of variance (ANOVA) and response surface methodology. Multiple regression analysis was employed upon all data and, among the models which were suggested by the software (linear, 2FI, quadratic and cubic), the
Table 2. Results of antioxidant capacity by DPPH, ORAC and FRAP assays
Std Run Temp. Vol. Flow DPPH / (µmol TE g−1) ORAC / (µmol TE g−1) FRAP / (µmol Fe2+ g−1)
1 13 −1 −1 −1 1504.61 1061.29 2319.98
2 19 +1 −1 −1 980.75 1538.01 1218.02
3 2 −1 +1 −1 1430.17 750.26 1984.02
4 4 +1 +1 −1 925.61 1707.74 1218.02
5 11 −1 −1 +1 1962.30 1359.67 2889.29
6 20 +1 −1 +1 1082.77 1446.98 1397.61
7 6 −1 +1 +1 2089.13 1161.07 3049.33
8 16 +1 +1 +1 1336.43 1944.77 1738.46
9 8 −α 0 0 2050.53 845.87 3144.62
10 12 +α 0 0 900.79 1883.94 1059.20
11 1 0 −α 0 1228.90 1200.00 1556.43
12 10 0 +α 0 1137.91 1347.04 1557.65
13 3 0 0 −α 1135.15 1265.62 1507.56
14 5 0 0 +α 1876.83 1590.64 2367.63
15 14 0 0 0 1099.31 1380.12 1574.14
16 15 0 0 0 1209.60 1337.24 1626.06
17 9 0 0 0 1182.02 1327.98 1616.29
18 7 0 0 0 1284.04 1361.47 1654.16
19 17 0 0 0 1066.22 1379.75 1450.14
20 18 0 0 0 1168.24 1370.01 1616.29
±α refers to ±1.68179 levels of the employed rotary central composite design.
y = 1 6061x. - 312 94.
R² = 0 9646.
700 1200 1700 2200 2700 3200
700 1200 1700 2200
FRAP
/ (
µmol
Fe
2+
g
-1)
DPPH / (µmol TE g-1)
quadratic model was selected as the most suitable, because it has a high significance order and it is not aliased.23 The
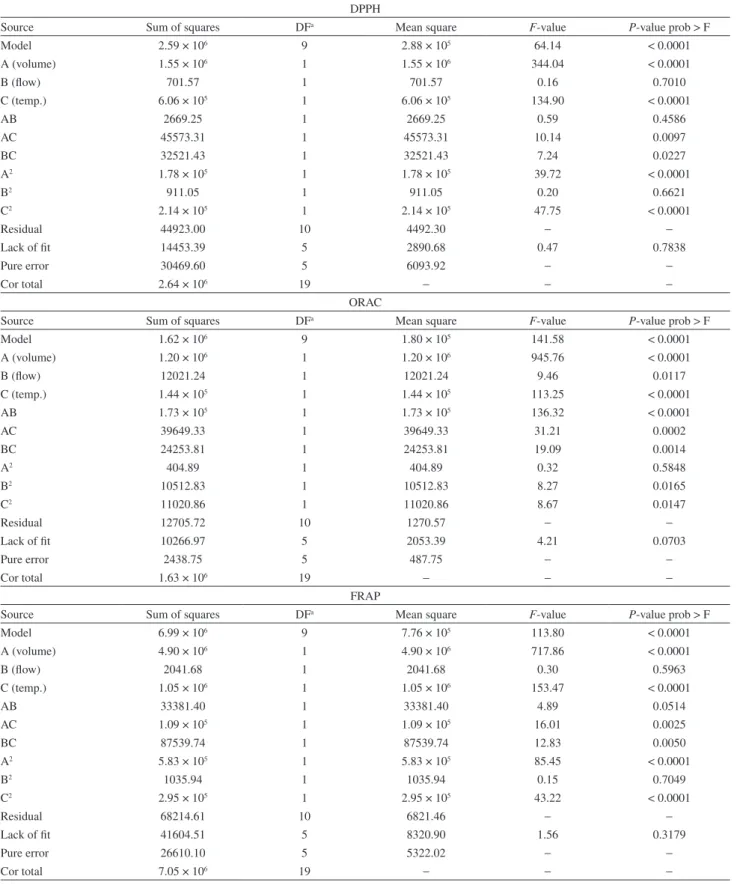
adjusted models for DPPH, FRAP and ORAC, as well as their ANOVA parameters, are listed in Table 3. ANOVA
Table 3. ANOVA and quadratic models for the obtained responses
DPPH
Source Sum of squares DFa Mean square F-value P-value prob > F
Model 2.59 × 10⁶ 9 2.88 × 10⁵ 64.14 < 0.0001
A (volume) 1.55 × 10⁶ 1 1.55 × 10⁶ 344.04 < 0.0001
B (flow) 701.57 1 701.57 0.16 0.7010
C (temp.) 6.06 × 10⁵ 1 6.06 × 10⁵ 134.90 < 0.0001
AB 2669.25 1 2669.25 0.59 0.4586
AC 45573.31 1 45573.31 10.14 0.0097
BC 32521.43 1 32521.43 7.24 0.0227
A2 1.78 × 10⁵ 1 1.78 × 10⁵ 39.72 < 0.0001
B2 911.05 1 911.05 0.20 0.6621
C2 2.14 × 10⁵ 1 2.14 × 10⁵ 47.75 < 0.0001
Residual 44923.00 10 4492.30 − −
Lack of fit 14453.39 5 2890.68 0.47 0.7838
Pure error 30469.60 5 6093.92 − −
Cor total 2.64 × 10⁶ 19 − − −
ORAC
Source Sum of squares DFa Mean square F-value P-value prob > F
Model 1.62 × 10⁶ 9 1.80 × 10⁵ 141.58 < 0.0001
A (volume) 1.20 × 10⁶ 1 1.20 × 10⁶ 945.76 < 0.0001
B (flow) 12021.24 1 12021.24 9.46 0.0117
C (temp.) 1.44 × 10⁵ 1 1.44 × 10⁵ 113.25 < 0.0001
AB 1.73 × 10⁵ 1 1.73 × 10⁵ 136.32 < 0.0001
AC 39649.33 1 39649.33 31.21 0.0002
BC 24253.81 1 24253.81 19.09 0.0014
A2 404.89 1 404.89 0.32 0.5848
B2 10512.83 1 10512.83 8.27 0.0165
C2 11020.86 1 11020.86 8.67 0.0147
Residual 12705.72 10 1270.57 − −
Lack of fit 10266.97 5 2053.39 4.21 0.0703
Pure error 2438.75 5 487.75 − −
Cor total 1.63 × 10⁶ 19 − − −
FRAP
Source Sum of squares DFa Mean square F-value P-value prob > F
Model 6.99 × 10⁶ 9 7.76 × 10⁵ 113.80 < 0.0001
A (volume) 4.90 × 10⁶ 1 4.90 × 10⁶ 717.86 < 0.0001
B (flow) 2041.68 1 2041.68 0.30 0.5963
C (temp.) 1.05 × 10⁶ 1 1.05 × 10⁶ 153.47 < 0.0001
AB 33381.40 1 33381.40 4.89 0.0514
AC 1.09 × 10⁵ 1 1.09 × 10⁵ 16.01 0.0025
BC 87539.74 1 87539.74 12.83 0.0050
A2 5.83 × 10⁵ 1 5.83 × 10⁵ 85.45 < 0.0001
B2 1035.94 1 1035.94 0.15 0.7049
C2 2.95 × 10⁵ 1 2.95 × 10⁵ 43.22 < 0.0001
Residual 68214.61 10 6821.46 − −
Lack of fit 41604.51 5 8320.90 1.56 0.3179
Pure error 26610.10 5 5322.02 − −
Cor total 7.05 × 10⁶ 19 − − −
showed that the lack of fit obtained for the models was insignificant, meaning they were suitable for evaluation of response surfaces.
The obtained model for DPPH analyses generated a F-test value of 64.14, indicating that such model is significant. A “Prob > F” value below 0.0500 implies that its respective model term is significant. In this case, A, C, AC, BC, A2 and C2 are significant model terms (A = volume, B = flow, C = temperature). However, the remaining terms also were considered for further steps, because they make part of model hierarchy, despite their low significances. The F-value for lack of fit (0.47) indicates that the model is very well adjusted and errors are justified by pure error value. The R2, adjusted R2 and CV values (0.9830, 0.9676 and 5.03%, respectively) also indicate that the obtained model is satisfactory, linear and precise.
For ORAC analyses, the F-value from model (141.58) indicates its significance. In this model, A, B, C, AB, AC, BC, B2 and C2 are significant terms. The R2, adjusted R2 and CV values (0.9922, 0.9852 and 2.62%, respectively) indicate the strong correlation for the obtained model, as well as its good linearity and precision.
ANOVA of FRAP data showed an significant model F-value of 113.80. The significant terms of this model are: A, C, AC, BC, A2 and C2. The F-value for lack of fit (1.56) indicates that the model is well adjusted and errors occur due to pure error. The R2, adjusted R2 and CV values (0.9903, 0.9816 and 4.52%, respectively) also indicate that the obtained model is satisfactory, linear and precise.
Thus, models were adjusted with basis in real values, in function of the studied variables and these adjustments led to the equations below:
DPPH = 3467.98478 − 544.38688 (A) − 11.28419 (B) − 41.68117 (C) + 0.56377 (AB) − 4.19312 (AC) + 0.15743 (BC) + 77.27688 (A2) + 0.010907 (B2) +
0.54223 (C2) (2)
ORAC = 988.65024 + 190.43754 (A) − 15.92755 (B) − 2.42082 (C) + 4.54146 (AB) − 3.91111 (AC) + 0.13595 (BC) + 3.68089 (A2) − 0.037049 (B2) +
0.12291 (C2) (3)
FRAP = 5297.84792 − 1089.69061 (A) − 21.01340 (B) − 46.20078 (C) + 1.99371 (AB) − 6.49021 (AC) + 0.25829 (BC) + 139.66602(A2) + 0.011630 (B2) +
0.63567 (C2) (4)
(A = volume, B = flow, C = temperature)
Positive signals indicate synergic effects in results, while negative signals indicate antagonic effects, as described by Neto.23
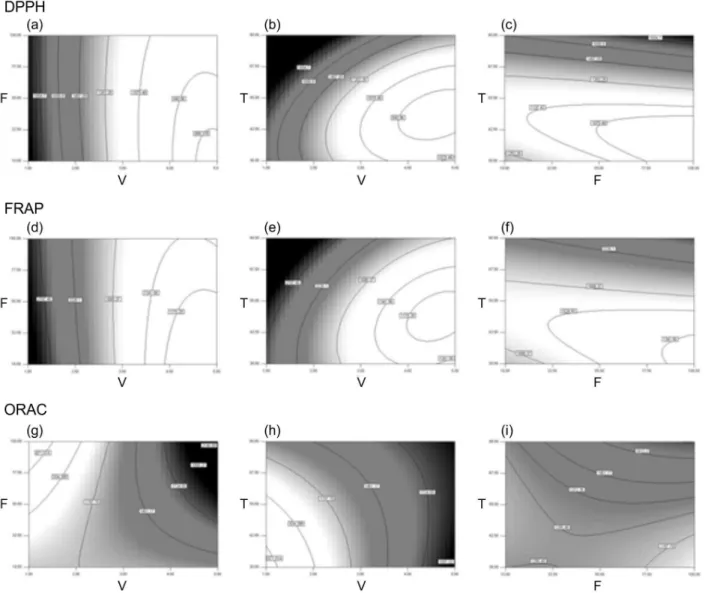
Figure 3 shows the contour surface graphs for the executed analyses. It is evident the trend of results from DPPH graphs (a, b and c) when compared to FRAP graphs (d, e and f). In both, the greatest TAC values are related with extraction conditions of lower volumes and higher temperatures/solvent flows. However, the greatest TAC results for ORAC analysis (g, h and i) are attributed to conditions with greater solvent volume, while still using high temperatures/solvent flows through the cartridge.
In Figure 4, it can be observed the MS profiles of the obtained phenolic compounds for two different antioxidant extraction conditions used on PTOCO system. Mass spectrometry was an important tool in order to detect the main compounds (listed in the caption of Figure 4), which were extracted through the PTOCO system. The coupling of this method with ESI, which allows the ion generation through non-volatile species in liquid phase, makes possible the analysis and identification of phenolic compounds from oregano extracts. The main advantage of ESI over other ionization methods is the gradual desolvation in relatively low temperatures (from room temperature to 80 °C), avoiding formation of molecular fragments. ESI was performed in negative mode because analytes, which are composed of carboxylic acids and/or phenols, can be easily deprotonated, enhancing their detection in negative mode.24 The phenolic compounds of interest were identified through comparison of the observed data with monoisotopic masses, in negative mode, of several polyphenols from the literature. The unidentified peaks are not relevant to this work, since they do not have characteristics of compounds with antioxidant activity, despite being extractable in the employed conditions. While both spectra show the same types of analytes, there are differences regarding peak intensity.
lead to more intense peaks regarding the spectrum in Figure 4b. Spectra of samples 15-20, all from the central points of factorial design, showed very similar profiles, no visual significant differences were detected after plotting them at the same time. Such result also demonstrates the ruggedness of antioxidant compound sample achievement through the PTOCO system.
Conclusions
Twenty experiments from an experimental design were executed using only 0.5 g of oregano and 60 mL of water. These amounts are much lower when compared with the amounts of sample and solvent demanded by conventional extraction methods. Besides this economy, with the rigorous control of employed variables, results from PTOCO system were more reproducible than the ones achieved through traditional magnetic stirring
method. The extracts of antioxidant compounds from oregano submitted to the PTOCO system are suitable for TAC analyses, as proven by DPPH, FRAP and ORAC methods. Through ANOVA and RSM, it was observed that the executed extractions are easy to optimize, and the considered variables, as well as their interactions are significant for the final models. The MS spectra of the extracts from central points of the experimental design confirmed the ruggedness of the PTOCO system in terms of not altering in a significant way the molecular composition of different extracts obtained from similar conditions. However, if such conditions are very different, their respective MS spectra will also show discrepancies between them. Since the extractions with water were a success, this study demands future extraction studies with other solvents. Thus, the PTOCO system unites precise and rugged results with the advantages of simple, fast and cheap process that can be operated by any person.
Figure 4. MS profiles of the obtained phenolic compounds for two different antioxidant extraction conditions [spectrum (a) = sample 7 and spectrum (b) = sample 20], which were used on PTOCO system. 1 = pyrrole-2-carboxylic acid (m/z 110.8); 2 = 5-hydroxyindole (m/z 132.8); 3 = aminosalicylic acid (m/z 152.8); 4 = coumaric acid (m/z 323.0); 5 = cafeic acid (m/z 178.9); 6 = 5-hydroxyindole-3-acetic acid (m/z 191.9); 7 = 2-hidroxyhippuric acid (m/z 194.9); 8 = coumaric acid O-hexoside 1 (m/z 324.99); 9 = rosmarinic acid (m/z 359.0); 10 = mangiferin (m/z 421.0).
Acknowledgements
Financial support by Coordenação de Aperfeiçoamento de Pessoal de Nível Superior (CAPES), Brazil.
References
1. Kukula-Koch, W.; Aligiannis, N.; Halabalaki, M.; Skaltsounis, A.; Glowniak, K.; Kalpoutzakis, E.; Food Chem.
2013, 138, 406.
2. Liyana-Pathirana, C.; Shahidi, F.; Food Chem.2005, 93, 47. 3. Sahin, S.; Aybastıer, O.; Isik, E.; Food Chem. 2013,141, 1361. 4. Mustafa, A.; Turner, C.; Anal. Chim. Acta2011,703, 8.
5. Kumar, M. S. Y.; Dutta, R.; Prasad, D.; Misra, K.; Food Chem. 2011, 127, 1309.
6. Meng, D.; Lu, J.; Fan, W.; Dong, J.; Zhang, J.; Kong, W.; Lin, Y.; Shan, L.; J. Food Biochem. 2009, 33, 291.
7. Rababah, T. M.; Banat, F.; Rababah, A.; Ereifej, K.; Yang, W.; J. Food Sci. 2010, 75, 626.
8. Yang, Y.; Kayan, B.; Bozer, N.; Pate, B.; Baker, C.; Gizir, A. M.; J. Chromatogr. A2007, 1152, 262.
9. Cavero, S.; García-Risco, M. R.; Marín, F. R.; Jaime, L.; Santoyo, S.; Señoráns, F. J.; Reglero, G.; Ibañez, E.; J. Supercrit. Fluids2006, 38, 62.
11. Rodríguez-Meizoso, I.; Castro-Puyana, M.; Börjesson, P.; Mendiola, J. A.; Turner, C.; Ibáñez, E.; J. Supercrit. Fluids
2012, 72, 205.
12. Miron, T. L.; Plaza, M.; Bahrim, G.; Ibáñez, E.; Herrero, M.; J. Chromatogr. A2011, 1218, 4918.
13. Boroski, M.; Giroux, H. J.; Sabik, H.; Petit, H. V.; Visentainer, J. V.; Matumoto-Pintro, P. T.; Britten, M.; LWT--Food Sci. Technol.2012, 47, 167.
14. Aranha, C. P. M.; Jorge, N.; Br. Food J.2012, 147, 954. 15. Brand-Williams, W.; Cuvelier, M. E.; Berset, C.; LWT--Food
Sci. Technol.1995, 28, 25.
16. Zulueta, A.; Esteve, M. J.; Frígola, A.; Food Chem. 2009, 114, 310.
17. Benzie, I. F. F.; Strain, J. J.; Anal. Biochem. 1996, 239, 70. 18. Zhao, Z.; Dong, L.; Lin, F.; Wu, Y.; Arabian J. Chem. 2013, 6,
205.
19. Pandey, K. B.; Rizvi, S. I.; Int. J. Food Prop. 2012, 15, 702. 20. Su, L.; Yin, J.; Charles, D.; Zhou, K.; Moore, J.; Yu, L.; Food
Chem. 2007, 100, 990.
21. Hossain, M. B.; Barry-Ryan, C.; Martin-Diana, A. B.; Brunton, N. P.; Food Chem. 2010, 123, 85.
22. Bisby, R. H.; Brooke, R.; Navaratnam, S.; Food Chem. 2008, 108, 1002.
23. Neto, B. B.; Scarminio, I. S.; Bruns, R. E.; Como Fazer Experimentos: Pesquisa e Desenvolvimento na Ciência e na
Indústria, 3a ed.; UNICAMP: Campinas, 2007.
24. Gómez-Romero, M.; Zurek, G.; Schneider, B.; Baessmann, C.; Segura-Carretero, A.; Fernández-Gutiérrez, A.; Food Chem. 2011, 124, 379.
Submitted: September 2, 2014
![Figure 4. MS profiles of the obtained phenolic compounds for two different antioxidant extraction conditions [spectrum (a) = sample 7 and spectrum (b) = sample 20], which were used on PTOCO system](https://thumb-eu.123doks.com/thumbv2/123dok_br/18999380.463242/8.892.108.815.120.440/profiles-obtained-phenolic-compounds-different-antioxidant-extraction-conditions.webp)
