Abstract — Analysis of impedance spectrum of electroporated biological cell suspensions allows evaluating the state of permeabilization produced by the applied electric field. In this article we used a genetic algorithm to determine parameters of a proposed model for the impedance of suspension adjusting them numerically in order to minimize the error in relation to experimental spectra of Kluyveromyces marxianus CBS 6556 yeasts suspended in distilled water. It was possible to determine the variation of conductivity of suspension avoiding the influence of electrode polarization and dielectric dispersion due to interfacial and diffusion polarization on the cell surface. It was observed that the conductivity in the range of 1 to 100 KHz increases 2.5 times with pulses of 400 KV/m.
Index Terms — Electroporation, Genetic Algorithm, impedance spectrum, yeast cell suspension.
I. INTRODUCTION
Electrical impedance measurement of biological cell suspensions can be used to obtain information
about concentration and size of the cells, internal and external conductivity and electrical properties of
the cell membrane. The early studies on electrical properties of biological material date from the
beginning of the last century, but the first revision probably was written in 1950 by H. P. Schwan. An
extensive review on the main models and experimental results was compiled by Foster and Schwan in
1995 [1].
One of the main difficulties in dispersion spectra analysis of biological material is the complexity of
the models. Even for spherical cells suspended in a homogeneous conductor, the equations based on
Maxwell-Wagner model have many parameters such as conductivity and dielectric constant of
internal and external media, cell diameter, cell concentration, capacitance and conductance of the cell
membrane. These parameters relate in a complex way to determine the dielectric response of the
suspension. Dispersion equations in this case, provided in the revision of Foster and Schwan [1],
describe a first order process. Moreover, when analyzing experimental results, the complexity
becomes greater due to the influence of electrode polarization which contributes significantly to the
total reactance at low frequencies [2].
An alternative approach for analyzing impedance spectra of cell suspensions is based on the use of
Numerical Analysis of Impedance Spectra of
Yeast Suspensions
Ramos Airton⃰, Farias D. Heric†,
Electrical Engineering Department Center of Technological Sciences State University of Santa Catarina - Brazil
⃰
Journal of Microwaves, Optoelectronics and Electromagnetic Applications, Vol. 12, No. 2 December 2013 648
numerical optimization methods, such as genetic algorithms [3]. With these methods it is possible
with only moderate programming effort and small processing time, determine the values of various
parameters used to fit the models with minimum error to impedance spectra obtained experimentally.
Electroporation is the process of pore openings in biological membranes by applying intense
electric field in cell suspensions or biological tissues [4]-[7]. In the permeabilized state, the
permeability and the conductivity of the cell membranes are increased resulting in higher conductivity
of the medium [8],[9]. Although the pore opening process still remains not completely understood, it
has been used as an important technique for tumor treatment, DNA and other macromolecules
transfection [7],[10]-[12]. Nowadays electroporation process also has been applicable to enzyme
extraction from yeast cells where this method proved to be more efficient than mechanical and
chemical lyses [13]-[15].
The aim of this paper is to present experimental results and numerical analysis of impedance
spectra of electroporated yeast suspensions obtained in different conditions of stimulation and using a
genetic algorithm for model parameters determination.
II. METHODS
Yeast cells of Kluyveromyces marxianus CBS 6556 were grown aerobically in shaken flasks
containing 0,15 L of culture medium (1% yeast extract, 2% bactopeptone and 2% lactose) and
incubated on an orbital shaker at 150 rpm, 30º C for 12 h. After reaching the stationary phase the
colonies were centrifuged for six minutes at 12,000 rpm in an Eppendorf centrifuge and the
supernatant was re-suspended in distilled water. This process is repeated three times. Observations in
an Olympus CX31 optical microscope indicated that cells are spheroidal with average diameter 9.74 ±
2.14 µm.
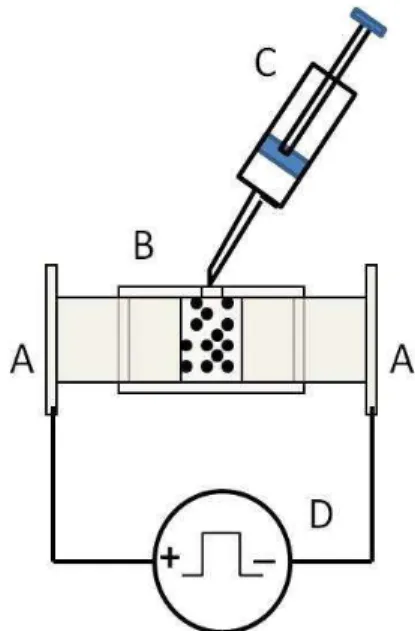
The electroporator consists basically of an arbitrary waveform generator implemented in a LabView
program commanding a PCI 6251 board from National Instruments and an amplification stage to
obtain up to 500 V and 5A (short pulses up to 20 ms) with balanced differential outputs. The signals
are generated with 16-bit resolution and sampling frequency of 500 KHz. Figure 1 shows a schematic
of the electroporation experiment. The sample holder consists of two cylindrical steel electrodes of
0.02 m diameter mounted on a nylon tube that keeps the surfaces of electrodes separated by 0.001 m.
All experiments were carried out at 25 °C. The generated signals where rectangular pulses with 1 to
10 ms duration and amplitude of 100 to 400 V.
Electrical impedance in the range 40 Hz to 40 MHz was measured on a 4294A Agilent
Technologies impedance analyzer. The samples were measured immediately prior to the application
of the electric field pulse and the measurement was repeated one minute after this application. This is
the time required to disconnect the sample holder of the electroporator and connect it to the
impedance analyzer as well as wait until the impedance reading stabilize.
relaxation process [1]. The equations (1) to (3) below show how the conductivity and dielectric
constant depends on the frequency and how the amplitudes of dispersion (Δ and Δεr) relate to the
relaxation time ( m).
2 22 2 1 m s m (1)
2 21 r r m
(2)
o r m
(3)
In these equations s is the low frequency conductivity and ε∞ is the high frequency dielectric
constant. By considering the geometry of the electrodes with parallel faces and small
spacing/diameter ratio, the equation (4) below represents the sample impedance as the sum of the
suspension impedance with the contact impedance with the metallic electrodes.
1 ct m r o sR d A
Z
j j
(4)
Where d and A are the distance and the area of the electrodes, respectively. The first term is the
electrode-electrolyte interface impedance model according to McAdams et al [2], where Rct is named
charge transfer resistance, β is a constant and s is the relaxation time for the process of charge transfer
at the interface. The second term is the impedance of the cell suspension, in which the conductivity
and dielectric constant are defined in equations (1) to (3). The numerical analysis of experimental
impedance spectra according to the model described by equations (1) to (4) seeks to determine seven
parameters: Rct, β, s, s, ε∞, Δεr and m.
The method used to the parameterization of the impedance model is based on a Genetic Algorithm,
which is a stochastic search technique based on natural selection and natural genetic mechanisms [3].
Journal of Microwaves, Optoelectronics and Electromagnetic Applications, Vol. 12, No. 2 December 2013 650
The program was developed with the following main components: (a) an initial population of
individuals consisting of associations of model's parameters in a pre-defined sequence. This initial
population is generated randomly; (b) a mechanism to appraise the response quality of each individual
of the population. This mechanism was based on the quadratic medium error; (c) a method for joining
fragments of the best individuals to form new ones in an attempt to obtain better individuals; (d) a
mutation operator to avoid permanent loss of diversity of individuals. This intrinsic generality of the
algorithm is responsible to its applicability to an extremely wide range of problems. We used 32-bit
unsigned integer to linearly encode each of the parameters. The size of the population was 100
individuals. The selection was carried out by “Russian roulette” with elitism [3] and the bit mutation
probability was fixed at 0.47% (equivalent to an average of 1.2 mutated bits per individual). Search
ranges for each parameter were estimated on a simplified prior analysis of spectra. The program was
written in C# language and was executed in Windows 7 operating system microcomputer with Core 2
Duo processor running at 3 GHz and 4 GB of RAM memory. Each simulation took about 100 ms to
converge with an error less than or equal to 1%. The error is obtained as the average squared
difference between numerical values and experimental values by taking as a reference the quadratic
mean of the experimental values.
III. RESULTS
The electroporation assays and impedance measurement were made with three different
suspensions with average volume fraction of cells around 3.3% obtained using the relationship
between o and Δ provided in the study by Ramos and Schneider [15]. For each suspension were
performed twenty-four assays with four field intensities (100, 200, 300 and 400 KV/m) and six time
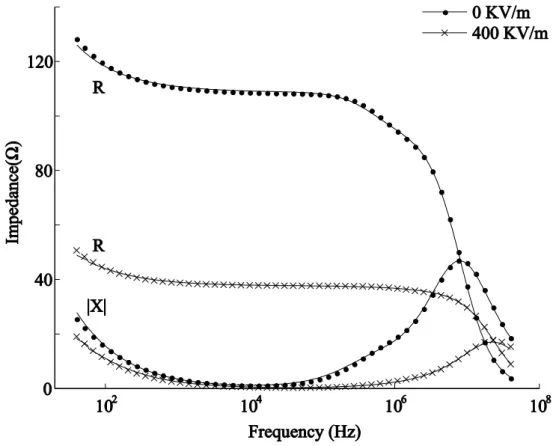
intervals (1, 2, 4, 6, 8 and 10 ms). Figure 2 shows the impedance spectrum obtained for a sample
submitted to 400 KV/m for 10 ms compared to the spectrum of the intact suspension. The points in
this figure correspond to the analytical model described in equation (4) whose numerically adjusted
parameters are shown in the figure caption. Sample impedance variations below 1 KHz are
determined by electrode polarization effects where the reactance and resistance increases as the
frequency decreases. However, above 1 KHz the sample impedance is determined by the properties of
the cell suspension. Between 1 KHz and 100 KHz the reactance is very low and the resistance
approximately independent of frequency. The resistance is high because the ionic current circulates
mainly on the external medium since the plasma membrane partially blocks the entry of ions in cells.
The main dielectric dispersion band occurs between 100 KHz and 1 MHz being due to interfacial
polarization on the surface of cell membranes [1]. The dispersion in impedance spectrum is perceived
by a little more intense reduction in resistance than would be expected by the normal process of
relaxation of the conductive medium. In the electroporated sample the resistance decreases
significantly between 1 and 100 KHz for about a third of the value prior to electroporation. This is
through intracellular medium, this way increasing the conductance of the suspension.
Table 1 presents the impedance model parameters obtained for all assays. The column named
“Zero” relates the mean values and standard deviations for the parameters of the seventy-two samples measured prior to the application of the electric field. The columns for the applied field provide the
average of eighteen values corresponding to six time intervals for each of the three suspensions. In the
model of the electrode interface impedance the parameter that presents greater variation with the
applied field is the charge transfer resistance. Probably the increase in resistance is due to the
accumulation of products of reactions that occur on the surface of the electrodes. After each
electroporation assay, the electrodes were cleaned and polished to remove the deposited layer. With
the increase of the field it was observed that the deposited layer was darker indicating greater
thickness. This layer possibly decreases the electric charge transfer between suspension and
electrodes. The parameter of the suspension impedance more intensely affected by electroporation is
the conductivity at low frequencies. The conductivity after application of 400 KV/m is greater than
twice the intact suspension's value. This is a direct consequence of pore opening in the plasma
membrane of cells. The moving ions in suspension can cross cell membranes through these pores. In
addition, some ions from the internal medium diffuse out cells through the pores, increasing the ion
concentration and conductivity of the external medium. In an intact suspension, ions accumulate in
the inner and outer faces of the membranes, producing the effect of interfacial polarization and
Fig. 2. Impedance spectrum of yeast suspension before and after applying the 400 KV/m field during 10 ms. R - resistance, |X| - reactance module. The numerically obtained parameters used to plot points are: 0 KV/m: Rct = 220 Ω, β = 0.66, s = 64
ms, s = 30 mS/m, Δεr = 108, m = 0.21 µs and ε∞ = 75; 400 KV/m: Rct = 142 Ω, β = 0,71, s = 45 ms, s = 85 mS/m, Δεr =
Journal of Microwaves, Optoelectronics and Electromagnetic Applications, Vol. 12, No. 2 December 2013 652
limiting conductivity at low frequencies, since the ionic current is forced to circumvent the cells.
However, data in Table I show that the dielectric dispersion is reduced by the process of
electroporation. Both the dielectric constant Δεr and relaxation time m decrease with increasing
intensity of the applied field. The conduction through the pores decreases ion accumulation and
consequently polarization of membranes.
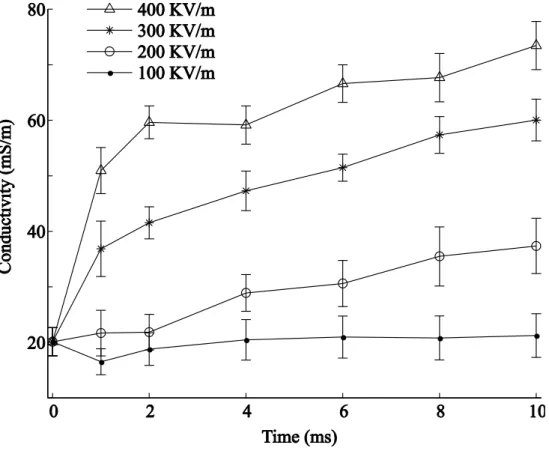
Figure 3 shows the variation of conductivity at low frequencies in relation to the applied field
strength and pulse duration. To 100 KV/m no significant increase of conductivity for any pulse
duration occurs and to 200 KV/m an almost linear increase is observed. For higher field strengths the
conductivity increases rapidly in one millisecond and after the increase occurs at a slower rate. This
is because electroporation has a fast phase of hundreds of microseconds in which the pores are created
followed by a slow phase in which the created pores increase in diameter [8], [9].
TABLE I. DISPERSION MODEL PARAMETERS BEFORE AND AFTER APPLICATION OF ELECTRIC FIELD
Parameter Electric Field (KV/m) Zero 100 200 300 400
Rct(Ω) 140 ± 50 137 144 154 160
β 0.72 ± 0.09 0.75 0.74 0.75 0.75 s(ms) 35 ± 24 34 37 39 35 s (mS/m) 25 ± 7 30 31 48 62
Δεr 143 ± 49 136 126 110 88 m (µs) 0.34 ± 0.1 0.30 0.29 0.22 0.18
ε∞ 75 ± 6 77 73 74 74
IV. DISCUSSION
Numerical simulation based on genetic algorithm presents itself as an alternative of significant
value in modeling complex systems described by mathematical models with unknown parameters. In
the case of electrical impedance of the cell suspension, it is possible to isolate and identify processes
that occur in the electrolyte, as conductivity at low frequencies and in the plasma membrane, as the
interfacial polarization. In the characterization of cell electroporation, the presented numerical
modeling allows obtaining the changes in electrical impedance parameters of the sample according to
the applied electric field and the pulse duration.
The obtained results for the behavior of the conductivity and dielectric dispersion in the
electroporation agree with models and experimental results already published [1], [8], [9]. Due to the
opening of pores when subjected to intense electric fields, cell membranes allow passage of ions
through lipid matrix. This process causes increase of suspension conductivity and reduction of
interfacial polarization, which reduces the dielectric constant of the medium.
Conductivity measurements have been used in published works as an indicator of the intensity of
the electroporation [16]-[20]. In these cases, sample conductivity was obtained through instantaneous
values of electric current and potential difference in the sample during the application of the electric
field. This method quite widespread among researchers of cell electroporation presents an important
deficiency due to the lack of any compensation procedure of the electrode polarization and dielectric
dispersion in the sample. Voltage pulses with hundreds of microseconds to milliseconds of duration
exhibit a wide spectrum of frequencies. Hence, the current flowing in the sample can be strongly
affected by the impedance of the electrode surface and dielectric dispersion due to interfacial
polarization. In addition, during the pulse application, the heat caused by power dissipation increases
additionally the electrolyte conductivity [15], [16].
The impedance measurement after the pulse and parameterization using the method presented in
this article overcome these problems, so that the obtained conductivity is the correct value for the
suspension in the intermediate frequency range of the spectrum. This value can be properly related to
electroporation according to the models already proposed in the literature [1], [8], [9]. Recently, an
alternative method for avoiding sample reactance interference in conductivity measurement during
electroporation was proposed [21]. In this work, the conductivity of yeast cell suspensions was
measured by means of a high frequency sinusoidal signal with small amplitude added to the voltage
pulse. The small signal frequency was chosen in the frequency range where the sample reactance is
very small [21].
V. CONCLUSION
The use of genetic algorithm in search of appropriate values to the parameters of the impedance
model of yeast suspensions has shown to be efficient. Programming is simple and processing is fast.
Journal of Microwaves, Optoelectronics and Electromagnetic Applications, Vol. 12, No. 2 December 2013 654
cell membrane, isolating the effects of electrode polarization and dielectric dispersion of the
suspension. It was observed that the pulse of 400 KV/m increased the conductivity between 1 and 100
KHz at least 2.5 times compared to the intact suspension. The technique of impedance measurement
after pulse application and analysis by using genetic algorithm is a powerful tool for study and
characterization of cell electroporation.
REFERENCES
[1] K. R. Foster and H. P. Schwan “Dielectric properties of tissues,” in Handbook of Biological Effects of Electromagnetic Fields, 2nd ed., C. Polk and E. Postow, CRC, New York, 1995, pp. 25-102.
[2] E. T. McAdams, A. Lackermeier, J. A. McLaughlin, D. Macken and J. Jossinet, “The linear and non-linear electrical properties of the electrode-electrolyte interface,” Biosensors and Bioelectronics, vol. 10, 1995, pp. 67-74.
[3] D. A. Coley, An Introduction to Genetic Algorithms for Scientists and Engineers, 1st ed., World Scientific Publishing, Singapore, 1999.
[4] K. Kinosita and T. Y. Tsong, “Voltage-induced conductance in human erythrocyte membranes,” Biochim. Biophys. Acta, vol. 554, pp. 479–497, Jul. 1979.
[5] D. C. Chang, “Structure and dynamics of electric field-induced membrane pores as revealed by rapid-freezing electron
microscopy,” in Guide to Electroporation and Electrofusion,D. C. Chang, B. M. Chassy, J. A. Saunders, and A. E.
Sowers, Eds. San Diego, CA: Academic, 1991, pp. 9–27.
[6] J. Teissié, M. Golzio, and M. P. Rols, “Mechanisms of cell membrane electropermeabilization: A minireview of our
present (lack of ?) knowledge,” Biochim. Biophys. Acta, vol. 1724, pp. 270–280, Aug. 2005.
[7] D. Miklavčičand M. Puc, “Electroporation,” in Wiley Encyclopedia of Biomedical Engineering. M. Akay, σew York: Wiley, 2006, pp. 1–11.
[8] C. Chen, S. W. Smye, M. P. Robinson and J. A. Evans, “Membrane electroporation theories: a review,” Medical and Biological Engineering and Computing, vol. 44, 2006, pp. 4-14.
[9] J. C. Weaver and Y. A. Chizmadzhev, “Theory of electroporation: a review,” Bioelectrochemistry, vol. 41: pp. 135-160, 1996.
[10]S. D. Reed and S. Li, “Electroporation advances in large animals,” Curr. Gene Ther, vol. 9, pp. 316–326, Aug. 2009. [11]J. Rice, C. H. τttensmeier, and F. K. Stevenson, “DσA vaccines: Precision tools for activating effective immunity
against cancer,” σat. Rev. Cancer, vol. 8, pp. 108–120, Feb. 2008.
[12]M. Pavlin, M. Kanduser, M. Rebersek, G. Pucihar, F. X. Hart, F. R. Magjarevic, and D. Miklavcic, “Effect of cell
electroporation on the conductivity of a cell suspension,” Biophys. J., vol. 88, pp. 4378–4390, Jun. 2005.
[13]V. Ganeva and B. Galutzov, “Electropulsation as an alternative method for protein extraction from yeast,” FEMS Microbiology Letters, vol. 174, pp. 279-284, 1999.
[14]V. Ganeva, B. Galutzov, σ. Eynard and J. Teissié, “Electroinduced extraction of β-galactosidase from Kluyveromyces
lactis,” Appl. Microbiol. Biotechnol., vol. 56, pp. 411–413, 2001.
[15]A. Ramos and A. L. Schneider, “Electroporation of Kluyveromyces marxianus and β-D-galactosidase extraction,” in Ganesh R. N. Applied Biological Engineering – Principles and Practice, Ed. Intech, Melbourne, 2012.
[16]M. Pavlin, M. Kanduser, M. Rebersek, G. Pucihar, F. X. Hart, R. Magjarevic and D. Miklavcic, “Effect of cell electroporation on the conductivity of a cell suspension,” Biophysical Journal, vol. 88, 2005, pp. 4378-4390.
[17]D. O. H. Suzuki, A. Ramos, M. C. M. Ribeiro, L. H. Cazarolli, F. R. M. B. Silva, L. D. Leite and J. L. B. Marques
“Theoretical and experimental analysis of electroporated membrane conductance in cell suspension,” IEEE Transactions on Biomedical Engineering, vol. 58, pp. 3310-3318, 2011.
[18]H. He, D. C. Chang, and Y. K. Lee, “σonlinear current response of micro electroporation and resealing dynamics for
human cancer cells,” Bioelectrochemistry, vol. 72, pp. 161–168, Apr. 2008.
[19]M. Khine, C. Ionescu-Zanetti, A. Blatz, L. Wang, and L. P. Lee, “Single cell electroporation arrays with real-time
monitoring and feedback control,” Lab Chip, vol. 7, pp. 457–462, Mar. 2007.
[20]A. Ivorra, B. Al-Sakere, B. Rubinsky, and L. M. Mir, “In vivo electrical conductivity measurements during and after tumor electroporation: Conductivity changes reflect the treatment outcome,” Phys. Med. Biol., vol. 54, pp. 5949–5963, Sep. 2009.