ABSTRACT: In CubeSats, because the size is limited, the estimation of the incident solar energy according to the orbital parameters and satellite attitude is more critical for the design process of the electrical power system. This estimation is helpful either for sizing of the power sources and energy storage or for deining the operation modes of the CubeSat with the energy available. This paper describes the kinematic and dynamic equations to derive the CubeSat attitude; similarly, the mathematical models of solar cells and batteries are also derived to calculate the energy harvested and stored. By determining the attitude of a 3U CubeSat over one orbit, we estimated the incident solar energy and thus the energy generated by the solar cells and energy stored in batteries when a direct energy-transfer architecture is used. In addition, these estimations where performed for three orientation scenarios: nadir-pointing, Sun-pointing and free-orientation. The estimated incident average solar energy for the three scenarios indicated that the Sun-pointing and free-orientation scenarios harvest more energy than the nadir-pointing one. This estimation is also helpful to predict the state of charge of the batteries in standby mode, allowing for determination of the time required for charging the batteries and, hence, the operating modes of the CubeSat. We expect to include the consumed energy while considering all of the operating modes of the satellite as well as different orbital parameters.
KEYWORDS: CubeSat, Electrical power system, Low Earth orbit, Satellite attitude.
Comparison of the Incident Solar Energy
and Battery Storage in a 3U CubeSat
Satellite for Different Orientation Scenarios
Sergio Sanchez-Sanjuan1, Jesus Gonzalez-Llorente1, Ronald Hurtado-Velasco1INTRODUCTION
CubeSat technology has allowed companies and universities to participate in aerospace projects at low costs (Martin et al. 2014). his participation was not possible some decades ago, when only developed countries had adequate resources to invest in the aerospace industry. Currently, with the development of science and industry, many emerging and developing countries have developed their own space programs in Asia, Africa and South America (Wood and Wigel 2014; Woellert et al. 2010). Examples of these programs are Libertad 2 mission in Colombia by Sergio Arboleda University, which carries out a system of image acquisition (Triana et al. 2015), and ALSAT-1 DMC, which performs disaster monitoring in Algeria (Kameche et al. 2014).
Similar to traditional satellites, CubeSats consist of several subsystems, such as electrical power, VHF/UHF and S-Band communications, Attitude Determination and Control Systems (ADCS), on-board computer etc.; in the same way, the set of some subsystems for a speciic function of the satellite during a period of time is called operation mode and it defines the consumption requirements. The electrical power system (EPS) provides the energy to all of the components of the satellite by means of the following stages: generation, storage and regulation. In a CubeSat, the only viable technology for energy generation is solar cells. Hence, in the design process, it is important to estimate how the incident solar radiation can provide energy for the satellite operation. In this way, it is possible to estimate the amount of energy that will be available per orbit and to design the mission accordingly. CubeSats usually describe a polar orbit, which can be divided
1.Universidad Sergio Arboleda – Escuela de Ciencias Exactas e Ingeniería – Bogotá – Colombia.
Author for correspondence: Jesus Gonzalez-Llorente | Universidad Sergio Arboleda – Escuela de Ciencias Exactas e Ingeniería | Calle 74 No. 14-14 – Bogotá Colombia | Email: [email protected]
into two periods of energy: Sun stage and eclipse stage. In the Sun stage, which corresponds to the 60% of the orbit period, the satellite receives direct solar radiation; thus, it harvests energy using the solar cells and stores the energy into the lithium-ion batteries in the CubeSat. In the eclipse-stage, the solar radiation is zero; as a result, the only available energy is the one stored in the batteries. he energy harvested by the solar cells is also related to the CubeSat attitude, which is afected by the perturbations that the satellite experiences in its orbit. hese perturbations are the gravitational gradient, atmospheric drag or even the action of the ADCS (Wertz 1990). By using mathematical models of the 3U body shape, we describe the attitude of the CubeSat according to the space conditions (Colombo et al. 1997; Sidi 2002).
According with literature, EPS mathematical model for simulation is found in Dreisbas (2013), but the author does not consider CubeSat attitude behavior. Conversely, calculations of solar power generation considering attitude and geometry , but without including EPS behavior, can be found in Lee et al. (2015). Moreover, the software that simulates attitude and EPS behavior without considering CubeSat geometry is described in Fernandez et al. (2014). So, because the amount of energy depends on the orbit characteristics, satellite attitude and geometr y, our contribution is modelling the incident radiation of a CubeSat satellite during the Sun stage for three different orientation scenarios and estimating how much energy could be harvested and stored during one orbital period. In addition, we estimate the state of charge and the voltage of the battery by considering a dual EPS in the following way: first, a direct energy transfer with four 3U solar panels and a constant current load (standby); second, direct energy transfer with two 1U solar panels and no load.
MATHEMATICAL MODELS OF THE EPS
he EPS is responsible for harvesting, storing, regulating and distributing energy; in a CubeSat, the unique source of energy is sunlight. For harvesting energy from sunlight, triple-junction solar cells are most commonly used and, for storing energy, lithium-ion batteries are employed (Bouwmeester and Guo 2010). We describe briely the mathematical models used to establish both of these EPS devices to quantify the power generated by the solar cells and the energy stored in the batteries.
GENERATION STAGE
We used the model that describes the current-voltage characteristic curve of solar cells (Eq. 1). his equation is an analytical model of the electrical behavior of a solar cell (Ortiz-Rivera and Peng 2005), which is given by:
where: Iscand Voccorrespond to the short-circuit current and the open-circuit voltage values, respectively; the term b is a characteristic constant of each solar cells.
This model allows us to obtain the I-V representation using the parameters from the solar cell datasheet and adjust it through experimental data. In addition, the voltage and current depend on the environmental conditions, such as radiation and temperature. he temperature value is considered constant (28 °C) in this simulation process. his simpliication does not afect signiicantly the quantiication; however, the variation of temperature will be considered in future study.
STORAGE STAGE
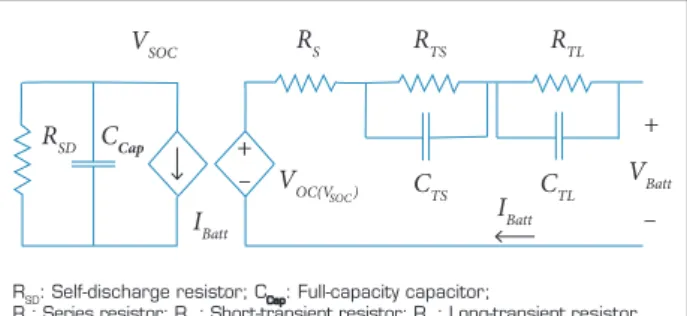
As described before, lithium-ion batteries are the storage devices in CubeSats; thus, an electrical model that characterizes the lithium-ion battery voltage is implemented. This model consists of two resistor-capacitor (RC) networks (Fig. 1) to emulate the voltage characteristic curve (Chen and Rincón-Mora 2006).
RSD: Self-discharge resistor; C : Full-capacity capacitor;
RS: Series resistor; RTS: Short-transient resistor; RTL: Long-transient resistor.
Figure 1. Electrical model of lithium-ion battery.
VSOC RS
+ –
+
–
RTS RTL
CTS CTL
VOC(V ) CCap
RSD
IBatt IBatt
VBatt SOC
he let side of the circuit models the state of charge (SOC) of the system with respect to the voltage. he SOC is represented quantitatively as a number between 0 and 1. The right side represents the transient response, with all of the passive elements from the model, which are described in Chen and Rincón-Mora (2006). By applying circuit analysis, the battery voltage (VBatt) is described by:
where: IC
TS and ICTL are the currents in the capacitors
CTSand CTL, respectively; these currents are functions of time and SOC.
EPS CONFIGURATION
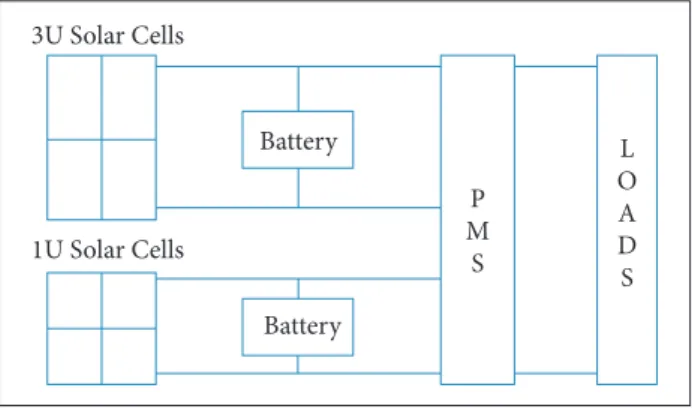
he analysis of the energy behavior considers direct energy transfer (DET) as the power system architecture, which uses a parallel connection between the solar cells and the batteries. In this case, the operating voltage of the solar cells is ixed by the battery voltage. Furthermore, the loads that deine the power consumption of the satellite also determine the battery current. Figure 2 shows a general scheme of the DET coniguration for the EPS system.
system comprises solar cells on that faces. he DET architecture is used to connect the EPS to the load to satisfy the demands of constant power consumption (Fig. 3). A net output power is produced in standby mode, generally, during which a battery can store energy.
Battery
Battery 1U Solar Cells
3U Solar Cells
L O A D S P
M S
Battery 3U Solar Cells Ipv Iload
IBatt L
O A D S
Figure 2. Electrical power supply scheme in DET coniguration
for 3U and 1U solar cells. Both architectures are connected to a power management system (PMS) to control the current distribution towards the loads.
Ater describing the system architecture, the operating condition for EPS is deined according to the faces of the CubeSat satellite. We considered two possible cases for evaluating the storage stage: a case with a constant consumption for the 3U faces and a case with no load for the 1U faces. hese situations are considered with solar cells on all of the faces of the spacecrat.
DET WITH CONSTANT CONSUMPTION FOR THE 3U FACES
Because the use of solar cells on the 3U faces (30 × 10 cm) provides the highest power for the satellite, the EPS primary
Figure 3. Scheme diagram of EPS in DET-3U topology.
Standby mode corresponds to the lowest consumption state during the satellite light. In this mode, most subsystems are disconnected. Under these circumstances, the subsystems that are considered to be on for a general CubeSat mission are presented in Table 1.
In this case, the following are active subsystems: the on-board computer (OBC), EPS and ADCS. hese subsystems represent a total consumption of 2.75 W which can change according to the orientation scenario.
For the DET architecture in the primary EPS system, with a topology for 3U faces (DET-3U), a constant consumption of energy in standby mode exists. In this mode, a current relationship is established from an electrical diagram (see Fig. 3) given by:
Subsystem Voltage
(V)
Current (A)
Power (W)
On-board computer 3.3 0.303 1.00
ADCS 5.0 0.300 1.50
EPS 3.3 0.045 0.15
Table 1. Consumption features for standby mode in CubeSat
satellite.
where: Ipvis the current delivered by the solar cells on the 3U faces; IBattis the current that lows into lithium-ion battery; and Iloadis the consumption current for standby mode. he power harvested (Ws)depends directly on the body geometry (2)
and the incident angle of the sunlight at each face. hus, for any scenario orientation, the inner power corresponds to the sum of the power provided by each face (considering the EPS topology), assuming that all 3U faces have solar cells. In this case, we have:
In the charge stage, all current provided by the solar cell is delivered to the battery. Similar to DET-3U, the initial condition is taken as a half of the total charge possible (50%) to observe the storage behavior from the EPS system for one orbital period.
where: Vpv is the voltage of the solar cells over 3U face. The energy harvested per orbit can be determined by integrating over the solar cell power curve in Eq. 4. his energy is evaluated for one orbital period (T), which is equivalent to 1.65 h. If we know the current stored or consumed from battery, IBatt, then it is possible to obtain the SOC from the device. he SOC corresponds to the integral of the battery current as a function of time with respect to the initial condition of the charge given by Eq. 5.
where: Qini is the initial charge of the battery and C is the storage capacity of the battery in Amperè-second. For all of the simulations, we considered an initial condition Qiniof 50% to obtain a better analysis over the energy behavior.
DET WITH NO LOAD FOR THE 1U FACE
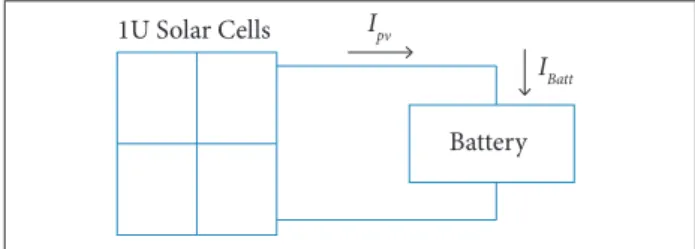
According to 3U CubeSat satellite geometry, there are two faces with 10 × 10 cm where solar cells can be allocated. To achieve a deep analysis regarding the utility of these faces of the nanosatellites, a second DET configuration is implemented which will be connected in parallel to a 3.7 V lithium-ion battery without load as an output. This configuration comprises a secondary system of energy and it will take all of the energy from the solar cells to the batteries.
For the 1U faces DET topology (DET-1U), the nonexistence of an output load for the consumption energy was determined. his situation is represented by the scheme diagram in Fig. 4, where only the parallel connection between solar cell and battery exists.
In this case, Eq. 3 can be rewritten as:
Figure 4. Scheme diagram of EPS in DET-1U topology.
1U Solar Cells
Battery
Ipv
IBatt
SPACECRAFT MODEL
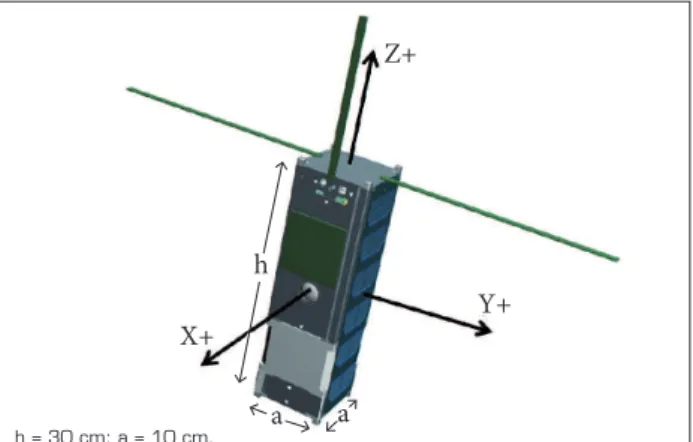
An object orbiting the Earth is submitted to different disturbances due to various physical factors, such gravity gradient, atmospheric drag, and others, which generate modiications on its attitude (Sidi 2002). To evaluate the satellite performance during power harvesting, the satellite was modeled as a rigid body (10 × 10 × 30 cm3) with a uniform mass distribution and
with its rotation axes parallel to its principal axes.
Two frames of reference were deined: Body Frame centered in the CubeSat (Γ1) where the axes are orthogonal to the satellite faces, and Inertial Frame centered in the Earth (Γ2). Both are represented with unitary vectors as follows:
To relate one frame to the other, a matrix of transformation R must by applied (Wertz 1990), such that
represents how the body frame is seen from the inertial frame. his equation and R matrix will be described in detail later.
DYNAMICS
he rotational motion about a ixed point could be described by a set of equations known as Euler’s equations of motion (4)
(5)
(7)
(8)
I
Battini
(Goldstein 1964), which describe the angular momentum conservation, h = [hx hy hz]T , for a rigid body.
where: Ω(ω) is the angular speed antisymmetric matrix that contains the angular speed of each axis.
Only the torque τ = [τx τy τz]T can change the angular
momentum magnitude, which can be external or internal. he term ω × honly generates a change in the angular momentum direction. Equation 9 can be rewritten as:
where I is the satellite moment of inertia tensor (3 × 3):
and ωis the vector of angular velocities (3 × 1). he terms τint and τext include the internal and all of the external torque that can modify the body’s attitude (3 × 1), respectively (Wertz 1990). he factor ω × in Eq. 10 is a skew matrix that relates all angular speeds in attitude:
When the matrices from Euler’s equation are operated upon, we obtain the inal Eq. 13 to each axis from the body frame.
Figure 5 shows the axial assignment for the body frame that was used.
KINEMATICS
he satellite kinematics is represented using a quaternion q. The quaternion representation avoids singularities and trigonometric functions (Sidi 2002; Yang 2012), which is an important consideration in an embedded system.
Figure 5. Axial assignment for body frame reference.
h
a a X+
Y+ Z+
Likewise, q is the quaternion vector, which is represented by four elements:
A review of the quaternion in spacecraft attitude was presented by Yang (2012). To visualize how the incident radiation hits the CubeSat faces, the quaternions are converted to Euler Angles. he transformation equations are:
he angles θ, ϕ and ψ are yaw, pitch and roll, respectively. hese angles establish the angular location of the body frame axes according to the input torques in the simulation. (9)
(10)
(14)
(16) (15) (11)
(12)
(17)
(18)
(19) (13)
→
→
→
→
→
→ →
→ →
→
h = 30 cm; a = 10 cm.
METHODOLOGY
his section describes the models used, the perturbations, the orbit features, how the Sun vector is derived and the scenarios chosen for the simulations.
MODEL DIAGRAM
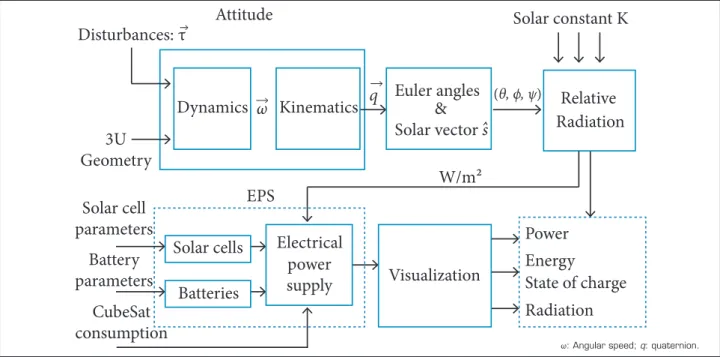
Figure 6 shows the block diagram that describes the system simulated for capturing radiation in each scenario. Using the mathematical models for spacecrat attitude, we calculated the relative radiation for each CubeSat side. his relative radiation value is an input variable for the EPS subsystem, along with the speciication of the EPS devices from the manufacturer datasheet. he last stage corresponds to visualization of the main variables for energy analysis.
INITIAL PERTURBATIONS
In the case of the CubeSat geometry, the gravity gradient produces a force over a mass element (dm) located at a distance r from the center of mass given by:
Figure 6. Block diagram of the proposed simulation.
Attitude
Disturbances:
τ
3U
Geometry
Dynamics
Kinematics
Euler angles
Relative
Solar vector
s
ω
q
(θ, ϕ, ψ)ˆ
&
Radiation
Energy
State of charge
Radiation
Power
Visualization
Electrical
Solar constant K
Solar cells
Batteries
power
supply
Battery
parameters
Solar cell
parameters
CubeSat
consumption
EPS
W/m²
ω: Angular speed; q: quaternion.
(μ = 3.986 × 10⁵ km3/s2).
he gravitational torque over this dm is: dG = d × dF . hus, the gravitational torque over the body is (Sidi 2002):
→ → →
→
(20)
(21)
where: r is the distance from the center of the Earth to the body’s center of mass; μis a gravitational constant for the Earth
where: R is the distance from the center of Earth to the center of mass of the satellite; dis the radius vector from the body center of mass to a mass element dm; M is the entire body mass.
Furthermore, we applied an initial torque τ0 = [τ0x τ0y τ0z] that corresponds to the irst impulse on the satellite when it is ejected from the Poly Picosatellite Orbital Deployer (P-POD); this torque has an order of magnitude of 10−6Nm.
ORBIT FEATURES
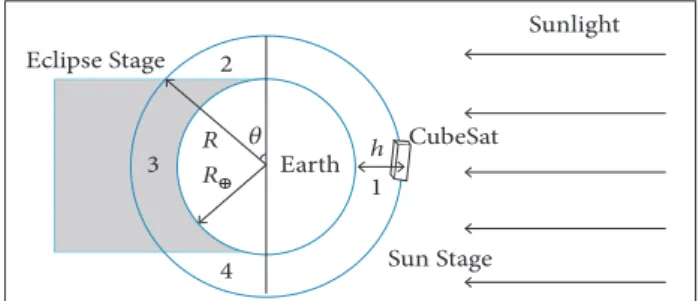
he simulated orbit is a Keplerian polar solar-synchronous orbit with a height of 700 km. he satellite trajectory has two stages. One stage is the radiation stage or the sunlight period, during which radiation reaches the object with the possibility of generating and storing energy. he other stage is the eclipse stage, known as the dark period or the eclipse period, during which it hides in Earth’s shadow and thus it is not exposed to solar radiation; in this case, we consider a constant eclipse stage. Both periods are shown in Fig. 7.
which every region is marked as shown in Fig. 7. According to Kepler’s Third Law, we calculate the orbital period as follows:
Sunlight
CubeSat
Sun Stage Eclipse Stage
Earth
R 1
4 3
2
h R θ
Figure 7. Graphic description for polar solar-synchronous
orbit in CubeSat satellite.
DERIVATION OF THE SOLAR VECTOR
We must calculate the incident radiation on each side of the satellite. As a result, all axes on the body frame must be related with one ixed unitary vector that is pointing towards the Sun. As depicted in Fig. 8, this unitary vector is called the solar vectorand is denoted by s.
According to the last section, if we assume that the inertial frame is ixed with the x axis pointing towards the Sun, then the solar vector is parallel to the i vector. Furthermore, assuming that any change of attitude from the satellite is reached with rotation order Xθ Yϕ Zψ the rotation matrix used is Eq. 23. (22)
According to these calculations, we determine that the orbital period is T = 99.1 min. Because region 1 describes a half orbit, the CubeSat displacement is performed in 49.5 min.
Applying some angular analysis for regions 2 and 4, we determine that the radiation stage has a duration of 62.73 min and the eclipse stage has a duration of 36.27 min, i.e. the radiation and eclipse stages correspond to 63.36 and 36.64 %, respectively, of the orbital period in low Earth orbit.
Note that the above discussion ignores albedo radiation. his simpliication allows us to perform a better analysis of the energy behavior by using only direct radiation in each scenario; however, albedo will be considered in a future study.
^
Solar Radiation
Sun
Earth Cube Sat
Y Z
X Ŝ
Figure 8. Solar vector representation.
^
(23)
where: s and c mean sine and cosine, respectively.
To compare each axis from body frame with the solar vector, we deine the angle ψ between both vectors as:
→
(24)
where: υ is any new unitary vector from the body frame seen in the inertial frame. Because the solar vector and x axis are parallel, s^ has the value:
(25)
Because both vectors in Eq. 24 are unitary, we have ||υ|| = ||→ s^|| = 1. hus, the angular separation is:
(26)
For three positive axes represented by coordinate transformation, the incident angles between the solar vector and each unitary vector of the body frame are:
(27)
(28)
(29)
ORIENTATION SCENARIOS
Parameter 1U value 3U value Units
Open-circuit voltage 5.334 16.00 V Short-circuit current 0.506 0.506 A
Eiciency 28 28 %
Parameter Value Units
Nominal voltage 3.7 V
Capacity 1,000 mAh
Table 2. High-eficiency triple-junction solar cell parameters
from Azur Space.
Table 3. Generic lithium-ion battery.
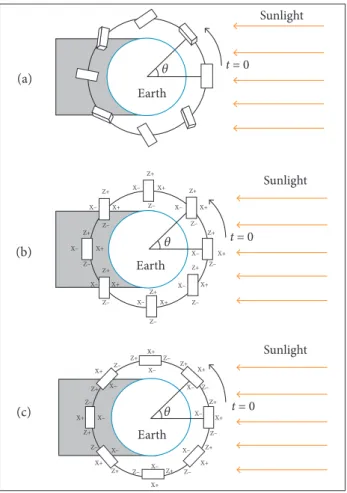
the satellite makes arbitrary rotations due to the efect of the gravitational gradient and assuming the absence of any attitude control system. his scenario allows all satellite faces to receive radiation. his scenario can be the reference case to perform an energy analysis with respect to the other scenarios.
he second scenario is called Sun-pointing, as shown in Fig. 9b. With an attitude control system assumed, the body reference frame is invariant with respect to the Earth’s reference frame. his scenario has as the initial condition the quaternion qi= [1 0 0 0]. hus, only one 3U face labeled as X+ is receiving sunlight with maximum radiation during the entire simulation, whereas the other faces are not receiving sunlight.
The last scenario is called nadir-pointing, which is described in Fig. 9c. Nadir-pointing represents a case where X− face is always pointing to the center of the Earth. This scenario allows for the four faces exposed to sunlight to exhibit a sinusoidal behavior of radiation. In t = 0 with initial condition qi , the radiation in X+ has a maximum value, which will be reduced in function of the angular separation θfrom
the i vector. A position change increases the relative radiation over Z− toward its maximum in 90°. At this moment, X− face will receive radiation over a short time before and ater the eclipse stage. As a result, ater the non-radiation region, Z− face will receive sunlight during the rest of the orbit trajectory, and X+ returns to its initial position.
In all cases, we estimate the quantity of energy harvested during the sunlight period by monitoring the state of charge from the battery model. Additionally, both the body frame and the inertial frame will be aligned for time t = 0 with initial condition qi , i.e. just one face of the CubeSat receives the maximum radiation in the irst instant, and the other faces do not.
SIMULATION RESULTS
By using the mathematical models and the orbital environments described before, we estimate the incident solar energy according to the CubeSat attitude to quantify the power generated by the solar cells. he parameters of these cells are listed in Table 2, which presents the electrical values of a triple-junction solar cell, manufactured by the Azur Space Company (Azur Space 2009). In addition, we quantify the current that is absorbed or provided by the battery according with the loads. he parameters of a generic lithium-ion battery that were used for the estimation are listed in Table 3. All of the quantiications were performed for the three orientation scenarios previously described: free, solar ix and nadir orientation.
Sunlight Sunlight Sunlight Earth Earth Earth
t = 0
θ
t = 0
Z– Z– Z– Z– Z– Z– Z– Z– Z– Z– Z– Z– Z– Z– Z– Z+ Z+ Z+ Z+ Z+ Z+ Z+ Z+ Z+ Z+ Z+ Z+ Z+ Z+ Z+ Z+ Z– X+ X+ X+ X+ X+ X+ X+ X+ X+ X+ X+ X+ X+ X+ X+ X+ X– X– X– X– X– X– X– X– X– X– X– X– X– X– X– X–
t = 0
θ θ
Figure 9. Orientation scenarios. (a) Free-orientation scenario;
(b) Sun-pointing scenario; (c) Nadir-pointing scenario.
(a)
(b)
(c)
^
COMPARISON OF THE INCIDENT SOLAR ENERGY FOR THE THREE ORIENTATION SCENARIOS
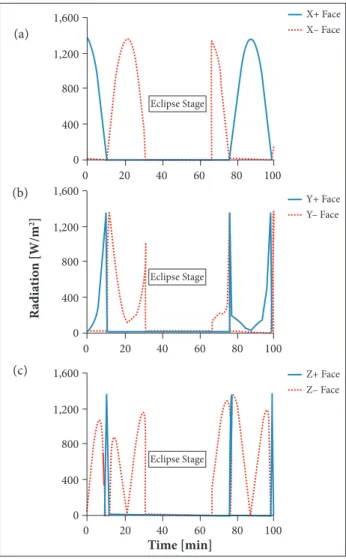
In Fig. 10a, the change in radiation magnitude is shown for the opposite faces (X+, X−). According to the radiation behavior, when one face receives energy, the opposite face does not. he same situation occurs for the remaining faces (Y+, Y− and Z+, Z−), as shown in Figs. 10b and 10c.
Concerning the other scenarios, in the Sun-pointing scenario, only one 3U face receives sunlight, which absorbs the maximum radiation (1,363 W/m2) during the entire sunlight stage and
no radiation during the eclipse stage (Fig. 11). In the last scenario, nadir-pointing, four faces of the CubeSat are illuminated by solar radiation with a sinusoidal behavior, as shown in Fig. 12.
Using the solar radiation on the CubeSat faces, we calculated the orbit average energy for each scenario; likewise, we also calculated the orbit average power. hese calculations, presented in Table 4, can be used to compare the solar energy harvested in the three scenarios. hese results indicate that both the free-orientation
and the Sun-pointing scenarios are the most advantageous solutions with ~ 8.0 Wh of energy per orbit, whereas the nadir-pointing scenario was the worst case, with ~ 5 Wh of energy generated from the solar cells.
Note that the irst scenario generates power from all six faces in diferent orientations. Hence, it is possible to collect the energy from three faces at the same time and increase the energy generated. However, the satellite can harvest enough energy if just one 3U face is illuminated by sunlight during the sunlight stage (Sun-pointing), by which it reaches almost the same energy as the free-orientation scenario. In the last scenario, incident solar radiation is illuminating the four faces in diferent time intervals. Two of these intervals are on the 1U face, which causes reduced collection of energy with respect to the other
Figure 10. Radiation in free-orientation for: (a) X+ and X− faces;
(b) Y+ and Y− faces; (c) Z+ and Z− faces.
0 400 800 1,200 1,600
R
adi
at
io
n [W/m
2]
Eclipse Stage
X+ Face X– Face
Y+ Face Y– Face
Z+ Face Z– Face
0 400 800 1,200 1,600
Eclipse Stage
0 400 800 1,200 1,600
Eclipse Stage
0
Time [min]
20 40 60 80 100
0 20 40 60 80 100
0 20 40 60 80 100
(a)
(b)
(c)
Figure 11. Radiation harvested from Sun-pointing scenario.
0 0 400 800 1,200 1,600
Time [min]
R
adi
at
io
n [W/m
2]
20 40 60
Eclipse Stage
X+ Face
80 100
0 0 400 800 1,200 1,600
Time [min]
R
adi
at
io
n [W/m
2]
20 40 60
Eclipse Stage
X+ Face X– Face Z+ Face Z– Face
80 100
Figure 12. Radiation harvested from nadir-pointing scenario.
Scenario 1U
faces
3U faces
Energy (Wh)
Power (W)
Free
orientation Z+, Z−
X+, X−,
Y+, Y− 7.91 4.79
Solar ix — X+ 7.98 4.83
Nadir
orientation Z+, Z− X+, X− 5.84 3.54
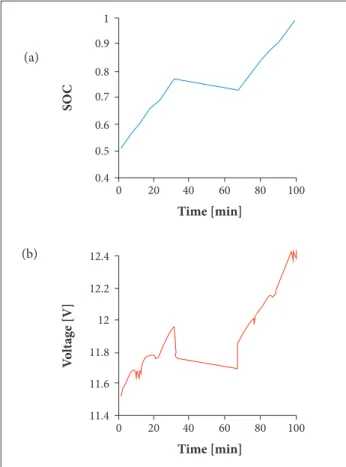
Figure 13. State of charge and voltage behavior for lithium-ion battery in free-orientation scenario.
Time [min]
0 11.4 11.6 11.8 12 12.2 12.4
20 40 60 80 100
V
o
ltage [V
]
Time [min]
0 0.4 0.5 0.6 0.7 0.8 0.9 1
20 40 60 80 100
SO
C
(a) scenarios. herefore, it is important to have as many 3U faces as
possible receiving solar radiation by avoiding the stages where the energy produced depends on the 1U faces.
ESTIMATION OF THE BATTERY STATE OF CHARGE USING THE DET ARCHITECTURE
To examine the energy storage according to the EPS architectures, the SOC behavior is shown for the DET architecture in two cases considered: irst, six solar cells on a 3U face in parallel with three batteries (DET-3U) and second, two solar cells on a 1U face in parallel with one battery (DET-1U). In the DET-3U case, a constant current load corresponding to standby mode is studied as this is the best mode for battery charging, whereas, in the DET-1U case, no load is considered because this architecture is designed as a secondary or backup topology, as shown in Fig. 2, that would only deliver energy stored during an emergency mode which is not simulated. In the former case, the load is equivalent to the standby energy consumption; therefore, the number of orbits to complete full charge of battery can be determined when the studied CubeSat operates in low power mode. In the same way, the DET-1U case corresponds to the time required to charge completely one battery, which can be used as the backup system. he battery SOC and voltage are estimated for the three orientation scenarios studied with an initial charge of 50%. his initial condition is considered to observe either its increase or decrease for better visualization at the beginning of the simulation; furthermore, many storage tests indicated that the battery should be kept with depth of discharge of 50% for better capacity performance (McLaren et al. 2008).
For the DET-3U case in the free-orientation scenario, the SOC reached 99% ater one orbital period (99.1 min) – Fig. 13a, i.e. almost the full-charge state is achieved in one orbit around the Earth. Moreover, during the entire orbital period, the battery is always in a charged stage, except during a short period that corresponds to the eclipse stage, where the satellite passes through Earth’s shadow. This result indicates that the free-orientation scenario can provide advantage of energy saving ater the high consumption periods due to the operation of other subsystems such as VHF/UHF communication, S-Band communication and payload, which have high energy consumption that decreases the energy stored; so the free orientation recovers the SOC in the battery in a few orbits during standby mode. In addition, the battery voltage does not exhibit a signiicant variation, ranging between 11.6 and
12.4 V, which is near the maximum power point of the solar cell (Fig. 13b).
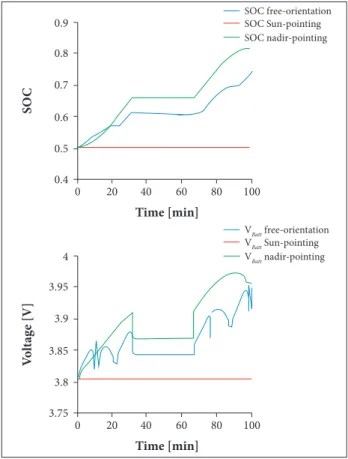
For scenarios in Sun-pointing and nadir-pointing orientations, unlike free-orientation, there is a higher consumption in the standby mode due to ADCS operation. In Fig. 14a, it is observed that Sun-pointing orientation (red line) can retrieve 14% of the energy ater one orbital period requiring around three and a half orbits for total charging. However, nadir-pointing scenario (green line) shows a disadvantage in the process of energy storing; in one orbital period, the SOC decreases 5% with respect to the initial condition because of the low incidence of radiation over the 3U sides; hence the battery will be discharged ater around ten orbits. he same behavior can be seen in Fig. 14b; voltage level increases in Sun-pointing while it decreases in nadir-pointing, which is consistent with SOC results.
In the DET-1U case, two 1U faces are available to store the energy harvested into the lithium-ion battery. For each scenario, the SOC behavior and the voltage variation are shown in Fig. 15. According to these results, the nadir-pointing
Figure 14. State of charge and voltage behavior for lithium-ion battery in Sun-pointing (red line) and nadir-pointing (green line) orientations.
VBatt Sun-pointing VBatt nadir-pointing SOC Sun-pointing SOC nadir-pointing
Time [min]
0 11.2 11.3 11.4 11.5 11.6 11.7 11.8
20 40 60 80 100
V
o
ltage [V
]
Time [min]
0 0.3 0.4 0.5 0.6 0.7 0.8
20 40 60 80 100
SO
C
VBatt free-orientation VBatt Sun-pointing VBatt nadir-pointing SOC free-orientation SOC Sun-pointing SOC nadir-pointing
Time [min] 0
3.75 3.8 3.85 3.9 3.95 4
20 40 60 80 100
V
o
ltage [V
]
Time [min] 0
0.4 0.5 0.6 0.7 0.8 0.9
20 40 60 80 100
SO
C
Figure 15. Comparison of state of charge behavior and
voltage curves for three scenarios in DET-1U topology.
scenario achieves the best storage condition, with a SOC increase of approximately 30%, followed by free-orientation scenario, with a SOC increase of almost 25%. In these circumstances, the worst scenario is the Sun-pointing because the secondary 1U faces do not receive incident solar energy; the 1U vector normal to the faces is perpendicular to the solar vector.
In general, all results for DET-3U and DET-1U indicate that the satellite orientation has a direct influence in the SOC due to the number of sides exposed to radiation and the ADCS consumption. For example, in the free orientation, several 3U faces are probably receiving solar radiation and the ADCS is not required; thus the CubeSat will operate in a low consumption state. Meanwhile, in scenarios with ADCS, there are only few faces exposed to solar radiation. Sun-pointing can generate enough energy in DET-3U but none in DET-1U, making the backup topology useless. Conversely, nadir-pointing has a bad harvesting in DET-3U, but an excellent performance for DET-1U.
CONCLUSIONS
his paper described the approach used to estimate the behavior of the incident solar radiation in a 3U CubeSat using dynamic and kinematic equations to determine its attitude with respect to the solar vector. In addition, we calculated the energy harvested by the solar cells and the energy stored in lithium-ion batteries when the CubeSat operates in standby mode. Under these conditions, we considered a low Earth orbit and three orientation scenarios: nadir-pointing, Sun-pointing and free-orientation.
For each orientation scenario, we could estimate the incident solar radiation as a function of time, the orbit average power and the orbit average energy. According to these results, more radiation can be harvested by the solar cells in the free-orientation and Sun-pointing scenarios; however, the free-orientation scenario depends on the initial torque. The nadir-pointing scenario was the worst case because the incident solar radiation reaches only one 1U side during some periods.
(a)
In the DET-3U topology with constant consumption, the free-orientation scenario saves 49% more energy ater one orbital period than the initial charge in standby mode without attitude control. he other two scenarios with attitude control in low power have a higher consumption and lower storage rate: the Sun-pointing scenario can store 14% more energy, whereas the nadir-pointing has a decrease of 5% in the stored energy, being the worst. For the DET-1U topology, the nadir-pointing has the highest energy storage, with a SOC of more than 30%, followed
by the free-orientation scenario, with a SOC of almost 25%. For both scenarios, the storage occurs in one orbital period.
he Sun-pointing scenario cannot store energy because none of the 1U faces receive solar radiation.
In future research, we will expand our study to consider other orbital scenarios and other CubeSat orientations. In addition, the energy consumption over one operation sequence of the satellite will be considered to analyze the battery behavior and to evaluate the EPS design.
REFERENCES
Azur Space (2009) 28% triple junction gas solar cell speciications; [accessed 2014 Dec 18]. http://azurspace.de/index.php?mm=162
Bouwmeester J, Guo J (2010) Survey of worldwide pico- and nanosatellite missions distributions and subsystem technology. Acta Astronaut 67 (7-8): 854-862. doi: 10.1016/j.actaastro.2010.06.004
Chen M, Rincón-Mora G (2006) Accurate electrical battery model capable of predicting runtime and I-V performance. IEEE Trans Energ Convers 21(2): 504-511. doi: 10.1109/TEC.2006.874229
Colombo G, Grasselli A, De Luca A (1997) Satellite power system simulation. Acta Astronaut 40 (1):41-49. doi: 10.1016/S0094-5765(97)00022-2
Dreisbas R (2013) CubeSat electrical power system simulation a generic approach. Saarbrücken: AV Akademikerverlag.
Fernandez A, Accolti GD, Buergler B, Garcia B (2014) PEPS: a tool for power system simulation. Proceedings of the European Space Power Conference (ESPC); Noordwijkerhout, The Netherlands.
Goldstein H (1964) Classical mechanics. Reading: Addison-Wesley.
Kameche M, Benzeniar H, Benbouzid A, Amri R, Bouanani N (2014) Disaster monitoring constellation using nanosatellites. J Aerosp Technol Manag 6(1):93-100. doi: 10.5028/jatm.v6i1.281
Lee DY, Cutler J, Mancewicz J, Ridley AJ (2015) Maximizing photovoltaic power generation of a space-dart conigured satellite. Acta Astronaut 111283-299. doi: 10.1016/j.actaastro.2015.01.022
Martin L, Jones W, Shiroma W (2014) Small-satellite projects offer big rewards. IEEE Potentials 33 (4):24-30. doi: 10.1109/MPOT.2014.2315858
McLaren V, Clark C, Simon E, Hendel B (2008) Lithium ion polymer cell for small satellites. Proceedings of the NASA Battery Workshop; Huntsville, USA.
Ortiz-Rivera E, Peng F (2005) Analytical model for a photovoltaic module using the electrical characteristics provided by the manufacturer data sheet. Proceedings of the 36th IEEE Power Electronics Specialists Conference; Recife, Brazil.
Sidi M (2002) Spacecraft dynamics and control: a practical engineering approach. Cambridge: Cambridge University Press.
Triana J, Bautista S, González F (2015) Identiication of design considerations for small satellite remote sensing systems in low earth orbit. J Aerosp Technol Manag 7 (1):121-134. doi: 10.5028/jatm. v7i1.405
Wertz J (1990) Spacecraft attitude determination and control. Dordrecht: Kluwer Academic Publishers.
Woellert K, Ehrenfreund P, Ricco A, Hertzfeld H (2010) Cubesats: cost-effective science and technology platforms for emerging and developing nations. Adv Space Res 47(4):663-684. doi: 10.1016/ j.asr.2010.10.009
Wood D, Wigel A (2014) Architectures of small satellite programs in developing countries. Acta Astronaut 97:109-121. doi: 10.1016/ j.actaastro.2013.12.015