Abstract—This paper presents an experimental comparative
study of iron losses obtained by means of the Epstein frame, Ring Core and dynamometer tests with non-oriented electrical steel samples. The comparisons are qualitative and they are intended to show the importance of carrying out other tests to evaluate electrical steels in addition to the standard Epstein frame method. In industry, complex or costly tests are avoided, whenever it is possible. This study shows that the ring core test can be a low cost solution since it is effective. For the manufacturer point of view, comparing different commercial steels at purchase time with a simple process is an advantage.
Index Terms— Non-oriented electrical steel, iron losses, iron losses measurement, Epstein frame test, ring core test, dynamometer test.
I. INTRODUCTION
The growing demand for electricity, the need of investments, environment issues and lower costs
production in the competitive market are factors that increase the concern of electric machine
manufacturers with their products performance. One of major concerns related to the efficiency of
devices is the losses in electric and magnetic components. Electrical steel sheets are widely used in
electrical machine industry. The iron losses in the core and the magnetic permeability are relevant
aspects in the design and optimization process and, therefore, for consumer acceptance in terms of
electrical motor efficiency. Companies are investing in specialized departments to carry out tests to
characterize or measure the electrical steel quality related to the appearance of new materials and the
development of new production processes. Such departments play a relevant role as they supply
valuable data for companies guiding price negotiations, parameters for future projects and quality
control data of ferromagnetic materials. There are several types of ferromagnetic materials. In this
work, we consider three semi-processed non-oriented silicon steels, having low iron losses and used
in rotational electrical machines. The materials investigated come from three different commercial
suppliers. In this context, this paper presents a comparison between three experimental approaches for
evaluating three steel suppliers. The materials under consideration have equivalent characteristics
Testing Strategies to Evaluate Non-Oriented
Electrical Steels Losses
J. P. Schlegel, N. J. Batistela, N. Sadowski, P. Kuo-Peng, J.P.A Bastos, M. Rigoni
Universidade Federal de Santa Catarina, Departamento de Engenharia Elétrica, Grupo de Concepção e Análise de Dispositivos Eletromagnéticos, Florianópolis, Santa Catarina, Brazil.
[email protected], [email protected],[email protected], [email protected],[email protected]
A. A. de Espíndola
EMBRACO, Rui Barbosa, 1020, Joinville, SC, BRAZIL. [email protected]
L.V.Dokonal
quantitative comparison quite hard. On the other hand, the Epstein frame test is the most used and
accepted in the electric steel characterization because low complexity, high reproducibility and own
specific standards [3][4]. As is well known [3][5], for several reasons, the Epstein test does not
provide the iron losses in a machine with accuracy. Indeed, both ring core tester and Epstein frame
simulate different conditions compared to the actual motor, especially considering manufacturing
phenomena (cutting, degradation of cutting even after the annealing, heat treatment no homogeneous,
interlaminar losses etc.) as well as mechanical stress and other types of magnetic behaviors as iron
rotational losses. Therefore, under manufacturer the point of view, the paper is intended to provide
elements allowing the appropriate choice of electrical steel. To do so, the paper proposes a simpler
comparative method rather than complicated and most common tests. The Epstein frame is a precise
tool to measure iron losses and it is widely employed nowadays to guide the material choice and price
negotiation. However, when considering the assembled machine, the proposed method is a better way
to choose the electrical steel. We would like to remark that this paper is not intended to provide
absolute losses values but its goal is to propose a more practical and effective comparison of
commercial steels.
The reference [4] presents studies about Epstein frame test, Single Sheet Test (SST) and Ring Core
test, as well as a comparison among them. The reference [4] also shows an indirect comparison
between the SST and Epstein frame measurements. Here, in this study we do not consider SST
because its results obtained are very close to measured results with the Epstein frame.
The main factor motivating this work is that, in some cases, results from Epstein test and the final
motor efficiency are not coherent, i.e., the best steel choice based on Epstein test does not necessarily
result in the best motor efficiency. In this paper, we experimentally investigate this fact.
II. MEASURING SYSTENS AND SAMPLES
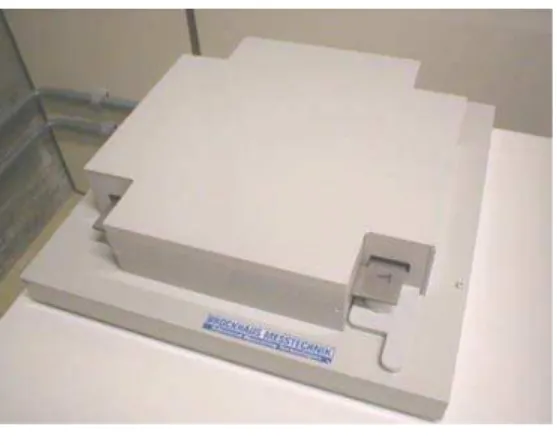
The first two tests are performed on a measuring system manufactured by Brockhauss Messtechnik,
model MPG100D [6]. This system imposes a sinusoidal waveform for the magnetic flux in the
samples through a closed loop control. Three materials from different manufacturers are tested with
the two following procedures: Epstein frame and Ring Core test. The samples used in tests are
steels are commercially classified as 50A470 (with 2% Si) according to JIS Standard [7]. Part of the
material was punched on 25 cm standard Epstein strips and the remaining materials were assembled
as stator lamination stack with approximately 50 mm of stack height (Fig. 2). The samples were
carefully handled and stored to avoid problems such as physical deformation, corrosion and aging.
A. Epstein frame test
The well known Epstein frame is a two windings transformer. The primary Np turns winding
generates the magnetic field H(t) by the excitation current ip(t). The standard magnetic length lm is
equal to 0.94 m. The standard path length assumption is an error source for obtaining the magnetic
field strength [8][9]. Defining the path length absolute value is a complex task [3] and it is not a goal
in this paper. As already mentioned in [3], the effective path lengths ranges between 0.88 m and 1.06
m, mainly depending on the permeability of the steel. Besides, determining the whole sample mass to
obtain watts/kg has inaccuracies due to the magnetic path variation. The secondary Ns turns winding is
used for the flux measurement and to control the waveform of the induced voltage vs(t). The flux
density B(t) is calculated by (1) where S is the effective magnetic section. The magnetic field H(t) is
given by (2). There is also a winding set to compensate the leakage flux. The magnetic core of the
Epstein frame is formed by the electrical steelstrips in four arms, forming a closed magnetic circuit.
According to standards, half of the test sheets must be cut on the rolling direction (lengthwise) and the
other half in perpendicular direction to the rolling direction. Figure 1 shows the used Epstein frame.
1
( )
s( )
[T]
s T
B t
v t dt
N S
=
∫
(1)( )
p p( ) [A/m]
m
N
H t
i t
l
=
(2)The three silicon steels (here called M1, M2 and M3) from different manufacturers are tested in the
Epstein frame. Table I shows some characteristics of each material (all samples have 0.50 mm
thickness). The material M3 was evaluated on two configurations: a) half of the strips were cut on the
rolling direction (L) and the other half on the perpendicular direction (C), as determined by the
standards - this set is called M3a, and b) half of the strips were cut on the rolling direction (L) and the
other half in a diagonal direction (D) - this set of samples is here called M3b. Similar experimental
Fig. 1. Epstein frame.
TABLE I. MATERIALS USED IN EPSTEIN FRAME TESTS
Material Cut Direction No of strips Losses (W/kg) 1.5T – 60Hz
M1 50%L – 50%C 16 3.61
M2 50%L - 50%C 20 3.44
M3a 50%L - 50%C 20 4.12
M3b 50%L - 50%D 20 4.13
Two types of tests are performed. In the first one, the frequency is set at 60 Hz and the flux density
varies from 0.1 T to 1.8 T, with increments of 0.1 T. In the second one, the flux density is set at 1.4 T
and the frequency varies from 25 Hz to 300 Hz.
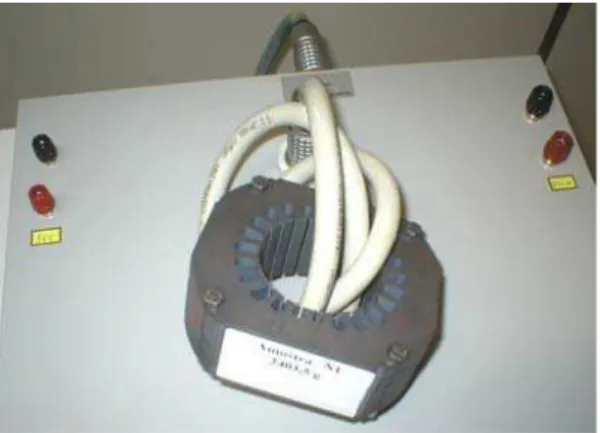
B. Ring core test
The ring core method is used to test ring stack samples and it has the same principles of the Epstein
test. The samples are involved by a cable containing the primary and secondary coils, as shown in Fig.
2. This test is not standardized and does not have compensation coils, which can be a source of
measurement errors. The flux density is tangential to the magnetic length of the sample. In the case of
stator lamination stack samples, as used in this work, there is no flux in the teeth. Thus, there are
uncertainties related to the amount of material for the iron losses calculation. Moreover, the
distribution of flux density is not homogenous in the stator back iron (the variation of the average
magnetic path depends on the levels of induction). In this work it is assumed that this kind of error
and uncertainties are similar for all samples. This is reasonable since the interest here is not obtaining
the iron losses absolute values but furnishing a qualitative material comparison technique. For the
motor manufacture point of view, it is often easier to punch motor lamination than real rings to carry
out magnetic tests. Moreover, electric motors can be assembled with the lamination packs to test the
motor efficiency in a dynamometer bench.
Table II shows the stator core weights and stack height average values obtained from a set of ten
stators samples. The weight and volume of steel teeth are neglected in the calculation of core loss. The
lamination stator stacks are punched and assembled in the production line. We keep this configuration
since we are interested in the analyses of actual motor and impossibilities of changing the core
Fig. 2 Lamination stator stack under test on ring core test.
TABLE II.MATERIAL USED IN THE RING CORE TESTS
Material Weight [kg] Stack height [mm]
M1 2.727 49.0
M2 2.722 49.1
M3 2.714 48.9
The lamination stacks are also evaluated in two ways. In one hand, the frequency is 60 Hz and the
flux density varies from 0.1 T to 1.1 T, with increments of 0.1 T. In the other situation, the flux
density is set at 0.8 T and the frequency varies from 25 Hz to 300 Hz.
C. Dynamometer test
Tests are also performed in the dynamometer with motors produced with the three studied steels.
The stators are produced with the same stacks of steel laminations used in ring core tester. These
stacks are isolated and assembled in the same way, using the same winding machine. It can be
assumed that the only difference between the stators is the steel used in the assembly of the stacks.
Thus, there are three types of stators produced with the materials M1, M2 and M3. Each stator type is
composed by three samples for each type of material. For dynamometer tests it is used only one
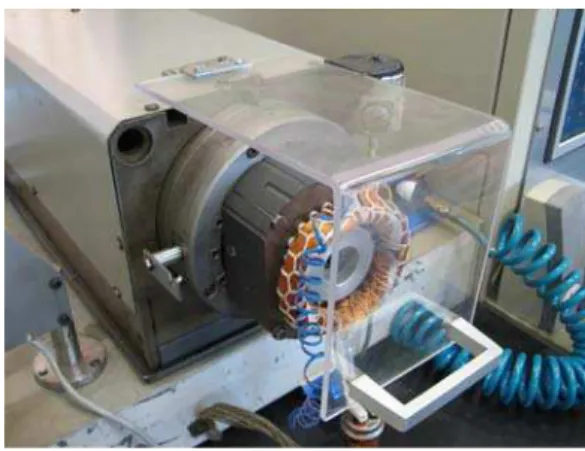
standard rotor made from the material M2 (reference material of this work). Figures 3 and 4 show the
dynamometer used in the tests.
Fig. 4. Detail of the stator being tested.
The dynamometer has a DC motor as a load and imposes the rotation to the system. It is possible to
measure the characteristics of the motor at any specific point of torque or rotation. The torque is
measured with a HBM load cell and the rotation is evaluated by a Hornet encoder. With the torque
and rotation values it is possible to calculate the mechanical power. The electrical power is obtained
with a Yokogawa wattmeter that measures the motor voltage and current. Figure 5 shows the
dynamometer diagram.
Fig. 5. Dynamometer system used in tests.
An important characteristic of the used system is the absence of motor bearings. The stator support
is hydrostatic, allowing relatively low and stable losses. The rotor is coupled to the dynamometer axis
and, during the tests, only the stators are replaced.
III. MAGNETIC IRON LOSSES
When a transformer operates at no load, the power consumption corresponds to the core iron losses
and the winding resistance losses. The iron losses can be determined by means of the primary current
and the secondary induced voltage or by the magnetic quantities from (1) and (2). Then, the resistance
losses of the primary winding are not included. The core loss depends on several factors and
magnetization phenomena, as the test conditions, the physical characteristics of the samples, the
frequency of the magnetic flux and local flux density behavior [3]. For strip samples used on the
electrical steels. For stator stack samples, possible factors influencing additional losses are the
mechanical deformation effect caused by screws and the insulation failures, for instance [3][10]. In
spite of it, iron losses are commonly divided in eddy currents, hysteresis and excess eddy current
losses. This paper is not related to losses separation. The main goal here is to present the comparison
between results from three methods intended to evaluate the total iron losses. A comparison between the
Epstein with simple rings (not stators) testers as performed in [4]. Comparisons of cores with the directions
punching for using of different ways of stacking should be carried on to obtain a better investigation
about the losses environment. But the stators are stamped in a defined pattern and it is not possible to
stop the production line in order to vary the punching directions for different ways of stacking.
IV. RESULTS
The measurement results are firstly shown for the Epstein frame standard test and then for the ring
core method test. The dynamometer test does not furnish the iron losses but the final performance of
each assembled motor. Moreover, the winding geometry and their position may modify the losses in
the motor. The induction values in motor back-yokes differ from the other two test types. This data
can be qualitatively compared with the results of the previous tests.
A. Epstein frame test
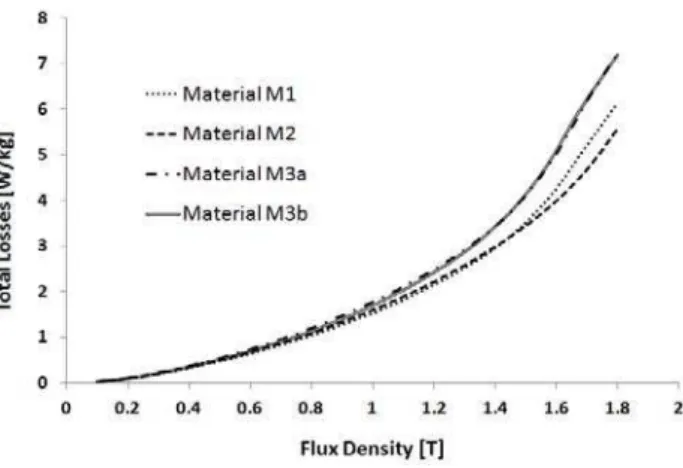
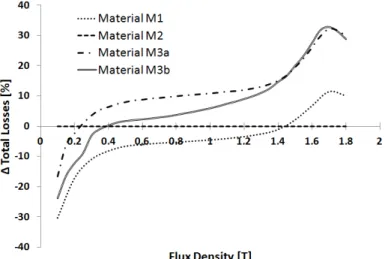
Figure 6 shows the total iron losses evolution as function of the flux density. Figure 7 shows the
relative differences between them with respect to the losses on the material M2 (M2 is our reference).
Epstein frame results from the test indicate that the samples have different performances. Samples of
materials M1 and M2 have close iron losses values, below 1.4 T. The material M1 can be considered
of better quality. For high flux density, common in electrical machines, M1 has 5% to 10% higher
losses compared to M2. Thus, based on the results of Epstein frame, it can be concluded that the
material M2 is the best choice among the three materials.
Fig. 7. Relative iron losses (reference is M2) at 60Hz.
Figure 8 presents the iron losses relative differences as function of the frequency taking as reference
the material M2 for the flux density equal to 1.4 T. For the whole frequency range, the material M2
provides the best performance.
Fig. 8. Relative iron losses (material M2 is the reference) at pick flux density of 1.4 T as function of the frequency.
B. Ring Core test
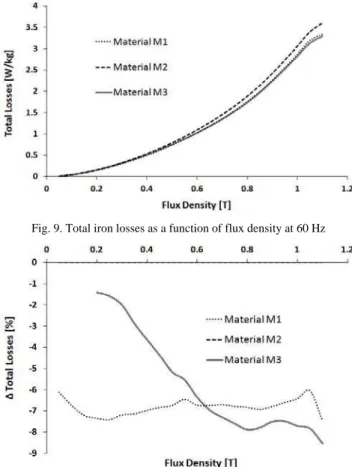
The ring core measured results present a different conclusion when compared to the Epstein frame
test. Figures 9 and 10 describe the iron losses as a function of the flux density at 60Hz. Using again
the material M2 as the reference, Figure 10 shows the relative iron losses differences. In this test,
material M3 presents the best performance. For flux densities higher than 0.6 T, the M3 lamination
stack presents total iron losses about 8% lower compared to M2. We observe that material M3 has the
worst result on the Epstein frame test. Material M1 also shows a better performance than material M2
on the ring core test. The measured results correspond to the average losses value for a set of ten
Fig. 9. Total iron losses as a function of flux density at 60 Hz
Fig. 10. Relative total iron losses (material M2 is the reference) at 60Hz.
Figure 11 shows the total iron losses differences as function of frequency for a fixed value of flux
density equal to 0.8 T. The peak flux density value is chosen at 0.8 T in order to reach frequencies up
to 300 Hz. Above 50 Hz the material M3 lamination stack sample has the smallest losses considering
all other materials. At 150 Hz, material M3 presents total iron losses 14% smaller than material M2.
Fig. 11. Proportion of magnetic losses in reference with results obtained for the material M2 under a flux density of 0.8 T as function of the frequency.
On the ring core test, since the magnetization is tangential, all directions of magnetization are
considered and therefore the magnetic anisotropy effects are included in the measured results [3]
[11][12]. A particular steel manufacturer can focus on one type of material providing the best
magnetic characteristics when it is analyzed by the Epstein test, increasing its commercial acceptance.
for obtaining different levels of magnetic flux density. Three samples of each material are used for
reducing the dispersion value.
Figure 12 shows the results obtained with dynamometer taking again M2 as a reference. Although
the values are close, they show performance tendencies very close to the data obtained from the ring
core tester. At low inductions (low voltages) material M1 has the best performance. As the magnetic
induction increases, material M3 appears as yielding the best performance.
Fig. 12. Relative efficiency data obtained with the dynamometer test (material M2 is the reference).
D. Some considerations on magnetic permeability
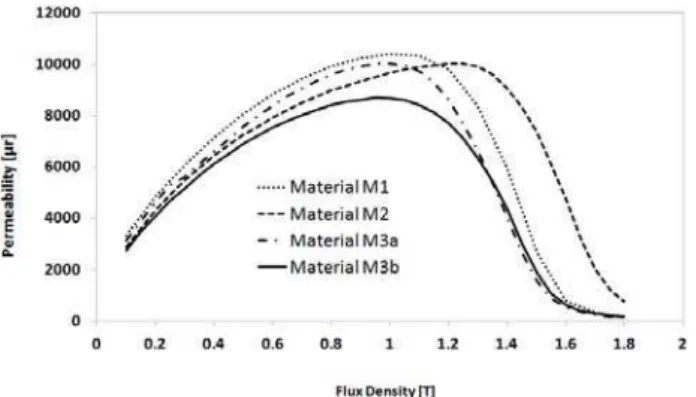
Similar results can also be observed on magnetic permeability curves. Curves of relative magnetic
permeability of materials tested under Epstein frame are shown in Figure 13. Notice that above 1.2 T
the permeability curve of material M2 exceeds others materials’ permeabilities and reach high values
under high inductions. In this aspect, material M2 could also be considered the best one for inductions
above 1.4 T. As result, the motor using M2 would operate at the highest induction, and would need
the smallest magnetization current, comparing the use of the other samples.
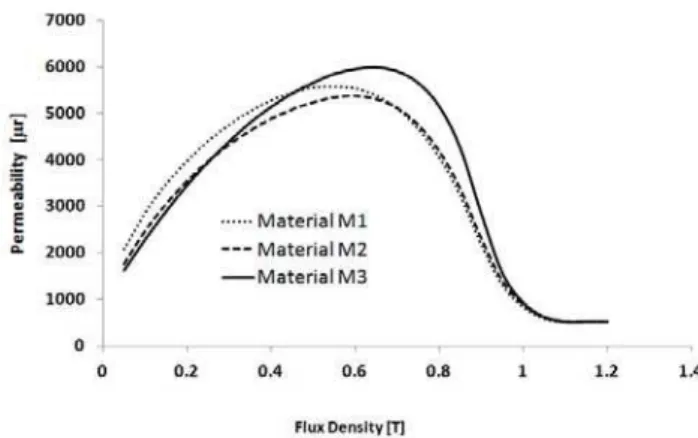
Figure 14 presents the relative magnetic permeability curves of materials tested on the ring core
test. In this experimental approach, material M3 has high values of permeability for inductions above
0.4 T and therefore the tendency to saturate at high inductions.
Fig. 14. Relative magnetic permeability obtained under the ring core test.
In the ring core test the magnetization vector is almost totally tangential to the radius of the sample.
Then all magnetization directions are present, i.e., the magnetic anisotropy is considered.
V. FINAL CONSIDERATIONS
If a designer has to choose a material taking into account only the results obtained from the Epstein
frame test, probably the choice would be materials having the behavior of M1 or M2, with preference
for the M2 and material M3 would be the first to be discarded if only such results are observed.
However, tests performed by means of the ring core bench show that material M3 has the best
performance among all the three samples. In dynamometer tests, performed on stators prototypes
made with these materials, the best performance is reached with material M3 and the worst with
material M2.
This paper relates and points out how relevant are to analyze and investigate the electrical steel
behavior by more than one methodology and, particularly, does not rely only the Epstein frame test.
Tests using samples already punched at their final application form, may detect differences among the
materials that standard tests are not able to reveal.
The closer to operation conditions the tests are, the compared results are more reliable. The ring
core is not a test capable of reproducing the stator flux (for instance, teeth flux is not present and the
magnetization is unidirectional). However, compared with the Epstein test, the ring core submits the
samples to a close condition to the real machine operation.
The rotational magnetization losses are higher than the unidirectional losses when the
magnetization is predominantly rotational. It happens in some parts of the machine and, for instance,
the stator has rotational field losses only in a small volume portion. In induction motor stators, only
REFERENCES
[1] Espíndola, A. A. de, Tristão, F., Schlegel, J. P., Batistela, N. J.; Sadowski, N., Kuo-Peng, P., Rigoni, M. Comparison of Iron Losses Evaluations by Different Testing Procedures. In: Electrical Machines (ICEM), 2010 XIX International Conference on, pp.1-4, 6-8 Sept. 2010.
[2] Magnetic Materials – Methods of Measurement of the Magnetic Properties of Electrical Steel Sheet and Strip by Means of an Epstein Frame, IEC Standard 404-2, 1996-03.
[3] P. Beckley, Electrical Steels for Rotating Machines – (IEE Power and Energy Series, No. 37). Glasgow, Bell & Bain Ltd., 2002.
[4] E. J. Meurer, J. S. D. Garcia, N. J. Batistela; R. Carlson, N. Sadowski, P. Kuo-Peng, J. P. A. Bastos, Análise e Comparação de Aparelhos para Medidas de Perdas Magnéticas em Lâminas de Aço ao Silício. In: MOMAG 2004, 2004, São Paulo - S.P. Anais de Congresso - CD Room, 2004. v. 1. p. 1-5, (in Portuguese).
[5] Torres, A. G., Lyra, R., Cardoso Filho, B. J., Cunha, M.A., Paolinelli, S.C. Determination of the Magnetic Losses in Induction Motors based on the Generalized Epstein Test. In: 39th IAS Annual Meeting, 2004, Seattle. Conference record of the 2004 IEEE Industry Application Conference.
[6] Brockhaus Messtechnik, Electrical Steel Tester MPG [Online]. Available: http://www.brockhaus.net/e-index.html
[7] Test Methods for Magnetic Steel Sheet and Strip, JIS Standard C2550:2000, 2000-11.
[8] S.E. Zirka, Y.I. Moroz, P. Marketos, A.J. Moses, D.C. Jiles, T. Matsuo, Generalization of the Classical Method for Calculating Dynamic Hysteresis Loops in Grain-Oriented Electrical Steels, IEEE Trans. Magnetics, pp. 2113 – 2126, Sept. 2008.
[9] P. Marketos, S. Zurek, A. J. Moses, A Method for Defining the Mean Path Length of the Epstein Frame, IEEE Trans. Magnetics,vol. 43, pp.2755-2757, June 2007.
[10]R. Carlson, E. J. Meurer, N. J. Batistela, N. Sadowski, L. Von Dokonal, A. A. Espíndola. Interlaminar Losses Evaluation in Electrical Machines Stators. Presented at XVII International Conference on Electrical Machines – ICEM, Crete Island, Greece, 2006.
[11]M. F. de Campos, Fernando J. G. Landgraf, Anisotropy of Steel Sheets and Consequence for Epstein Test: II Experiment”. XVIII Imeko World Congress, Rio de Janeiro, Brazil, September, 2006.