Abstract— This paper presents a statistical modeling of rain
attenuation in terrestrial links located in a tropical region using different types of distribution. Each distribution is tested against long-term statistics of data collected during up to two years of experimental measurements in links operating at 15 GHz. Statistics obtained from each distribution are tested against the corresponding ones derived from the experimental data using a test variable described in the ITU recommendation P.311-13 and an alternative test variable.
Index Terms— radio propagation, rain attenuation, statistical modeling, terrestrial links.
I. INTRODUCTION
Radio links operating at frequencies above 10 GHz are subject to severe propagation impairments.
The main cause of unavailability in wireless systems operating outdoor at these frequencies is the
attenuation caused by rainfall. To counteract rain effect, different fade mitigation techniques (FMT)
may be used: adaptive transmission power control, route diversity or adaptive modulation and coding
schemes. An accurate prediction of the attenuation caused by rain is essential for the design of these
systems.
To predict the percentage of time during which a system will be unavailable it is necessary to study
the stationary behavior of the rain attenuation in terms of the percentage of time that a specific level
of attenuation is exceeded. In this case, the knowledge of the statistics of rain attenuation is enough.
However, to develop and test FMT, the dynamic behavior of rain attenuation must be known.
Unfortunately, long-term propagation measurements of this effect are scarce and not available for any
location, frequency and link geometry. Prediction models based in the statistical modeling of rain
attenuation must be employed. Among the prediction models, there are the purely stochastic ones, for
which statistical modeling is indispensable since it provides statistics parameters to feed them.
In the seventies, S. H. Lin [1] showed that the conditional long-term distribution of rain attenuation
is approximately lognormal. The study was based on thirty-one sets of experimental data collected in
terrestrial and earth-space links operating above 10 GHz in five different countries. Since then, the
Statistical Modeling of Rain Attenuation in
Tropical Terrestrial Links
Fernando J. A. Andrade, Luiz A. R. da Silva Mello, Marlene S. Pontes
Center for Telecommunication Studies – Catholic University of Rio de Janeiro, R. Marquês de São Vicente, 225, Gávea, Ed. Kennedy, 7º andar, Rio de Janeiro, RJ, 22453-900, Brazil [email protected],
[email protected], [email protected] Marcio E. C. Rodrigues
Journal of Microwaves, Optoelectronics and Electromagnetic Applications, Vol. 11, No. 2, December2012
Brazilian Microwave and Optoelectronics Society-SBMO received 24 July 2012; for review 25 July 2012; accepted 07 Nov. 2012 Brazilian Society of Electromagnetism-SBMag © 2012 SBMO/SBMag ISSN 2179-1074 297
assumption of a lognormal behavior of rain attenuation for both slant paths [2]-[5] and terrestrial links
[6] has widely been adopted. This assumption provides good results for many temperate climates.
There are, however, important exceptions and other distributions must be considered. In [7]-[8], the
Weibull distribution is used to model rain attenuation in slant paths, whereas [8]-[9] consider Gamma
distribution. The Lognormal distribution is used to model unconditional attenuation distributions for
satellite and terrestrial links in tropical regions in [10] and [11], respectively, and a Bi-Lognormal
distribution was analyzed in [12] for slant-paths, but there is evidence that the Gamma distribution
performs better for terrestrial links in such regions [13]. The synthesizers models in these references
generate time series containing clear sky and rain attenuation periods and unconditional distributions
are used to derive statistics parameters.
Recently, the Inverse Gaussian distribution has been proposed by [14] to model the conditional
distribution of rain attenuation in earth-space and terrestrial links located in both temperate and
tropical climates.
In this paper, several types of distribution representing the statistical behavior of rain attenuation in
terrestrial links are examined and tested using long-term experimental data obtained from five links
converging at a tropical site [15]. The statistical modeling considers the experimental unconditional
distributions of rain attenuation in order to help the development of time series synthesizers. Also, a
new test variable [16] is used to evaluate the errors between predicted and experimental statistics of
rain attenuation.
II. EXPERIMENTAL SETUP
The experimental data of rain attenuation were collected in five convergent line-of-sight terrestrial
links located in São Paulo, Brazil, for periods between one and two years depending on the link. The
links characteristics are given in Table I [15] and their spatial distribution is shown in Fig.1.
TABLE I. LINK CHARACTERISTICS Link Path length
(km)
Frequency (GHz)
Sampling rate (Hz)
Time period (months)
Up-time (%)
BD 12.8 14.55 0.1 24 88.6 CN15 12.8 14.55 0.1 24 91.8
SC 18.4 14.50 0.1 12 90.6 BA 21.7 14.53 0.1 12 89.2 PR 43.0 14.52 1.0 24 91.9
The experimental setup included a tipping bucket raingauge located at the common end of the links,
with 0.1 mm capacity, and a data acquisition unit that samples and records the AGC voltage of each
receiver, as well as the date and time of each raingauge tip. Calibration curves obtained previously
enable to convert AGC voltage data in received power levels. Further processing leads to the
corresponding rain attenuation time series values. The raingauge data helps to identify the dynamic
The lo
the atten
modeled
of the lin
where ea Takin variable Theorem rain atte Howe regions may exi Besid model th Nakagam presents The p term Co in specif theoretic
is an inte The u
attenuati
accordin
ognormal beh
nuation A(t)
d by random
nk site.
ach {Si}, wit
ng logarithms
s. If the num
m states that
nuation is lo
ever, the bes
when compa
st a dominan
es the Logn
he measured
mi (Na) [17]
s the Probabi
parameters of
omplementary
fic ranges of
c attenuation
eger multiple o upper limit
ion levels ar
ng to the mar
Fig
havior of rai
is influence
time-varyin
th 1 ≤i≤n, r
s on both sid
mber of vari
the distribut
og normally d
st performan
ared to Logn
nt componen
ormal (Ln) a
d rain attenua
. Only the tw
lity Density
f each type o
y Cumulativ
f time percen
n CCDFs. Sin of 12 months a
of the rang
re always hig
rgin of each
g. 1. Spatial dis
III. STA
n attenuation
d by many e
ng multiplica
represents on
des of (1) it i
ables is larg
tion of log A
distributed.
nce of Gam
normal [13] s
t in the atten
and Gamma ation statistic wo-paramete Functions (P of distributio ve Distributio
ntage that m
nce long-term as recommend ge of time p
gher than 1
link: 0.01%
stribution of the
ATISTICAL MO
n might be ju
effects of th
ative function
ne random in
s possible to
ge and there
A approaches
mma distribu
suggests tha
nuation effect
a (Ga), four a
cs: Pareto (P
r versions of
PDF) of thos
on are derive
on Function
minimizes the
cumulative st ded by ITU [1 percentage u
dB. The min
for BD link
e convergent lin
ODELING
ustified, acco
e propagatio
ns that depen
nfluence of an
o observe tha
is no domin
s a Normal d
ution for terr
t, for high in
t.
additional ty
Pa), Weibull
f these distrib
e distribution
ed from the e
(CCDF) of r
e r.m.s error
tatistics are be 18].
used in the
nimum value
k, 0.02% for
nks.
ording to Lin
on medium.
nd on climat
n environme
at log A is a s
nant influenc
distribution w
restrial links
ntensity of ra
ypes of distr
(We), Invers
butions were
ns.
experimental
rain attenuati
in dB betwe
eing considere
curve fittin
e of time pe
CN15, 0.03%
n [1], conside
These effect
ologic chara
ental paramet
sum of many
ce, the Centr
which means
s located in
ainfall regim
ribution were
se Gaussian
e considered.
l uncondition
ion by a curv
een experime
ed, the observa
ng is 5%, fo
ercentage wa
% for BA, 0
ering that
ts can be
acteristics
(1)
ter [1].
y random
ral Limit
s that the
n tropical
mes, there
e used to
(IG) and
. Table II
Journal of Microwaves, Optoelectronics and Electromagnetic Applications, Vol. 11, No. 2, December2012
Brazilian Microwave and Optoelectronics Society-SBMO received 24 July 2012; for review 25 July 2012; accepted 07 Nov. 2012 Brazilian Society of Electromagnetism-SBMag © 2012 SBMO/SBMag ISSN 2179-1074 299
SC and 0.1% for PR.
TABLE II. STATISTICAL DISTRIBUTIONS
Distribution Probability density function (PDF) Parameters
Gamma
Γ
x≥ 0, b > 0, c > 0,
Γ is the Gamma function Inverse
Gaussian
/
x > 0, > 0, > 0
Lognormal
√
⁄
x≥ 0, m > 0, σ > 0
Nakagami
Γ
x > 0, > 0.5, ω > 0
Γ is the Gamma function
Pareto . x≥a, a > 0, c > 0,
Weibull x≥ 0, η > 0, β> 0
Three different fittings were done with the lognormal distribution (Ln1, Ln2 and Ln3). In the case
of Ln1, a linear fitting of the logarithm of attenuation CCDF was performed [3]. Ln2 is similar to Ln3,
but an attenuation offset parameter is included in the fitting [11].
The fitted distributions were compared to the experimental ones at time percentages [0.01; 0.02;
0.03; 0.05; 0.1; 0.2; 0.3; 0.5; 1; 2; 3; 5] using the test variable Vi defined by ITU-R Rec. P.311-13 for
each of the i radio links [18]:
,⁄ . ln ,⁄ , for ,
ln ,⁄ , for , dB
(2)
where Am (dB) is the measured attenuation and Ap (dB) is the predicted attenuation.
To evaluate the results over a range of time percentages, the r.m.s. value of all Vi values in the range
is calculated. Two ranges of time percentage were considered: below 1% and below 5%. Table III
shows the r.m.s. values obtained for each distribution and each link.
The results indicate a better performance of the Gamma and Inverse Gaussian distributions for the
range of time percentages is below 1%. If the range below 5% is considered, the Inverse Gaussian has
the best performance, except for SC link. It is possible to observe that the performance of the
distributions, except Ln1, is degraded in this range. The measured values of exceeded attenuation for
time percentages greater than 1% are always lower than 10 dB. The tapering factor of ITU test
variable that reduces the influence of low attenuation levels was developed assuming a lognormal
distribution of rain attenuation. Thus, the performance comparison of the different distributions is
TABLE III. STATISTICAL MODELING – R.M.S. ERRORS
Link
Curve fitting range
(%)
Distribution
Curve fitting
r.m.s error (dB)
ITU (below
1%)
ITU (below
5%)
Alternative method
Range
(%) r.m.s.
Range (%) r.m.s
Range
(dB) Range (%) r.m.s
BD 0.01-5
Pa 2.24
0.01-1
0.20
0.01-5
0.40 2-32 0.01-1.80 0.75 Ga 0.58 0.06 0.23 2-32 0.01-1.80 0.10 We 1.28 0.14 0.23 2-32 0.01-1.80 0.32 IG 0.71 0.08 0.08 2-32 0.01-1.80 0.15 Na 0.82 0.21 0.41 2-32 0.01-1.80 0.21 Ln1 4.78 0.19 0.17 2-32 0.01-1.80 0.28 Ln2 1.21 0.15 0.17 2-32 0.01-1.80 0.29 Ln3 1.67 0.17 0.31 2-32 0.01-1.80 0.46
CN15 0.02-5
Pa 1.92
0.02-1
0.13
0.02-5
0.30 2-32 0.03-2.91 0.60 Ga 0.64 0.04 0.28 2-32 0.03-2.91 0.13 We 1.01 0.09 0.14 2-32 0.03-2.91 0.21 IG 0.55 0.05 0.06 2-32 0.03-2.91 0.08 Na 1.13 0.16 0.58 2-32 0.03-2.91 0.29 Ln1 3.13 0.13 0.11 2-32 0.03-2.91 0.17 Ln2 0.93 0.09 0.13 2-32 0.03-2.91 0.17 Ln3 1.38 0.11 0.22 2-32 0.03-2.91 0.33
BA 0.03-5
Pa 1.78
0.03-1
0.13
0.03-5
0.31 2-32 0.05-2.45 0.45 Ga 0.76 0.08 0.38 2-32 0.05-2.45 0.16 We 0.91 0.08 0.12 2-32 0.05-2.45 0.15 IG 0.49 0.04 0.10 2-32 0.05-2.45 0.07 Na 1.28 0.26 0.56 2-32 0.05-2.45 0.31 Ln1 3.05 0.11 0.09 2-32 0.05-2.45 0.11 Ln2 0.92 0.09 0.12 2-32 0.05-2.45 0.15 Ln3 1.25 0.10 0.21 2-32 0.05-2.45 0.25
SC 0.05-5
Pa 1.30
0.05-1
0.09
0.05-5
0.22 2-32 0.05-2.86 0.26 Ga 1.03 0.10 0.47 2-32 0.05-2.86 0.21 We 0.76 0.06 0.05 2-32 0.05-2.86 0.08 IG 0.68 0.05 0.17 2-32 0.05-2.86 0.12 Na 1.42 0.27 0.66 2-32 0.05-2.86 0.34 Ln1 1.47 0.06 0.06 2-32 0.05-2.86 0.08 Ln2 0.82 0.06 0.15 2-32 0.05-2.86 0.09 Ln3 0.94 0.07 0.11 2-32 0.05-2.86 0.12
PR 0.1-5
Pa 2.06
0.1-1
0.08
0.1-5
0.27 3-32 0.15-3.55 0.40 Ga 0.48 0.03 0.15 3-32 0.15-3.55 0.05 We 1.10 0.05 0.14 3-32 0.15-3.55 0.15 IG 0.61 0.03 0.06 3-32 0.15-3.55 0.07 Na 1.10 0.04 0.43 3-32 0.15-3.55 0.13 Ln1 3.15 0.12 0.10 3-32 0.15-3.55 0.11 Ln2 0.78 0.04 0.12 3-32 0.15-3.55 0.09 Ln3 1.50 0.06 0.20 3-32 0.15-3.55 0.24
The ITU test variable considers the ratio between measured and predicted attenuations to evaluate
the accuracy of a prediction method. However, as pointed out by [16], “links are designed to meet
availability objectives, usually expressed in terms of percentages of one year or one month, i.e.,
percentages of time”. Considering that, an alternative test variable proposed in [16] was also
considered:
log (3)
where Pm is the measured exceedance probability and Pp is the predicted exceedance probability for
Journal of Microwaves, Optoelectronics and Electromagnetic Applications, Vol. 11, No. 2, December2012
Brazilian Microwave and Optoelectronics Society-SBMO received 24 July 2012; for review 25 July 2012; accepted 07 Nov. 2012 Brazilian Society of Electromagnetism-SBMag © 2012 SBMO/SBMag ISSN 2179-1074 301
To evaluate the results over a range of attenuation levels, the r.m.s. value of all Vi2 values in the
range is calculated.
The alternative test variable requires values for measured and predicted exceedance probabilities
associated to an attenuation threshold. To apply the test variable to ITU databanks it is necessary to
invert the ITU prediction method which can be done using numerical methods [16].
The main advantage of the alternative test variable is to test the performance of different prediction
methods using experimental data with different range of time percentages.
The attenuation levels [2; 3; 4; 5; 6; 8; 10; 12; 15; 17.5; 20; 22.5; 25; 27.5; 30; 32] were considered,
except for the PR link which starts at 3 dB level since 2 dB corresponds to a time percentage out of
the range used in the fitting.
Table III shows the r.m.s. values for each distribution and each link. The results indicate a better
performance of Inverse Gaussian and Gamma distributions.
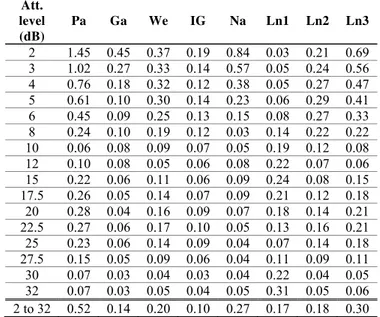
Table IV shows a comparison of the overall performance of the various distributions considering all
5 links. The Inverse Gaussian distribution has the best overall performance followed by Gamma,
which does not perform so well for attenuation levels lower or equal to 4 dB.
TABLE IV. COMPARISON OF OVERALL PERFORMANCE WITH NEW TEST VARIABLE Att.
level (dB)
Pa Ga We IG Na Ln1 Ln2 Ln3
2 1.45 0.45 0.37 0.19 0.84 0.03 0.21 0.69 3 1.02 0.27 0.33 0.14 0.57 0.05 0.24 0.56 4 0.76 0.18 0.32 0.12 0.38 0.05 0.27 0.47 5 0.61 0.10 0.30 0.14 0.23 0.06 0.29 0.41 6 0.45 0.09 0.25 0.13 0.15 0.08 0.27 0.33 8 0.24 0.10 0.19 0.12 0.03 0.14 0.22 0.22 10 0.06 0.08 0.09 0.07 0.05 0.19 0.12 0.08 12 0.10 0.08 0.05 0.06 0.08 0.22 0.07 0.06 15 0.22 0.06 0.11 0.06 0.09 0.24 0.08 0.15 17.5 0.26 0.05 0.14 0.07 0.09 0.21 0.12 0.18 20 0.28 0.04 0.16 0.09 0.07 0.18 0.14 0.21 22.5 0.27 0.06 0.17 0.10 0.05 0.13 0.16 0.21 25 0.23 0.06 0.14 0.09 0.04 0.07 0.14 0.18 27.5 0.15 0.05 0.09 0.06 0.04 0.11 0.09 0.11 30 0.07 0.03 0.04 0.03 0.04 0.22 0.04 0.05 32 0.07 0.03 0.05 0.04 0.05 0.31 0.05 0.06 2 to 32 0.52 0.14 0.20 0.10 0.27 0.17 0.18 0.30
The lognormal (Ln1) has the best performance for levels lower or equal to 6 dB, but does not
perform so well for higher levels, whereas Nakagami has a good performance for levels greater or
equal to 8 dB, but does not perform well for lower levels. When comparing the Inverse Gaussian and
Lognormal (Ln1) distributions, the results confirm the ones obtained for conditional distributions in
[14].
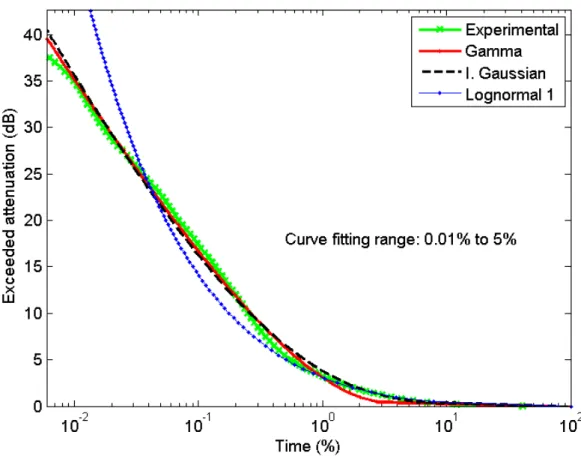
appropriate type of distribution.
Fig. 2 shows the curve fittings for BD link using Inverse Gaussian, Gamma and Lognormal (Ln1)
distributions.
Fig. 2. Statistical modeling using Inverse Gaussian, Gamma and Lognormal (Ln1) distributions.
IV. CONCLUSION
The results indicate that Inverse Gaussian and Gamma are the most adequate distributions to model
statistics of rain attenuation in terrestrial links located in a region with tropical climate. Both
distributions perform well for medium and high levels of attenuation, but both the Inverse Gaussian
and the Lognormal outperform the Gamma distribution at low levels.
A new test variable was used to evaluate the fitted attenuation distributions in comparison to
measured ones. It has the advantage of evaluating the errors in terms of predicted unavailability time
percentages, which corresponds the actual performance objectives in the process of radio links design.
ACKNOWLEDGMENT
This work was supported by CNPq under covenant 573939/2008-0 (INCT-CSF) and by FAPERN
and CNPq under covenant 005/2011 PPPIV / number 65. The authors would like to thank Charilaos I.
Journal of Microwaves, Optoelectronics and Electromagnetic Applications, Vol. 11, No. 2, December2012
Brazilian Microwave and Optoelectronics Society-SBMO received 24 July 2012; for review 25 July 2012; accepted 07 Nov. 2012 Brazilian Society of Electromagnetism-SBMag © 2012 SBMO/SBMag ISSN 2179-1074 303
Greece, for the suggestions concerning the applying of Inverse Gaussian distribution to model rain
attenuation.
REFERENCES
[1] S. H. Lin, “Statistical behavior of rain attenuation,” Bell Syst.Tech. Journal, vol. 52, pp. 557-581, Apr. 1973.
[2] T. Maseng and P. M. Bakken, “A stochastic dynamic model of rain attenuation,” IEEE Trans. Com., vol. 29, no. 5, pp. 660-669, May 1981.
[3] F. Lacoste, M. Bousquet, L. Castanet, F. Cornet, and J. Lemorton, “Improvement of the ONERA-CNES rain attenuation time series synthesizer and validation of the dynamic characteristics of the generated fade events,” Space Comm. Journal, vol. 20, no. 1-2, pp. 45-59, 2005.
[4] Recommendation ITU-R 1853, “Tropospheric attenuation time series synthesis”, 2009.
[5] B. C. Gremont and M. Filip, "Spatio-temporal rain attenuation model for application to fade mitigation techniques,"
IEEE Transactions on Antennas and Propagation, vol. 52, no. 5, pp. 1245-1256, May 2004.
[6] M. Cheffena, L. E. Braten, and T. Ekman, "On the Space-Time Variations of Rain Attenuation," IEEE Transactions on Antennas and Propagation, vol. 57, no. 6, pp. 1771-1782, June 2009.
[7] A. D. Panagopoulos, P.-D. M. Arapoglou, J. D. Kanellopoulos, and P. G. Cottis, “Long-term rain attenuation probability and site diversity gain prediction formulas,” IEEE Transactions on Antennas and Propagation, vol. 53, no. 7, pp. 2307-2313, Jul. 2005.
[8] S. A. Kanellopoulos, G. Fikioris, A. D. Panagopoulos, and J. D. Kanellopoulos, “A modified synthesis procedure for first order stochastic differential equations for the simulation of baseband random processes,” Signal Processing, vol. 87, pp. 3063-3074, June 2007.
[9] A. D. Panagopoulos and J. D. Kanellopoulos, “Adjacent Satellite Interference Effects as Applied to the Outage Performance of an Earth-Space System Located in a Heavy Rain Climatic Region”, Annals of Telecommunications, no. 9-10, pp.925-9422, 2002.
[10]M. E. C. Rodrigues, G. Carrie, L. Castanet, and L. A. R. da Silva Mello, “Study and test of rain attenuation time series synthesizers for tropical and equatorial areas,” in Proc. 4th European Conference on Antennas and Propagation, Barcelona, 2010, pp. 1-5.
[11]F. J. A. Andrade, M. E. C. Rodrigues, and L. A. R. da Silva Mello, "Terrestrial rain attenuation time series synthesizers for tropical regions," J. Microw. Optoelectron. Electromagn. Appl., vol. 10, no. 1, pp. 131-142, 2011.
[12]F. J. A. Andrade, M. E. C. Rodrigues, and L. A. R. da Silva Mello, “Development of Rain Attenuation Synthesizers for Earth-Space and Terrestrial Links in Tropical Climates,” in Proc. of 2011 SBMO/IEEE MTT-S International Microwave and Optoelectronics Conference, Natal, Brazil, Nov. 2011, pp. 318-322.
[13]F. J. A. Andrade and L. A. R. da Silva Mello, "Rain Attenuation Time Series Synthesizer Based on the Gamma Distribution," IEEE Antennas and Wireless Propagation Letters, vol. 10, pp. 1381-1384, 2011.
[14]C. I. Kourogiorgas, A. D. Panagopoulos, I. D. Kanellopoulos, and G. K. Karagiannidis, “On the Inverse Gaussian Modeling of Rainfall Rate and Slant Path and Terrestrial Links Rain Attenuation,” in Proc. 6th European Conference on Antennas and Propagation, Prague, 2012, pp. 1-5.
[15]L. A. R. Silva Mello, E. Costa, and R. S. L. Souza, “Rain attenuation measurements at 15 and 18 GHz,” Electronics Letters, vol. 38, no. 4, pp. 197-198, Feb. 2002.
[16]M. S. Pontes, L. A. R. da Silva Mello, M. J. Willis, S. Salamon, and T. Tjelta, “Experimental data and testing procedures for modelling of propagation effects on terrestrial radio links from C to W bands,” in Proc. 6th European Conference on Antennas and Propagation, Prague, 2012, pp. 1-4.
[17]M. Evans, N. Hastings, and B. Peacock. Statistical Distributions. New York: John Wiley & Sons, Inc., 2000.