Abstract— This paper presents an equipment dedicated to the monitoring of synchronous generator through the measurements of the external magnetic field time derivative. The equipment uses a methodology which can be an additional technique to those applied currently on the faults detection, mainly when monitoring the incipient faults type. Based on frequency spectra (magnetic signatures), the faults detection is performed by the analysis of the components evolution. As it is not possible to test the ability of the equipment in detecting several types of faults of generators faults in a power plant, a testbench was constructed for this purpose. Faults inserted deliberately in the generators of the testbench are detected by the equipment, showing its capacity. This equipment has been also installed in power plants.
Index Terms— incipient faults detection, FEM, external magnetic field, magnetic signature, synchronous machine, voltage coil sensor.
I. INTRODUCTION
Usually, high voltage generators are related to high costs. They are expensive and their energy
production is financially very relevant. The detection of an incipient fault at its initial stage helps to
avoid serious breakdown including the assets of the company and consequently reduces the deficit.
The capability on detecting faults at initial stages provides also an upgrade of the security on the
machine operation, increasing the reliability of the electrical system. These are the elements justifying
and motivating the study and the development of systems for monitoring the health of the machine.
Works about measurements of external fields have been discussed since 1970. Some of them deal
with measurements and numeric simulations of the field in the vicinity of low power machines
[1]-[4]. Several papers consider fault diagnosis of machines, mainly three-phases induction machines. In
1998, reference [5] used the analysis of the external field to detect faults in induction motors. Such
works use non-invasive methodology which consists on analyzing the frequency spectral components
of the measured external field. Nevertheless, studies addressing methodologies of sensing external
magnetic field on generators, are still are [6]-[8]. Near the generators, there are leakage field
originated by the machine. This magnetic field is due to the leakage flux of the end windings and the
stator core (the tangential components of the magnetic field are conserved between two media [9]).
Non
-
invasive monitoring system of
synchronous generator using external field
H. F. dos Santos, M. Rigoni, R. de A. Elias, L. A. Feler, C. A. C. Wengerkievicz, N. J. Batistela, N. Sadowski, P. Kuo-Peng, J. P. A. Bastos
Universidade Federal de Santa Catarina
GRUCAD/EEL/UFSC, Florianópolis, Santa Catarina, P.O. Box 476, 88040-970, Brazil
[email protected] [email protected], [email protected], [email protected] L. M. de Freitas
Normally, the machine external fields are generated by currents and/or by the composition of
currents flowing in the windings, by eddy currents on the magnetic core or in the conducting materials
and also by the rotor remnant magnetization, when the machine is not excited. The leakage fields,
which can be considered inconvenient, turn out to be beneficial: information about the machine
condition (windings short circuit, air gap dimension variation (eccentricity), magnetic sheets
insulation etc…) can be obtained externally without implementing devices like sensors inside the
machine (for example in the air gap area). Thus, it is possible to obtain frequencies spectrum from the
external magnetic field waveforms also called the “magnetic signature” of the machine.
The main goal of this work is to design, implement and show the results of a non-invasive
monitoring system of a synchronous generator operating at the Itá hydroelectric plant and at the Jorge
Lacerda thermoelectric plant complex. The hydroelectric power plant of Itá (UHE Itá) is located in the
border of Santa Catarina and Rio Grande do Sul states, both in the south of Brazil. Jorge Lacerda
thermoelectric plant (CJL) is located in the south of Santa Catarina State.
As it is impossible to insert faults intentionally in the power plant generators, two prototypes have
been constructed. They consist on an eight poles and a two poles generators where faults are
deliberately inserted. Theoretical and experimental results obtained from these prototypes are
presented in this work in order to show the capability of the system on detecting incipient faults in
generators.
Finally, preliminaries magnetic signatures obtained from the developed system and implemented on
the power plants are presented. The capability of the system on sensing signals and the developed
software to process these signals for extracting the magnetic signatures are shown. In this paper, the
signatures consist on the frequency spectrum obtained from the time derivative waveforms of the
generator external field.
II. THEORETICAL BACKGROUND
In synchronous generators, the electrical odd harmonics are usually due to non-sinusoidal
waveforms related to the non-linear characteristics of the materials, the slots, the rotor poles saliency,
the windings distribution and the operation point. On the other hand, if the machine is considered
healthy, even harmonic components of the electrical fundamental are also present. As a matter of fact,
due to little variation of the air gap dimension, the magnetic material anisotropy and the
non-uniformity of the windings etc., the half cycle waveforms of the field in the air gap are not perfectly
symmetric.
For machines with pole pairs number larger than one, the electrical cycles are not perfectly equal
during one rotation of the machine. Thus, in real machines, the frequency spectrum can present
mechanical fundamental and its harmonic frequencies, plus odd electrical harmonics whose
amplitudes are normally higher than the mechanical ones. That occurs generally in machines without
substantially. Thus, incipient faults in electric machines can be monitored by analyzing the
frequencies spectrum which includes mechanical fundamental and its harmonics frequencies. In the
next section, a brief explanation of the presence of mechanical fundamental and its harmonic
frequencies spectrum is presented. Previous works about this topic have been published in [10]-[12].
A. Analytical approach
A slotless, p poles pairs, non-salient poles generator operating at no load, with perfectly distributed
and symmetrical windings is considered. The magnetic cores are isotropic and non saturated. So,
harmonics are not present and there is only the fundamental electrical component. In this hypothetical
case, the air gap induction waveform B(t) is given by (1), where B is the flux density amplitude and ωe
the fundamental electrical angular frequency.
� = � ���� (1)
For instance, in the case of a fault in one pole (e.g., when the number of turns of one pole is smaller
than the number of turns of the healthy pole), the induction waveform in the air gap presents a smaller
amplitude for the faulty pole (b) than that of the healthy one (B). The amplitude of B(t) has the same
value B for a mechanical rotation with period Tm=pTe, except for one half of a electrical period Te
when the amplitude has the value b. In such a case, the induction waveform may present two
complementary terms as given by (2).
� = { � sin �� , 0 ≤ <
�
2 � sin �� , 0 ≤ < � 2�
(2)
Equation (1) is periodic and considering the fundamental period Tm, i.e., for a mechanical rotation,
this equation can be represented by an analytical term by means of Fourier series given by (3), where
k=1, 2,3,… are the series coefficients (i.e., the mechanical harmonics order). When B(t) is perfectly symmetric (i.e, b=B), the first and the third terms of (3) are null, leading to (1), where ωe is the rated
electrical angular frequency. When a half cycle amplitude is different from the other half, a DC
component, a mechanical fundamental and its harmonics appear (thus, the electrical components are
seen as the harmonics of the mechanical fundamental components).
p k t m k sen p k sen t m k p k k p b-B p t m p sen p B b p p B b tB cos( ) ( )
2 2 cos 2 ) 2 2 ( ( ) 1 2 ( 2 1 2 ) ( (3)
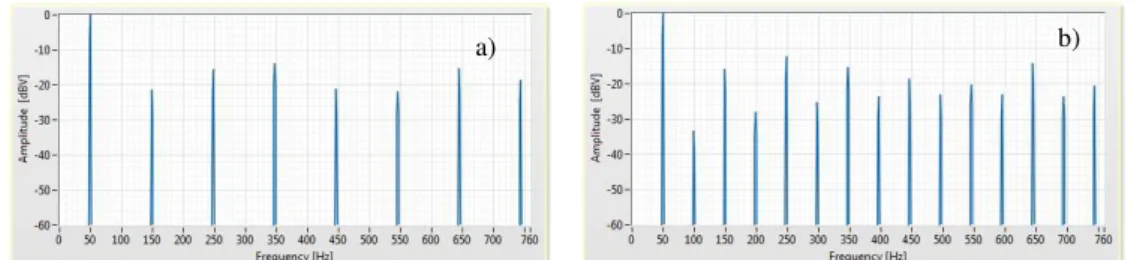
Let us suppose an 8 poles (p=4) ideal machine with rated frequency equal to 60Hz. When there is
no asymmetry (b=B), the waveform is perfectly sinusoidal and its frequency spectrum has only an
electrical fundamental component fe of 60Hz. In b≠B case, the frequency spectrum shows that even
for a negligible asymmetry, harmonic components of mechanical rotation frequency appear as
predicted by (3). B(t) waveforms for b=0.999B and b=0.9B are simulated, and their FFT (Fast Fourier
Transform) responses are respectively presented in Fig. 1a and Fig. 1b. Their amplitudes are in dB
scale based on a ratio with the amplitude of the electrical fundamental. Even with a pole excited with
an amplitude only 0.1% smaller than the others (see Fig.1), mechanical fundamental (with relative
Increasing the asymmetry (i.e., a severe fault condition), the relative amplitudes increase also as
shown in Fig. 1 when comparing the FFT in Fig. 1a with those in Fig. 1b. As expected, the even
harmonics present amplitudes variation. With the increasing no new components arise besides those
predicted by (3). Note that for this faulty waveform, as expected by (3), no odd harmonic electrical
components appear. There are some strategies to detect faults in electrical machine monitoring only
the electrical harmonics.
Fig. 1. Frequencies spectrum for cases (a) b=0.999B and (b) b=0.9B, p=4 and fe=60 Hz.
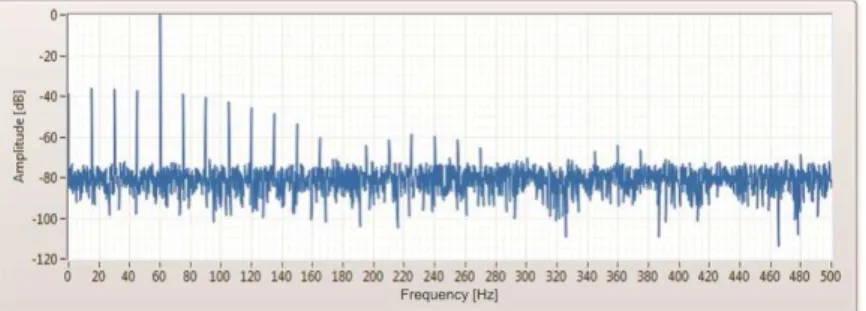
A case study including white noise to B(t) waveform is also studied. A qualitative effect of this
noise in this signal spectrum for b=0.9B is performed. Fig. 2 presents a FFT of the waveform
including it. With a background noise of approximately -80 dB (which is 10,000 times smaller than B
amplitude), spectral components whose amplitude is lower than this noise are hidden. This evaluation
is important because external fields measurement results have the same behavior as it will be shown
shortly. Thus, to apply this fault detection methodology, it is important to design an acquisition and
signal processing systems with a high noise rejection level.
Fig. 2. Frequencies spectrum for case b=0.9B, p=4 e fe=60 Hz including -80 dB white noise.
Reference [13] uses a similar approach of the methodology presented in this work. In [13],
theoretical study about faults detection was performed for asymmetric synchronous motors where an
analytical model of the air gap induction as function of permeance was developed. An experimental
study using the frequencies spectrum of the motor feeding current was also performed. The authors
conclude that when there is an eccentricity on the shaft (and in the air gap), frequency components fd
defined by (4) can be detected in the armature current. In (4), f1 is the fundamental electrical
frequency, p the number of pole pairs and k a natural number. When the motor is healthy, the
experimental results presented in [13] do not show mechanical frequency harmonics. Only the 5th and
7th electrical fundamental harmonics are present, which is something typical in machines due to
non-linearity of the ferromagnetic materials. With the default insertion, the mechanical fundamental
component and some of its harmonics come out.
(4)
A large number of papers in the literature dealing with this topic investigate, in the measured
magnetic field spectrum, some singular frequency components associated to some defaults as in [14],
or uses distortion of the field waveforms in time domain as a tool to detect fault, as in [15]. The use of
evaluation tools in frequency domain lead to cause directly or indirectly distortions in its currents and
fluxes. It can be easily checked by means of the modifications in the history of its spectral contents.
Usually, these spectral contents are called as the machine signatures. Comparing to studies on
induction motors, faults detection by means of magnetic flux (internal or external) in synchronous
machines have been slightly addressed in the literature. Faults evaluation method using flux
measurements in the air gap have been discussed since 1970 [15] and interesting researches [16]-[18]
and commercial equipments have been developed in the last few years [19], [20]. Another approach
(used by a Canadian company called Iris Power [21]) is the installation of coil sensor in the motor or
generator air gap region for monitoring flux values (or induction) produced by each poles.
Nevertheless, the use of an effectively external magnetic flux in synchronous machines has been
found in [2] and [6] in 2006 and 2007 respectively. A theoretical approach of this work has a few
similarities with that found in [13], which suggests equation (4) to represent the flux behavior in the
air gap of the synchronous machines. Even if the existence of sub-harmonics (frequency components
lower than the electrical fundamental in machines with number of poles pair higher than one) in
synchronous machines is known since 1920 [22], they have never been applied to the study of faults.
This work shows the reason of the existence of sub-synchronous components and interharmonics of
the electrical fundamental in synchronous machines.
B. FEM approach
In real machines, for different reasons, the magnetic induction waveforms in the air gap are not
perfectly sinusoidal. Thus, the odd harmonics of the electrical fundamental are generally found in the
frequency spectrum of the air gap induction waveform, of the current or of the external magnetic field
(which is usually always detected). In the approach of the spectral contents analysis context, another
way to evaluate distortions due to fault is by means of numerical simulation using field computation
softwares based on Finite Elements method (FEM). With this tool, it is possible to analyze ideal
healthy machine or faulty machine by adding asymmetries for example. In this section, simulation
results using software EFCAD developed by GRUCAD (Grupo de Concepção e Análise de
Dispositivos Eletromagnéticos) of the Federal University of Santa Catarina are presented. Some of
these results have been already published in [10]-[12] and are presented again here for didactical
purposes. An 8 salient poles and a 2 cylindrical poles synchronous generators both assembled on the
same bench (Fig. 3) are analyzed by FEM. The generators are 10 kVA, 380 Volts three-phase wye
connected stator and are able to operate at 50 Hz and 60 Hz frequencies. A DC motor is used as prime
mover for both generators.
Fig. 3. Experimental testbench.
The results have been obtained for the generator rotating at 3000 rpm (50 Hz). The studied fault
consists on the reducing the active turns in one of the rotor pole. Figure 4 shows the calculated sensor
voltages in air gap for the healthy and faulty operations at no-load. The differences between the
curves are indicated by the arrows. As known, the voltage waveform obtained by FEM has a square
shape with pulses due to the rotor winding distributions and slots. For healthy case, the positive and
the negative half cycles have the same shape, resulting only spectral components with the
fundamental and only odd harmonics, as shown in Fig. 5a. However, for the faulty case, the
waveforms do not present symmetry in a mechanical period. Then, even order harmonics appear as
shown in Fig. 5b. The induced voltage in the air gap sensor has no DC level.
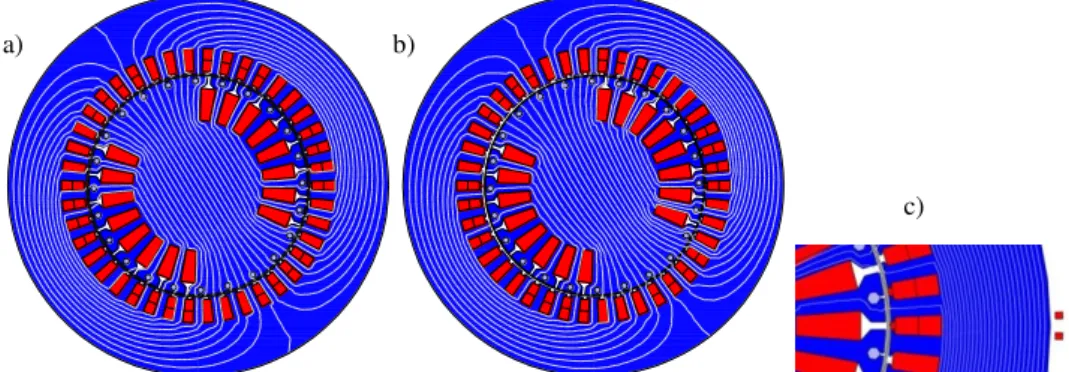
Figure 6 shows the 2D machine calculation domain with the flux distribution at no-load for the
analysis of the rotor eccentricity. The voltage waveforms are obtained with an external coil sensor
(Fig. 6c). Figure 6.a and Fig. 6b show the field map of the machine without and with eccentricity
respectively. Note that with eccentricity, the flux lines are no longer homogeneous and they are more
concentrated in the right side of the machine where the air gap is smaller. Figure 7 presents the
calculated waveforms of the external sensors at the left side (Fig. 7a) and at the right side (Fig. 7b) as
function of time. Figure 8 shows their respective FFTs. It can be observed that for this case, although
the calculated waveforms are different (in amplitude and shape), the FFTs are similar.
Fig. 4. Calculated sensor voltage waveforms in the air gap: dotted line for the healthy rotor and continuous line for the faulty field winding.
Fig. 5. Frequencies spectrum for (a) the healthy rotor and (b) for the faulty rotor. The components amplitudes in dBV are relative to the electrical fundamental amplitude.
Volts
Time[s] Volts
Time[s]
Fig. 6. Field maps of the machine (a) No eccentricity, (b) with eccentricity, (c) external sensor position detail.
Fig. 7. Induced voltage on the external sensor (a) left side and (b) right side of the machine of Fig. 6.
Fig. 8. Frequencies spectrum for (a) external sensor and (b) the right side of the machine signals.
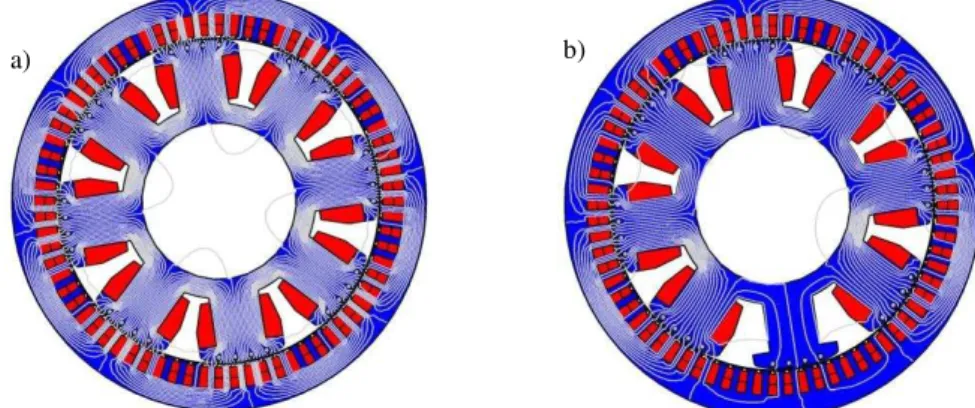
The 8 poles generator operating at no-load, rated voltage and at 50 Hz frequency is also simulated
by FEM. A healthy machine and a faulty one with a no fed pole are studied. The induced voltage
waveform of a fixed coil sensor in the air gap is analyzed. The field maps are presented in Fig. 9 for
cases (a) healthy machine and (b) faulty machine. Figure 10 presents the sensor induced voltage in the
air gap for case (a) and case (b). It can be observed that for the healthy machine the waveforms are
symmetric, but they do not have a sinusoidal shape (Fig. 10a). As expected for healthy machine, Fig.
11 shows its FFT where the electrical fundamental and its odd harmonics are observed. However, the
mechanical fundamental (12.5 Hz) and its harmonics cannot be seen. Nevertheless, adding a fault, one
of the four electrical periods change so that half mechanical period is not symmetric. Thus, the
mechanical fundamental frequency of 12.5 Hz and its even and odd harmonics components become
part of the frequencies spectrum shown in Fig. 12. This behavior is also predicted by equation (1) for
a sinusoidal waveform.
a) b)
c)
a) b)
Fig. 9. Fields Map of 8 poles generator simulated by FEM: (a) Healthy and (b) fault in one of the poles.
Fig. 10. Voltage of the sensor placed in the air gap of the 8 poles generator (a) healthy (b) faulty.
Fig. 11. Sensor voltage frequency spectrum in the air gap for the healthy machine.
Fig. 12. Sensor voltage frequency spectrum in the air gap for the faulty machine.
It can be observed that there is no DC component in the FFT obtained from the FEM simulation
results because the used sensor (voltage coil sensor) is not able to measure DC magnetic flux
components. Simulation and analysis by FEM provide the validation of the theoretical approach
because it is possible to observe the pure effect of a fault insertion. It also helps to clarify the
frequency spectrum obtained from a real machine as will be shown.
III. DEVELOPED EQUIPMENT AND ITS IMPLEMENTATION
The experimental strategy on using external fields in synchronous generator has some similarity
with the patent requested by General Electric Company in the United States of America [23]. It claims
that they use non-invasive method to measure external electromagnetic quantities. However, between
b)
b) a)
our work and theirs there are differences and a relevant one is the fact that we use the magnetic field
derivative.
The developed and implemented equipment is at the first version, considering its
application/implementation strategy, hardware and software development. Its implementation on
power plants must be quick with a minimum intervention inside de generator units. To speed up the
hardware development, a commercial processing system is used. This processing system, named
CompactRIO, is commercialized by National Instruments Company. It is composed by a physical
processor combined with a FPGA processor. They together provide nearly a complete solution for the
acquisition and for the analog as well as digital signal processing. This system is a part of the called
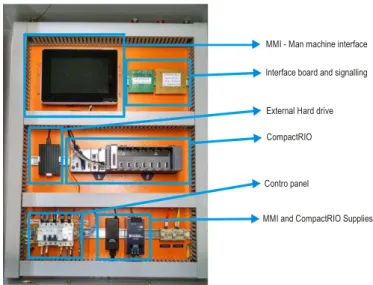
“Central Processing –CP”. In Fig. 13, a photograph of the internal part of the CP is presented. The CP is the main component of the system and it is where the CompactRio is placed. The CP: i) manages all
the acquisition processing, ii) obtains the magnetic signatures, which are the frequency spectrum from
signal decomposition by FFT, iii) performs the analysis of frequency components behavior and iv)
records and saves the data.
The assignments of the software is based on the theoretical study presented previously. Thus, in the
CP, communication function softwares, named Monitoring Unit (MU), are employed to treat and
analyze magnetic field signals, as well as to perform data backup. Graphic programming tool as
LabVIEW by National Instruments Company is used for the software development. This environment
is employed for the main software programming and it is implemented in the central processing unit
of CompactRio.
Fig. 13. Internal view of the central processor installed in UHE Itá.
Electronic circuits set for measuring the analogic signal of the magnetic field waveform (and/or its
time derivative) and its conditioning, as well as digital circuit with A/D converter for optical fiber
transmission are developed. The sensor delivers naturally waveforms proportional to the magnetic
field derivative, which is used for the spectral analysis. The sensors used in the machine
measurements are implemented in the “Monitoring Unit-MU”. In UHE Itá, the MUs are placed in the MMI - Man machine interface
External Hard drive
CompactRIO
Contro panel
housing of the generator, in the opposite wall of the generator and at distance reaching until 40 m
from the CompactRIO processing system. To maintain the measured signals integrity and for
electromagnetic immunity, optical fiber cable is used in this first version of the equipment. In MUs,
the PIC18F4525 microcontroller was chosen. Its programming is developed in C language. The
microcontroller is responsible for the MU processing and performs the commands of the CP arriving
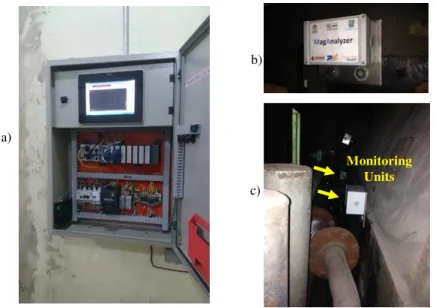
from the optical fiber. Two MUs are installed near the frame of a 2 poles generator unit of CTJL as
shown in Fig. 14. For similarity and presentation aspects, only the system installed in a 56 poles
generators unit of UHE Itá is treated in this paper.
Fig. 14. (a) Processing Unit, (b) MU and (c) the two MUs installed on the yoke of the generator at CTJL.
The MUs are series connected by optical fiber. The series connected system allows using only a
pair of optical fiber through a conduit from the first MU until the last one providing ease of
installation and material savings. Although it reduces the reliability of the system (a failure of one MU
leads to failure of the system), this strategy has been chosen in order to simplify its installation but can
be changed and improved in future. Figure 15 shows the physical configuration at UHE Itá.
M onitoring Unit M o n ito ri n g U n it M o n it o ri n g U n it M on ito ri
ng tniU Mon
itorin g Unit
Mo nito rin g Un it Processing unit
Supply and optical fiber cable
Generator
Frame
Internal wall
External wall
Fig. 15. Ilustration of the developed system and physical configuration of the installation at UHE Itá.
a)
b)
c)
The developed equipment uses induction coil sensors, amplifiers and digital circuits, similar to the
mobile monitoring equipment described in [10] and [11]. The induction coil sensor is the main
sensing component used in the system. It is a component capable of converting varying magnetic field
to voltage signal v(t)coil, which is the mirror of the time derivative of magnetic field, as given by (5).
� ����= −�0� ��� (5)
where, μ0 is the air magnetic permeability, N the number of turns, S the cross section of the sensor. Equation (5) relates the induced voltage v(t)coil on the coil sensor terminals with the time derivative of
the magnetic field H [10]. It is based on the Faraday’s law and it is not able to measure continuous field. This sensor is basically an air coil (see Fig. 16) and can operate from lower than 1 Hz to several
hundred of MHz, depending on its construction characteristics. The implemented sensor passband
goes from 0.5 Hz to 10 kHz. As given by (5), the coil sensor delivers a time derivative signal of the
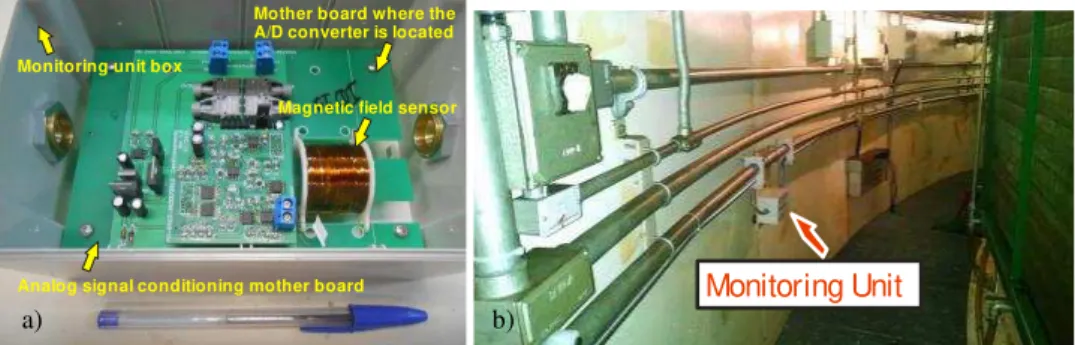
magnetic field multiplied by a scale factor (-μ0NS). For this sensor this scale factor is equal to 457 pHm. Figure 16 presents one of the Monitoring Units internal part and its installation on the wall of
one of the UHE Itá units. It is realized on the way that the coil sensor axe is horizontal.
Monitoring unit box
Mother board where the A/D converter is located
Magnetic field sensor
Analog signal conditioning mother board
Fig. 16. Monitoring Unit: (a) Internal part with the implemented coil sensor detail and other relevant components (b) one MU
The instrumentation amplifier INA118 is the main component of the coil sensor signal amplifier
and it is located inside the MU. Fig. 17 displays the flux diagram of the analogic signal conditioning.
The instrumentation amplifier INA118 receives a pre-amplified signal from the sensor and provides a
gain for the signal according to resistance value Rg (see Fig. 17). This resistance Rg is a parallel
combination of 8 resistances network commutated by analogic switches controlled by a
microcontroller of the MU according to the voltage signal level. A suitable gain is then produced to
take benefit of the maximum resolution band of the A/D converter. After this treatment, the signal is
converted in a totally differential signal by an operational amplifier and conditioned by a total
differential lowpass filter having a cutoff frequency of 4.7 kHz.
Monitoring Unit
Fig. 17. Flux diagram of the analogical signal conditioning.
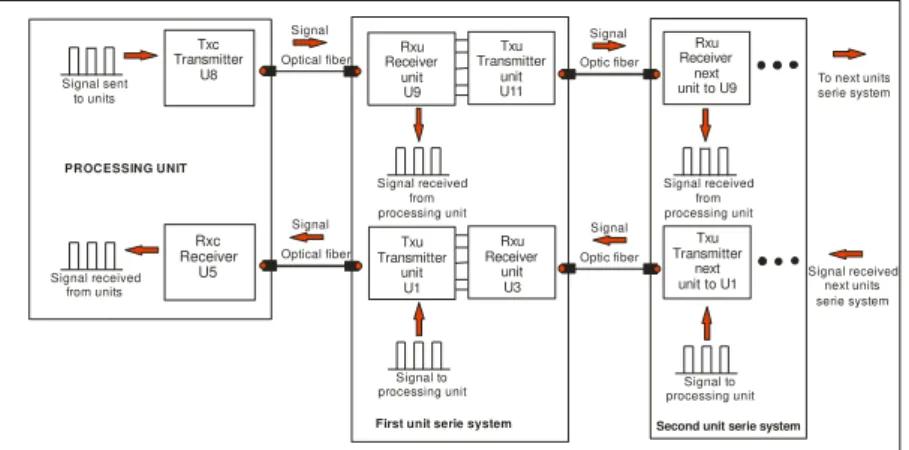
The diagram in Fig. 18 presents the summary of the data transmission and control scheme. In each
channel, there are two lines composed by a pair of optical fiber where one line is for transmission and
the other for reception (under the reference of the CP). Then, there is an unidirectional data flow from
CP to the MUs (TXc-RXu) and data flow from MUs to CP (RXc-TXu). The communication line
RXc-TXu (from 250 to 300 kBytes/s) has a higher transmission rate compared to line (TXc-RXu),
because it is necessary to transmit the digitalized waveforms of the treated analogic signal from the
MUs to the CP. The TXc-RXu line has a rate of a few bytes/s (from 500 to 1000 bytes/s) because it is
used only to transmit command signal from CP to the MUs.
Fig. 18. Block diagram of the series communication by optical fiber.
The developed equipment is first tested and validated in laboratory before its installation in power
plants. In the next section, some experimental results performed in laboratory are presented.
IV. EQUIPMENT TESTS IN LABORATORY
It is not possible to validate the equipment operating in the power plant because faults should be
induced and this is infeasible. Consequently, tests of the equipment are performed in laboratory for
monitoring faults using a testbench machine where faults can be deliberately inserted (Fig. 3).
A. Test on a two poles generator
Firstly, experimental results carried out with the two poles generator are discussed. The studied U2 Resistances Network Sensor Pré-Amplifier U3 INA118
U4 Op1177U5
Amplified and no filtered single-ended signal
Amplified and no filtered differential signal
Output: Amplified and filtered differential signal
U6 e U7 (OPA1632) Low-pass filter (Fc = 4.7 kHz)
Rg
Gain: 3.3V/V
Resulting resistance - Rg
Signal sent to units Signal received from units Optical fiber Optical fiber Optic fiber Optic fiber Signal received from processing unit Signal received from processing unit
To next units serie system
Signal received next units serie system
Signal to
processing unit processing unitSignal to
Rxc Receiver U5 Rxu U9 Receiver unit Txc Transmitter U8 Txu Transmitter unit U1 Rxu Receiver next unit to U9
Txu Transmitter
next unit to U1 Txu U11 Transmitter unit Rxu Receiver unit U3 Signal Signal Signal Signal
First unit serie system PROCESSING UNIT
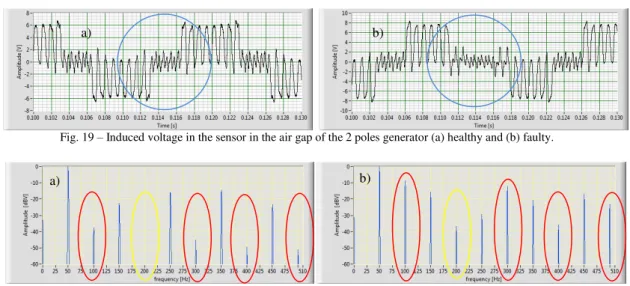
fault is the variation of the number of turns in one of the poles. The generator operates at no-load, 50
Hz and at rated voltage. Fig. 19a and 19b present respectively the induced voltage waveforms of the
healthy and faulty machine. In this case, the faulty machine consists on considering only 50% of the
active turns in one of the poles. It can be observed that for the healthy machine, there are 8 pulses per
half period (related to the number of slots per pole, 8 in this case). In the faulty machine case, there
are 6 pulses per half period. Fig. 20a and Fig.20b show, respectively, their FFT amplitudes with
respect to the fundamental. As the real machine presents small geometric inaccuracies including
eccentricities, non-homogeneous windings and magnetic anisotropy in the core, even harmonics can
be found also for healthy generator. The electrical and mechanical spectral contents are the same
because the machine has two poles. It can be noticed that for the healthy machine (Fig. 20a), the 2nd
harmonics amplitude has not a significant value. However, for the faulty machine, the 2nd harmonic
relative amplitude is equal to -36 dBV. In this analyzed frequencies band, the even contents of the
frequencies spectrum present larger amplitude variation with the fault insertion. This can be deduced
comparing Fig. 20a with Fig. 20b. Though the sensor do not measure DC component, the
experimental frequencies spectrum presents a DC level (null frequency component) due to noises,
electronic circuits and D/A conversion processing imperfection.
Fig. 19 – Induced voltage in the sensor in the air gap of the 2 poles generator (a) healthy and (b) faulty.
Fig. 20. Frequency spectrum of the induced voltage in the sensor in the air gap of the 2 poles generator (a) healthy and (b) faulty.
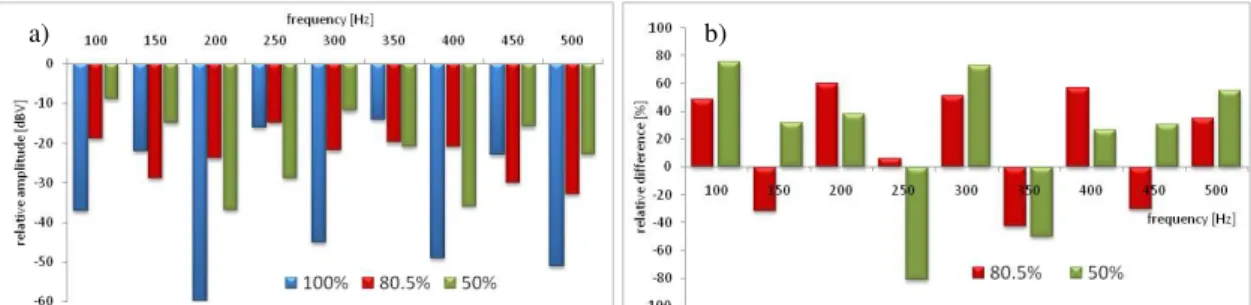
The next result, already presented in [12], concerns tests conducted in order to investigate the
behavior of the frequency components amplitudes regarding the increase of the fault severity degree
for 100% (healthy condition), 80.5% and 50% of the turns of one pole. Figure 21 presents (a) the
amplitude of the frequency components with respect to the fundamental and (b) the relative variation
of harmonic components amplitudes with respect to the corresponding values for the healthy machine.
The amplitudes of the 2nd, 6th and 10th harmonics increase accordingly to the severity of the fault. On
the other hand, the 4th and 8th harmonics behave in an inverse manner but, compared to the healthy
case, they are always higher.
a)
a) b)
Fig. 21. (a) Amplitude of the frequency components with respect to the fundamental one for 100%, 80.5% and 50% of turns in one pole. (b) Relative variation of harmonic component amplitudes with respect to the corresponding values of healthy machine.
The next fault test concerns the eccentricity test. It consists on inserting a static displacement of the
rotor shaft at 25% of its nominal value. The nominal value of the air gap length of this generator is
2mm. The generator operates at its nominal voltage and at 50 Hz. The measurement is performed
using sensors placed in the air gap and externally of the generator. Fig. 22 shows the relative
differences between the cases with and without displacement of the rotor shaft. For this kind of fault
and for the studied frequency, the amplitude changes are much smaller than in the previous case.
Fig. 22. Relative variation of harmonic component amplitudes with respect to the corresponding value without eccentricity.
B. Tests on eight poles generator
Tests are also performed on the eight poles generator. The first analyzed experimental result
concerns the healthy generator operating at no-load, rated voltage and 60 Hz. Fig. 23 presents the
frequency spectrum with respect to the electrical fundamental measured with sensors located in the air
gap and externally. As discussed previously, due to little imperfections in the real machine,
mechanical fundamental (15 Hz) and its harmonic components (30 Hz, 45 Hz,...) appear. The
frequency components lower than 60 Hz are called sub-harmonics and those not multiple of 60 Hz are
called inter-harmonics [24]. The frequencies spectrum of Fig. 23 have practically the same contents
except for the amplitudes and the noise level. These two signals have been measured using the
developed equipment. As expected, the noise level inside the generator is lower.
Fig. 23. Frequencies spectrum of the sensor induced voltage in the air gap and externally for the healthy 8 poles generator operating at 60Hz.
With the generator operating at 60 Hz, rated voltage and no-load, the studied fault consists on short
circuiting the turns of one of the poles. This study starts with the amplitudes monitoring of the healthy
machine and then putting sequentially in short circuit 20%, 50% and 100% of the pole excitation
turns. Fig. 24 shows the evolution of the sub-harmonics amplitudes (mechanical fundamental and its
harmonics) with respect to electrical fundamental as a function of fault severity. Note that with no
excitation of one of the poles (100% of the turns short circuited), the amplitude of the mechanical
fundamental has the same amplitude of the electrical fundamental one. The methodology of faults
detection by external field showed a good sensibility to this type of fault.
Fig. 24 Evolution of the mechanical fundamental and sub-harmonics amplitudes as a function of the fault severity.
One of the incipient faults in electrical machine is the local sheet short circuit in the stator. In the
testbench, this fault is performed by short circuiting part of the stator core through a conductor
embracing part of the sheets. This fault is applied to the 8 poles generator operating at 50 Hz and with
50% of the nominal resistive load. The amplitude of the monitored component is presented in the next
figures in dBV with respect to 1 V.
The evolution of the amplitude is monitored for 862.5 Hz, which corresponds to the 69th mechanical
harmonic. For this generator, this component of the magnetic signature is the one with the higher
sensibility (amplitude variation) for this type of fault. Fig. 25 shows the evolution of the amplitude for
the 862.5 Hz component, as a function of measurements along the time with the fault imposition.
With this fault, the amplitude of the frequency component increases in 8 dB. It is known that this kind
Fig. 25. Evolution of the 862.5 Hz component amplitude as a function of measurements along the time.
The behavior of the 862.5 Hz harmonic is also analyzed for other fault types. In all these faults, the
8 poles generator is operating at rated voltage, 50 Hz and with a resistive load of 70% of its nominal
value. The incipient faults inserted are: i) short circuit of 10% of one of the stator phases windings
turns through a resistor limiting the value of the short circuit current to 7% of its nominal value, ii)
short circuit of the sheets (a part of the stator core) and iii) short circuit of part of the stator phase and
the sheets simultaneously. Fig. 26 shows the components amplitudes evolution as a function of
measurements along the time with and without imposed faults. For all incipient defaults, the
equipment detected the fault with alterations of the 862.5 Hz component frequency amplitude.
However, when the faults are inserted simultaneously, the amplitude modification does not result on a
distinct variation compared to the case where only the stator sheets are short circuited. The severity of
the stator phase short circuit is relatively low, with only 7% of its nominal value. These results show
the necessity of the evaluation of other frequency components simultaneously using, for instance, an
artificial intelligence program or other techniques.
Fig. 25. Evolution of the 862.5 Hz frequency component amplitude as function of measurements along the time for the 8 poles generator operating at 70% of its nominal load, rated voltage and 50 Hz.
V. MAGNETIC SIGNATURES EXAMPLES OF THE EQUIPMENT INSTALLED IN A POWER PLANT
The equipment is installed in a generator unit of UHE Itá (See Fig. 16b). This unit is a 295 MVA
hydrogenerator with 56 poles operating at the Brazilian commercial frequency of 60 Hz. Thus, the
mechanical fundamental frequency is equal to 2.1428 Hz. Figure 26 shows the magnetic signatures of
the machine up to 200 Hz, with the frequency components amplitudes in dB with respect to 1 V. As it
can be verified, the mechanical fundamental amplitude is nearly 50 dB lower than the electrical
fundamental one. Even though, these amplitudes are expressive regarding to the background noise
average amplitude, which is around -145 dB with respect to 1 V. The field electrical fundamental
amplitude is around 60 A/m in RMS value at the same position of the sensor (see Fig. 16b). So the
mechanical fundamental is approximately 0.19 A/m. The magnetic signature is rich on informations,
showing that the developed equipment presents sensibility to low level components. Thus, a possible
incipient fault will be certainly detected by the equipment. Figure 27 presents the magnetic signatures
spectrum up to 3 kHz. It can be noticed that harmonics components higher than 1 kHz have
amplitudes lower than -130 dBV with respect to 1 V and they can be sensitive to the rotor speed
variations. For example, a speed increase of 1 rpm shifts the 500th harmonic of the mechanical
fundamental from 1071.43 Hz to 1079.77 Hz (8.34 Hz increase). This fact shows that for little
variations of the rotor speed (which is usual), the equipment should be developed with high spectral
resolution and with an efficient algorithm for frequency tracking.
Fig. 26. Magnetic signature spectrum of the generator of UHE Itá up to 200 Hz.
Some operation variation events of the generator of UHE Itá have been recorded in order to show
the sensibility of the equipment for external magnetic field alterations and also for the equipment
performance on detecting magnetic signatures modifications. Figure 28 presents the
behavior/alteration of the mechanical fundamental amplitudes and its 2nd harmonic (4.28 Hz) for a
change of the machine operation point. It occurred at seven 7:06 o’clock on November 12th 2015. In that day the machine excitation was changed.
Fig. 28. Mechanical fundamental (black color) and 4.28 Hz harmonic (red color) monitoring during the generator excitation alteration in
UHE Itá .
VI. CONCLUSION
Usually, fault detection studies in electrical machines are treated with measurements in laboratory
scale or with numerical simulations. This paper’s goal is to report and describe the operation of the developed equipment in power plants for monitoring external magnetic field variations. One of these
equipments is installed in a hydroelectric power plant and the other one in a thermoelectric plant. The
implemented system provides technical and scientific studies about the behavior of the external
magnetic field of large generator, with high number of poles (hydroelectric plant) or with 2 poles
(thermoelectric plant), both synchronized to the electric system. It is not possible to test directly the
equipment in power plants. It is not practicable and it is dangerous to insert or induce faults
deliberately in real plant generators. Thus, the tests were carried on a specially constructed testbench
where incipient faults can be handled in a relatively simple way. The measured results show that the
equipment was able to detect the inserted faults with success. Others type of faults have been studied
and they are also detected by the equipment [10], [11]. The experimental studies on the testbench
generators were validated by results obtained by numerical simulation using FEM. Some studies still
have to be carried out for a better understanding the magnetic signatures perturbations caused by
several types of faults, alone or simultaneously, considering also the load. At the same time, it will be
required the future development of artificial intelligence tools to assist the diagnosis of the faults in
This fault detection methodology, based on the magnetic field derivative, is the main contribution
of this paper. The results already obtained are effective and the technology was applied on real power
plants. The upcoming developments will improve this promising methodology and we are working on
the corresponding implementations.
ACKNOWLEDGMENT
This work was supported by CNPq and an agreement among the GRUCAD/EEL/CTC/UFSC,
ENGIE Brasil Energia and ITASA regulated by ANEEL (PD-0403-0033/2012).
REFERENCES
[1] D. Howe and P. Hammond, “Examination of the axial flux in stator cores with particular reference to turbogenerators,” IEE Proceedings, vol. 121, no. 12, 1974.
[2] P. Tavner, P. Hammond, and J. Penman, “Contribution to the study of leakage fields at the ends of rotating electrical machines,” IEE Proceedings, vol. 125, no. 12, 1978.
[3] A. Anderson, T. Bedfrod, and A. Craddock, “Transient leakage flux in small universal motors,” IEE Proceedings, vol. 128, no. 5, 1981.
[4] B. Belhoucine, A. Foggia, G. Meunier, M. Besseau, and H. Kermorgant, “3d finite element investigation of the magnetic field outside electromagnetic devices,” IEEE Transactions on Magnetics, vol. 30, no. 5, 1994.
[5] G. Kliman, R. Koegl, J. Stein, R. D. Endicott, and M. W. Mad-den, “Noninvasive detection of broken rotor bars in operating induction motors,” IEEE Transactions on Energy Conversion, vol. 3, no. 4, 1988.
[6] V. P. Bui, O. Chadebec, L.-L. Rouve, J.-L. Coulomb, "Noninvasive Fault Monitoring of Electrical Machines by Solving the Steady-State Magnetic Inverse Problem", IEEE Transactions On Magnetics, Vol. 44, No. 6, pp. 1050 - 1053, 2008 [7] M. V. Chari, S. R. Salem, S. Salon, and O.-M. Kwon, “Us 2009/0243647 a1 - non-invasive monitoring and diagnosis of
electric machines by measuring external flux density,” General Electric Company, 2009.
[8] D. Thailly, R. Romary, J.-P. Lecointe, J.-F. Brudny, and P. Suau, “Synchronous machine diagnosis using an external magnetic flux sensor,” International Conference on Electrical Machines- ICEM, Chania, 2006.
[9] J. P. A. Bastos, N. Sadowski, " Magnetic Materials and 3D Finite Element Modeling", CRC Press, 2014. ISBN 9781466592513.
[10] Mauricio Rigoni, Desenvolvimento de um Sistema de Detecção e Avaliação de Faltas em Geradores Síncronos por meio do Campo Magnético Externo, Doctoral Thesis, Universidade Federal de Santa Catarina, Florianópolis, 2014 (In Portuguese).
[11]Mauricio Rigoni et al., "Aparelho de Detecção de Faltas em Geradores Síncronos através do Campo Magnético Externo," in Citenel - Congresso de Inovação Tecnológica em Energia Elétrica, Costa do Sauípe - Bahia, 2015. (In Portuguese).
[12] H. F. dos Santos, N. Sadowski, N. J. Batistela, and J. P. A. Bastos, "Synchronous Generator Fault Investigation by Experimental and Finite Element Procedures," IEEE Transactions on Magnetics, vol. 52, no. 3, p. 4, 2015. [13]P. Neti, A. B. Dehkordi, and A. M. Gole, “A new robust method to detect rotor faults in salient-pole synchronous
machines using structural asymmetries”, IEEE Industry Applications Society Annual Meeting, Edmonton, 2008. [14]A. Ceban, R. Pusc, and R. Romary, “Study of rotor faults in induction motors using external magnetic field analysis,”
IEEE Transactions on Industrial Electronics, vol. 59, no. 5, 2012.
[15]D. R. Albright, “Interturn short-circuit detector for turbinegenerator rotor windings,” IEEE Transactions on Power Apparatus and Systems, vol. 90, no. 2, 1971.
[16]B. A. T. Iamamura, “Contribuição à detecção de defeitos nos rotores de turboalternadores,” Ph.D. dissertation, Universidade Federal de Santa Catarina, 2012.
[17]P. Neti and S. Nandi, “Stator interturn fault detection of synchronous machines using field current and rotor search-coil voltage signature analysis,” IEEE Transactions on Industry Applications, vol. 45, no. 3, 2009.
[18]A. Elez, S. Car, and Z. Maljkovic, “Detection of inter-coil short circuits in synchronous machine armature winding on the basis of analysis of machine magnetic field,” XIX International Conference on Electrical Machines - ICEM, Rome, 2010.
[19]D. R. Albright, D. J. Albright, and J. D. Albright, “Generator field winding shorted turn detection technology,” Avaliable: http://www.generatortech.com/, 2012.
[20]M. Sasic, S. Campbell, and B. Lloyd, “Flux monitoringimprovement,” IEEE Industry Applications Magazine, September 2011.
[21]G. Stone, M. Sasic, J. Stein, and C.Stinson, “Using magnetic flux monitoring to detect synchronous machine rotor winding shorts,” Pulp and Paper Industry Technical Conference (PPIC), Conference Record of 2012 Annual IEEE, June 2012.
[22]Q. Graham, “The m.m.f. wave of polyphase windings - with special reference to sub-synchronous hamonics,” Winter Convention of the A.I.E.E., 1927.