Abstract— A novel approach to design Multiple Function Antenna (MFA) arrays using Artificial Neural Networks is suggested. A planar array with uniform current excitations which can generate different beam widths and gains is designed using Artificial Neural Networks. The desired beam width, gain and number of elements are given as input to the neural network. The output of the neural network is the current excitations in the form ON/OFF state of the array. Radial Basis Function Neural Network (RBFNN) is initially trained with the input-output data pairs and tested. The network showed 98% high success rate.
Index Terms— Artificial Neural Network (ANN), Half power beam width (HPBW), Multiple Function Antenna (MFA), Radial Basis Function (RBF).
I. INTRODUCTION
Multifunctional antenna arrays have the potential to dramatically reduce the number and size of
array-based antenna systems on large platforms, improve system efficiency and decrease system cost
and weight. These have been developed with a range of functionalities and topologies. They also
enable functionality of numerous communication applications while maintaining small form factors.
Functional arrays are used for options of multiple beam widths, multifrequencies, multiple
polarizations and multiradiation patterns. Array antennas support the individual selection of
frequency and radiation characteristics in varying degrees [1]. Extreme examples can be found in
antenna apertures consisting of multiple connected sub-wavelength conductive regions. The most
critical point in the design is the choice of initial array (geometry and excitation).Recent work
involves in providing the better solution reaching an optimal trade-off between the characteristics like
lowering the side lobe level (SLL), narrowing the main lobe and reducing the elements or synthesize
the beam pattern to reproduce desired shape [2].
In this work, multiple functional array is used to generate multiple beam widths. Artificial Neural
Networks are implemented in designing a multiple function antenna array. RBFNN can be trained
with supervised and unsupervised learning and provides excellent results compared to MLPNN
(Multilayer Perceptron Neural Network) and HNN (Hopfield Neural Network). RBFNN neurons can
be trained faster than MLPNN because of its two stage training procedure. For better performance in
the form of high success rate, a Radial Basis Function algorithm is implemented in this paper. The
Design of Multiple Function Antenna Array
using Radial Basis Function Neural Network
Rama Sanjeeva Reddy.B, Vakula.D, Sarma.N.V.S.N
Research Scholar, Assistant Professor, Professor, Department of ECE, National Institute of Technology, India
input parameters of the network are directivity, number of elements, beam widths and the output
parameter of the network will be number of on and off elements of the array.
The conceptual barriers in implementation of MFA antennas are listed as (i) lack of deterministic
antenna design methodology that can deliver specified antenna functionality (ii) development of
switching and material properties that can enable reconfigurability (iii) lack of hard evidence that
shows significant system level performance benefits [3].
II. THEORY
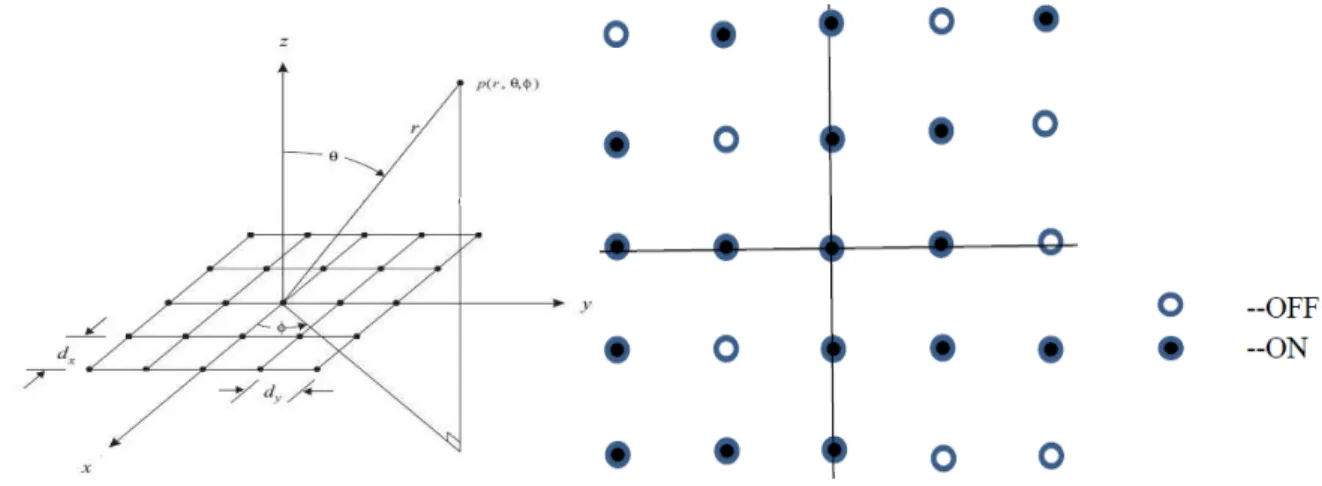
A planar array can be constructed by a linear array of M elements along the x axis, and then repeat
N such arrays along the y axis as shown in the Fig. 1a. In this way each element in the original
arrangement in x direction will be spaced by a distance dx and a progressive phase shift x [4] while in
the y direction each arrangement of element will have a separation of dy and progressive phase shift
y. This would be an array of rectangular grid type.
Fig. 1a. 5x5 planar antenna array rectangular grid. Fig. 1b. 17 “ON” elements and 8 “OFF” elements
The normalized array factor for the symmetric planar array elements in the array are either turned
on with an amplitude of 1Amp or turned off with an amplitude of 0 Amp can be written [5] as
1 1
sin [( ( ) cos ) ( ( ) sin ) )]
2 2
1 1
1
( , )
y
y x
x
x x y y
N
N N
N
jk m d n d
m n x y
A
e
N N
θ φ β φ β
θ φ
+ +
− + + − +
= =
=
(1)Where
N
x = number of rows of elements along X-axisy
N = number of columns of elements along Y-axis
θ
= angle of observation from array normal
φ
= angle with X-axisk
2
π
λ
=
= propagation constantdy= distance between elements along Y-axis
x & y=represents the phase excitation of the element along x and y axis respectively.
The main beam direction is controlled through the phase shifts ( x& y) and the array is designed
with the main beam perpendicular to the plane of the array, i.e., ( x= y=0). The beam width and side
lobe levels are controlled with taking in to account the non-uniform current excitations and applying
phase shifts. Antenna characteristics are determined by geometrical position of radiators, amplitude
and phase of their excitation [6]. High design efficiencies can be achieved with accurately predictable
radiation patterns and beam pointing directions. From the expression of radiation pattern, it is possible
to find position of principle maxima in visible space. The distance between elements decides the
number of grating lobes present in the visible range [7].
III. QUANTITATIVE DETAILS OF PLANAR ARRAYS
A. Relationship between number of elements and directivity of array
Uniform planar arrays are usually preferred in design of MFAs with a single aperture [8]. To relate
the directivity to the length of the array in closed form, it is easier to represent the uniform array with
a large number of elements as an aperture.
The maximum directivity in terms of number of elements in the row and column of an array is
represented as,
0 2
4 MN
D = (2)
Where M=number of elements in row and N=number of elements in column.
To maximize the directivity at the edge of = c of a given angular sector 00 c, the optimum
aperture dimension is chosen such that
c
2sin
M = (3)
The half power beam width along the =00 and =900 planes [9] varies inversely with the number of
elements along the plane. Fig. 1b gives the reference to 17 ON and 8 OFF elements chosen randomly.
B. Advantages of planar array for MFA
1. The choice of number of elements in planar array can overcome the barrier of re-configurability
for the need of integration of antenna which maintains high directivity [10].
2. For better desired beam width, the numbers of elements play a major role considering uniform
excitations. The element radiate directly in to space. Hence no situation of spillover lobes. The
polarization purity of the antenna is dependent only on the initial purity of the element
radiations.
3. The array and feeder network can be suitably configured to generate sum and difference
patterns for monopulse detection resulting in improved resolution.
IV. ARTIFICIAL NEURAL NETWORKS
Artificial Neural network is an application that alters certain variables in response to a set of
corresponding input and output patterns. Beginning with an initial set of internal values, the network
modifies these quantities in order to find a position of “best fit,” thereby generating from the input
patterns their expected results. The ability of these networks to generalize relationships between
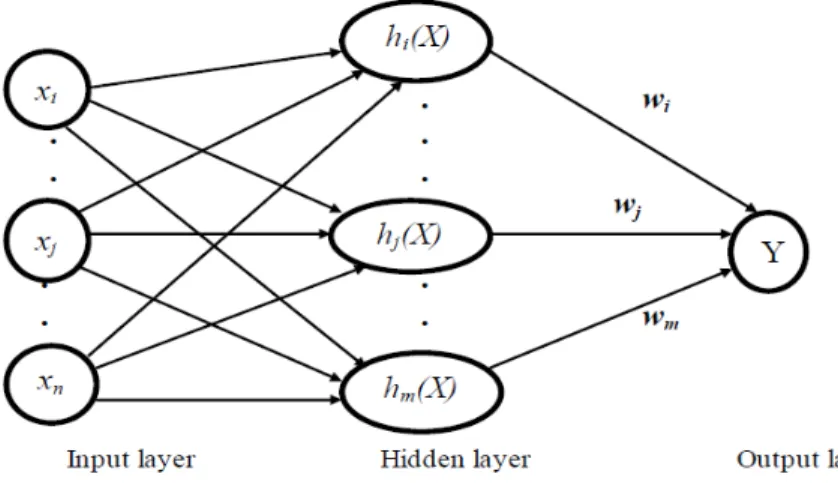
inputs and outputs is a key to their effectiveness. RBFNN typically have three layers of neurons,
namely input, hidden and output, which are fully interconnected as shown in Fig. 2. The first layer is
composed of input nodes [12]. A Radial Basis Function node function at each hidden node; the weight
vector from the input layer to a hidden node is identified to the location of the center of the RBF for
that node. Each neuron in the hidden layer operates at the Gaussian transfer function. RBF network
with a sufficiently large number of nodes can approximate any real multivariate continuous function
on a compact set.
Fig. 2. RBF network structure
Directivity, beam width and number of elements are considered as the input parameters for the
network and ON/OFF excitation values as the output of the network. The mean absolute percentage
error (MAPE) is calculated as given below, where n is number of time points, ytand yt'are actual
and predicted observations respectively.Proposed a set of different array synthesis techniques based
on NN with radial basis activation functions that addressed different methods of pattern specification
(amplitude only data). A deterministic pattern specification suitable for the MAPE criterion is given
by Eq. (4) and the network seeks to minimize the MAPE [13].
1
'
1
.100
n
t t
t t
y
y
MAPE
n
=y
−
=
(4)V. RESULTS AND DISCUSSIONS
Planar array of 5x5 structure is considered for validation. Radiation patterns are determined with
ON/OFF mode of number of switching elements. Radiation pattern is sampled at 180 intervals
between the angles of 0 to 180 degrees. Training set consists of the number of ON elements, gain and
the neural network. 25 data sets are considered for the network and out of which 20 sets of data
samples are taken for training and 5 random data sample sets are considered as testing sets. Testing
phase gives the predicted excitation values. Further the percentage of error is calculated, comparing
the actual values and predicted values.
Fig.3. represents the radiation pattern with a gain of (10.7908dB) using MATLAB simulation for
M=3 and N=4 array elements with ON condition.
Fig. 3. Radiation pattern for M=3 and N=4,”ON” elements in array
Fig. 4. Value of HPBW for M=3 and N=4,”ON” elements in array
Simulated value of half power beam width (8.49300) is shown in the Fig.4. Parameters of the planar
array are calculated with the assumed values of number of elements, inter element spacing between
elements and the current amplitudes as shown in the Table I.
Table I. Parameters of planar array used in MFA
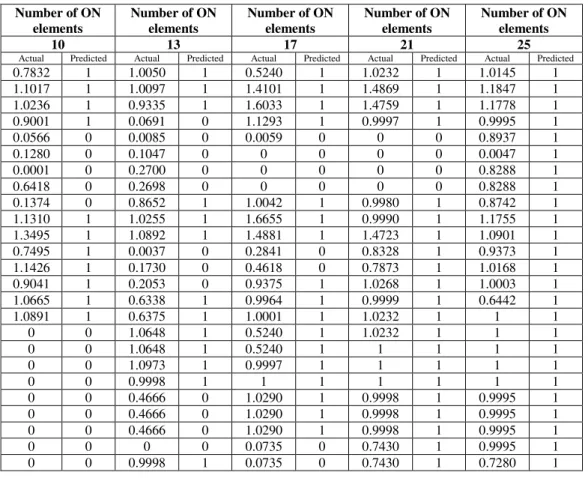
Table II. shows the actual and predicted excitation current values for the listed ON elements (13
and 21) in a planar array. The five sets (10, 13, 17, 21 and 25) are taken for testing phase out of the 25
trained sets for the neural network. Table III. below shows the calculation of mean absolute
percentage error, considering input and output pairs of parameters with the choice of number of
TABLE II. COMPARATIVE DATA VALUES OF EXCITATIONS FOR ON/OFF ELEMENTS IN 5X5 ARRAY
Fig. 5. Variation of curve for 13 “ON” elements in array using RBFNN
The calculation of the mean absolute percentage error is done with the error change between the
observed and expected parameters as shown in the Table III.
TABLE III. MEAN ABSOLUTE PERCENTAGE ERROR CALCULATION (MAPE)
Number of ON elements
Number of ON elements
Number of ON elements
Number of ON elements
Number of ON elements
10 13 17 21 25
Actual Predicted Actual Predicted Actual Predicted Actual Predicted Actual Predicted
0.7832 1 1.0050 1 0.5240 1 1.0232 1 1.0145 1
1.1017 1 1.0097 1 1.4101 1 1.4869 1 1.1847 1
1.0236 1 0.9335 1 1.6033 1 1.4759 1 1.1778 1
0.9001 1 0.0691 0 1.1293 1 0.9997 1 0.9995 1
0.0566 0 0.0085 0 0.0059 0 0 0 0.8937 1
0.1280 0 0.1047 0 0 0 0 0 0.0047 1
0.0001 0 0.2700 0 0 0 0 0 0.8288 1
0.6418 0 0.2698 0 0 0 0 0 0.8288 1
0.1374 0 0.8652 1 1.0042 1 0.9980 1 0.8742 1
1.1310 1 1.0255 1 1.6655 1 0.9990 1 1.1755 1
1.3495 1 1.0892 1 1.4881 1 1.4723 1 1.0901 1
0.7495 1 0.0037 0 0.2841 0 0.8328 1 0.9373 1
1.1426 1 0.1730 0 0.4618 0 0.7873 1 1.0168 1
0.9041 1 0.2053 0 0.9375 1 1.0268 1 1.0003 1
1.0665 1 0.6338 1 0.9964 1 0.9999 1 0.6442 1
1.0891 1 0.6375 1 1.0001 1 1.0232 1 1 1
0 0 1.0648 1 0.5240 1 1.0232 1 1 1
0 0 1.0648 1 0.5240 1 1 1 1 1
0 0 1.0973 1 0.9997 1 1 1 1 1
0 0 0.9998 1 1 1 1 1 1 1
0 0 0.4666 0 1.0290 1 0.9998 1 0.9995 1
0 0 0.4666 0 1.0290 1 0.9998 1 0.9995 1
0 0 0.4666 0 1.0290 1 0.9998 1 0.9995 1
0 0 0 0 0.0735 0 0.7430 1 0.9995 1
0 0 0.9998 1 0.0735 0 0.7430 1 0.7280 1
S.No Gain in dBi
Half power beam width
Number of “ON” elements
MAPE
1 9.9985 10.2090 10 1.232
2 11.138 7.83510 13 1.251
3 12.304 5.98320 17 1.222
4 13.222 4.84040 21 1.310
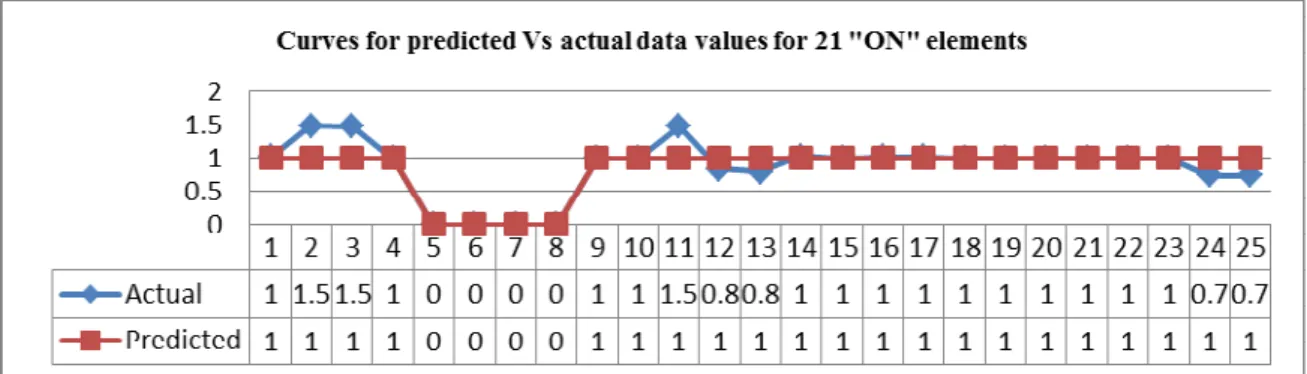
Fig. 6. Variation of curve for 21 “ON” elements in array using RBFNN
Fig. 5 shows the variation of curves for observed and predicted excitation current values for
13 “ON” elements in a planar array and mean absolute percentage error calculated is 1.251.
Fig. 6 gives the variation of curves for observed and predicted excitation current values for 21
“ON” elements in a planar array and mean absolute percentage error calculated is 1.310.
Hence the neural network shows 98% success rate.
CONCLUSION
In this paper, planar array with 5x5 elements is proposed with the switching ON/OFF
elements and well trained data values with the Radial Basis Function Neural Network
algorithm resulted in success rate of 98%. The main contribution of the paper describes the
optimum solution in effective usage of planar elements to achieve the multiple beam widths.
Radial Basis Function Neural Network is a feed forward network, trained using supervised
training algorithm. The weights in to the hidden layer are usually set before the second layer
of weights is adjusted and as the design belongs to the classification problem, RBFNN is
preferred. Additionally, the proposed method can be extended to bands,
multi-frequency operations of arrays used for advanced wireless technology applications.
REFERENCES
[1] Mak, A.C.K., C.R. Rowell, R.D. Murch, and C.L. Mak “Reconfigurable Multiband antenna designs for wireless communication devices,” IEEE Transactions on Antennas and Propagation, Vol. 55, pp1919-1928, 2007.
[2] Cetiner, B.A., H. Jafarkhani, Q. Jiang-Yuan, Y. Hui Jae, A. Grau, and F. De Flaviis, “Multifunctional reconfigurable MEMS integrated antennas for adaptive MIMO systems,” Communications Magazine, IEEE, Vol. 42, pp62-70, 2004.
[3] Timothy A. Axness, Robert V. Coffman, Bruce A. Kopp, and Kenneth W.O’ Haver, “Shared Aperture Technology Development”,
Johns Hopkins APL Technical Digest, Vol. 17, Number 3, 1996
[4] D.Vakula and NVSN.Sarma, “Using Neural Networks for fault detection in planar antenna arrays”, Progress in Electromagnetics Research Letters, Vol.14, 21-30, 2010.
[5] Z.N. Chen, Broadband Planar Antennas, Hoboken, NJ: John Wiley & Sons, 2006.
[6] Elliott,R.S., Antenna theory and Design, Revised edition, Hoboken, NJ: John Wiley & Sons, 2003
[7] B. Vedaprabhu and K. J. Vinoy, “An integrated wideband multifunctional antenna using a microstrip patch with two U-slots”,
Progress in Electromagnetics Research B, Vol. 22, 221-235, 2010.
[8] Randy L. Haupt, “Antenna Arrays-A computational approach,” Wiley, 2010, Chapter4, pp.230-236.
[9] R.Dahlstrom, S. Weiss, E. Viveiros, A. Bayba, E.Adler: “A Ka-Band Electronically Scanned Antenna for Multifunction RF Applications”; 2003, Available http://ww.ecs.umass.edu/ece/allerton/papers2003/2003-p360.pdf.
[10] W.F. Croswell, T. Durham, M. Jones, D. Schaubert, P. Friederich, and J. G. Maloney, Wideband arrays, in Modern Antenna Handbook, C.A. Balanis, ed., Hoboken, NJ: John Wiley & Sons, 2008, pp.581-630
[11] R.J.Mailloux, Phased Array Antenna Handbook, Artech House, Boston, 1994.
[12] Rafael G Ayestarán, Las Heras Fernando, Luis F Herrán. Neural modeling of mutual coupling for antenna array synthesis. IEEE Trans Antenna Propagation, 2007, 55, pp.832–40.