Brazilian Microwave and Optoelectronics Society-SBMO received 02 April 2012; for review 20 April 2012; accepted 28 Jan 2013 Brazilian Society of Electromagnetism-SBMag © 2013 SBMO/SBMag ISSN 2179-1074
Abstract— In this paper, we present a comparison between OFDM and STDCC sounding techniques used to wide band channel characterization in suburban environments at 3.5 GHz band. Measurements of the received signal’s power delay profile and power level for each of the sounding techniques were obtained. These experimental results are presented and compared. For this comparison, important wide band characterization information are obtained and the performances of each one of used techniques are observed.
Index Terms— Channel Characterization, OFDM Sounder, Power Delay Profile, STDCC Sounder, WiMAX.
I. INTRODUCTION
In last years the demand for broadband services has grown significantly. The people are enjoying
wireless internet access for telephony, radio and television services when they are in fixed, mobile or
nomadic conditions. The rapid growth of wireless internet causes a demand for high-speed access to
the World Wide Web. WiMAX (Worldwide Interoperability for Microwave Access) appears as a
potential technology to attend this demand. WiMAX has potential success in its line-of-sight (LOS)
and non line-of-sight (NLOS) conditions which operating below 11 GHz frequency. In Brazil,
WiMAX operate on licensed frequency of 3.5 GHz, where curiously few studies are found, which
makes a motivator for the work developed here.
As WiMAX, other technologies using the 3.5 GHz band has emerged in last years, therefore, the
study of performance of the electromagnetic waves propagation in this band becomes essential.
Furthermore, to implement designs and planning of WiMAX communication systems, the accurate
propagation characteristics of the environment should be known. Channel characterization is an
essential part of performance prediction for wireless communications systems. Two parameters are
important in propagation prediction: the large-scale path loss and small-scale fading statistics.
The large-scale effects determine a power level averaged over an area of tens or hundreds of
meters, therefore, the path-loss information is vital for the determination of coverage of a base-station
(BS) placement and in optimizing it.
The small-scale parameters usually provide statistical information on local field variations and this,
Comparison Between OFDM and STDCC
Mobile Channel Sounders at 3.5 GHz
Rogério M. L. Silva, Glaucio L. Siqueira, Leonardo H. Gonsioroski, Carlos Rodriguez Vinicio Ron
Centro de Estudos em Telecomunicações - PUC-Rio Rio de Janeiro, Brazil;
Brazilian Microwave and Optoelectronics Society-SBMO received 02 April 2012; for review 20 April 2012; accepted 28 Jan 2013 Brazilian Society of Electromagnetism-SBMag © 2013 SBMO/SBMag ISSN 2179-1074 in turn, leads to the calculation of important parameters that help improve receiver (Rx) designs and
combat the multipath fading [1].
The signal transmission in a typical mobile radio channel is affected by time-variant multipath
propagation and its statistic behavior can be estimated using appropriated sound techniques.
The waves in uplink direction impinging on receptor antenna aperture consist of a line-of-sight
(LOS) component and contributions from several non-LOS (NLOS) paths from different directions
and with different time delays, attenuations and phases that result from scattering, reflection or
diffraction. This causes frequency-selective fading. To determine optimum methods of mitigating the
impairments caused by multipath propagation, it is essential for the transmission channel to be
satisfactorily characterized.
The RMS delay spread is often used to characterize the quality of multipath fading channels. This
parameter should be closely related to the system performance. The RMS delay spread is meaningful
because is related to the frequency selectivity of a channel.
This work shows an important study of the multipath at the beginning of the SHF band.
Measurements for channel characterization in 3.5 GHz band was performed by means of two
sounding techniques: STDCC (Sweep Time Delay Cross Correlation) and OFDM (Orthogonal
Frequency Division Multiplexing).
The sounding techniques compared in this work have been widely used for mobile radio channel
characterization through the determination of time dispersion parameters like: mean delay, delay
spread and coherence bandwidth; and the frequency dispersion parameters like: mean Doppler shift,
Doppler spread and coherence time [7, 8, 10, 12]. Although these techniques are very used, their
results had not yet been compared for the same measurement environment. The STDCC is a time
domain sounding technique while the OFDM is a frequency domain sounding technique. This
difference has motivated the comparison proposed.
The organization of this paper is as follows. The two sounding techniques are summarized in
Section II. In Section III, we present the morphology and topology of the environment as well as the
characteristics of the equipment. In Sections IV and V, we present the transmitted and received signal
in each sounding technique respectively. Section VI shows the channel characterization of the each
sounding and its respective power delay profiles. Conclusions are drawn in Section VII.
II. SOUNDING TECHNIQUES
A. STDCC Channel Sounder
The STDCC (Sweep Time Delay Cross Correlation) is a pulse compression technique based on the
channel sounding using the property of the autocorrelation function of white noise. It is well known
Brazilian Microwave and Optoelectronics Society-SBMO received 02 April 2012; for review 20 April 2012; accepted 28 Jan 2013 Brazilian Society of Electromagnetism-SBMag © 2013 SBMO/SBMag ISSN 2179-1074
= ℎ ∗ = ℎ – (1)
And if crosscorrelated with a delayed replica of the input − then the resulting
crosscorrelation coefficient is proportional to the impulse response of the system ℎ evaluated at the
time delay .
∗ − = ℎ − ∗ − (2)
∗ − = ℎ − (3)
∗ − = ℎ (4)
As we see the impulse response of a linear system can be evaluated using white noise, and method
of correlation processing. However, in practice, it is unrealistic to generate white noise, therefore, is
used a m-sequence, alternatively known as pseudo-random binary sequences (PRBS) or pseudonoise
(PN) sequences, because possess excellent periodic autocorrelation properties [3], as illustrated in
Figure 1, which shows a normalized autocorrelation function.
STDCC pulse compression is done by correlating the received sequence with an identical
PN-sequence clocked at a slightly lower rate. The difference in chip rate is called slip rate, which is
defined as:
∆ = − (5)
The difference in chip rate results in different time bases between the transmitted and the received
sequences. The slower sequence (received sequence) will be aligned with the transmitted sequence
again after a duration:
!"#$%=∆1 (6)
The time domain representation, k gives us the scale factor, and it is defined as:
' = ∆ ≫ 1 (7)
the scale factor k is a measure of the bandwidth compression of the sounder technique adopted.
Fig. 1. Normalized autocorrelation function of PN-Sequence Erro! Fonte de referência não encontrada..
The STDCC technique originally proposed by Cox [4] is employed using a PN-sequence of m=511
bits and fTx=10MHz, generated using MATLAB software, and converting into an electrical signal
Brazilian Microwave and Optoelectronics Society-SBMO received 02 April 2012; for review 20 April 2012; accepted 28 Jan 2013 Brazilian Society of Electromagnetism-SBMag © 2013 SBMO/SBMag ISSN 2179-1074 problem of the PN-sequence is the dynamic range and the side lobes, to improve the performance of it
was decided to use the power amplifier and filtering in the sequence before passing it.
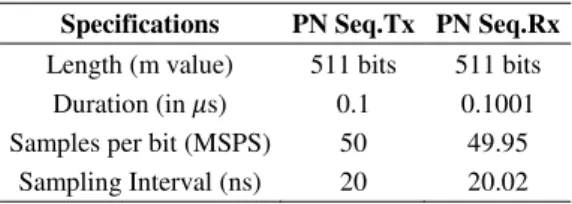
The characteristics of the PN-sequence used are shown in Table I. The rate difference between the
transmitter and receiver is 10KHz, therefore, the scale factor k is 1000.
TABLE I.SPECIFICATIONS PNSEQUENCE TX AND RX Specifications PN Seq.Tx PN Seq.Rx
Length (m value) 511 bits 511 bits Duration (in )s) 0.1 0.1001 Samples per bit (MSPS) 50 49.95
Sampling Interval (ns) 20 20.02
B. OFDM-Based Channel Sounder
Orthogonal frequency division multiplexing (OFDM) also known as multicarrier modulation,
incorporates a large number of orthogonally selected subcarriers to transmit a high-data rate stream in
parallel in the frequency domain, as shown in Figure 2. The multipath effect introduces inter-symbol
interference (ISI) that is significantly reduced in OFDM due the parallel data transmission through
multiple carriers. Spectral efficiency and multipath immunity are two major features of the OFDM
technique.
Fig. 2. Orthogonal Subcarriers OFDM signal.
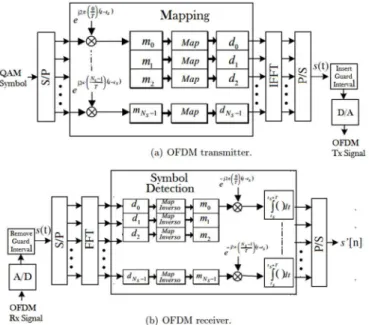
The Figure 3 shows a transmitter and receiver OFDM. We can observe in Figure 3.a that serial
QAM symbol is first converted to Ns parallel subcarriers that are buffering and mapping in Ns
complex subsymbols di which determine the points of the constellation of each subcarrier according to
each type of modulation used, then is applied a IFFT [5].
The mathematical expression for s(t) is defined as the following:
* = + , - $+./0$ 1 2
32 4
$5
6 , " ≤ ≤ "+ ! (8)
* = 0 , "+ ! ≤ ≤ "
where ! is the OFDM symbol time. The subcarrier spacing is defined as 1/! , which makes them
Brazilian Microwave and Optoelectronics Society-SBMO received 02 April 2012; for review 20 April 2012; accepted 28 Jan 2013 Brazilian Society of Electromagnetism-SBMag © 2013 SBMO/SBMag ISSN 2179-1074 (ISI). Two techniques are commonly used to represent this guard time: Cyclic Prefix or Zero-Padding.
The Cyclic Prefix removes the inter-symbol interference and intercarrier interference (ICI) [9].
With the addition of a Cyclic Prefix an OFDM system offers inherent robustness to multipath
dispersion with a low-complexity RX. The length of the Cyclic Prefix determines the amount of
multipath energy captured. Multipath energy not captured during the Cyclic Prefix window results in
ICI. Therefore, the Cyclic Prefix length needs to be chosen to minimize the impact due to ICI and
maximize the collected multipath energy, while keeping the overhead due to the Cyclic Prefix small.
Most conventional wireless OFDM-based systems use a Cyclic Prefix to provide robustness against
multipath. However, the same multipath robustness can be obtained by using a zero-padded (ZP)
prefix instead of the Cyclic Prefix.
The only modification that is required at the RX is to collect additional samples corresponding to
the length of the prefix and to use an overlap-and-add method to obtain the circular convolution
property [10].
Fig. 3. OFDM Transceiver Architecture.
The receiver performs the reverse operation to recover the signal, as shown in Figure 3.b. The
OFDM signal bandwidth is a function of the number of subcarriers as well as the subcarrier
bandwidth.
The OFDM-based sounder is employed using the MG3700A equipment of the Anritsu. The OFDM
signal was generated using MATLAB software, and converting into an electrical signal with
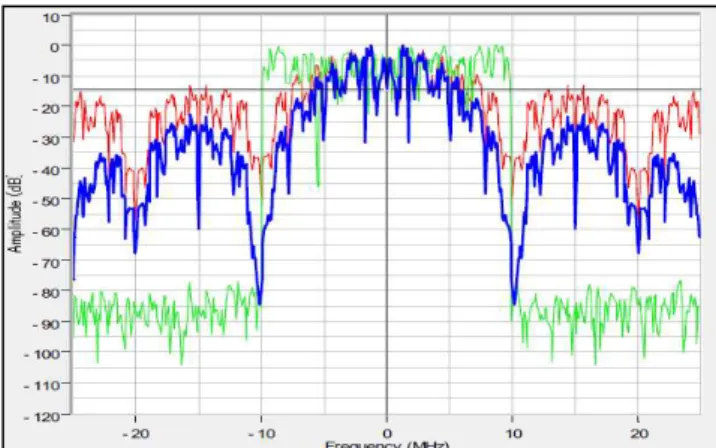
IQ-PRODUCER software. Figure 4 shows a comparison between OFDM, filtered PN-Sequence and
Brazilian Microwave and Optoelectronics Society-SBMO received 02 April 2012; for review 20 April 2012; accepted 28 Jan 2013 Brazilian Society of Electromagnetism-SBMag © 2013 SBMO/SBMag ISSN 2179-1074
Fig. 4. Comparison between OFDM (in green) , filtered PN-Sequence (in blue) and unfiltered PN-Sequence (in red) signals.
III. ENVIROMENT AND MEASUREMENT EQUIPMENT
A measurement campaign was performed in a residential area in Rio de Janeiro, Brazil. The
environment can be characterized as suburban. The transmitter is located at a fixed position at a height
of 33 m and frequency of 3.5GHz. The building chosen was Gama Filho University main building. A
measurement run was performed along four routes, as shown in Figure 5. Transmitting power was -10
dBm, the antenna gain was 15 dBi and power amplifier gain was 37.8 dB.
Fig. 5. Satellital view of the measurement environment and routes.
STDCC and OFDM sounders schemes use the same equipments, only change the signal generation
and post-processing software. For STDCC sounding technique, a PN-Sequence was generated and for
OFDM sounding technique, it was generated a random signal according section II.B. Both signals
were generated in MATLAB software and after that they were converted into an electrical signal with
IQ-PRODUCER software. The electrical signal is amplified and after that sent to the antenna to be
radiated in free space. For STDCC Sounder, it was used a Remez filter for reducing the sidelobes [5]
and thereby improving the dynamic range, thus achieving a better resolution of the sounder, it can be
seen in Figure 4.
The reception sounder consists of a signal analyzer Anritsu MS2781B, the antenna gain of 0 dBi
Brazilian Microwave and Optoelectronics Society-SBMO received 02 April 2012; for review 20 April 2012; accepted 28 Jan 2013 Brazilian Society of Electromagnetism-SBMag © 2013 SBMO/SBMag ISSN 2179-1074 Matlab. Figure 6 shows the transmitter and receiver scheme.
The characteristics of the sounders were adjusted to similar performance. OFDM Sounder used 512
subcarriers, while STDCC sounder used a PN-sequence of 511 bits. Thus, the same characteristics of
sounders were kept the same for comparison.
Fig. 6. Transmitter and Receiver Schemes.
IV. EXPERIMENTAL RESULTS
The channel characterization measurements discussed in this section were performed using a radio
channel sounding system that was described previously in Section III. This system operates at 3.5
GHz, has a maximum multipath resolution of 51.1 s and a minimum multipath resolution of 0.1 s
for both sounders.
The experiment was conducted using a single transmission antenna on the last floor (elevation
about 33 m) of Gama Filho University building and a mobile receiver traveling along of four routes at
mean speed of 40 km/h.
The data received were processed in MATLAB, the data acquisition was performed with 200 s
capture time at a rate of 50MHz, with a clock synchronized with GPS, thus generating a second GPS
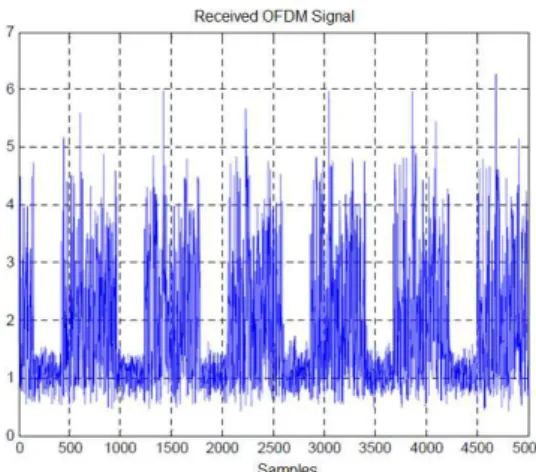
measurement and other data received. Figure 7 and 8 shows receiver signal by STDCC and OFDM
sounders respectively.
Brazilian Microwave and Optoelectronics Society-SBMO received 02 April 2012; for review 20 April 2012; accepted 28 Jan 2013 Brazilian Society of Electromagnetism-SBMag © 2013 SBMO/SBMag ISSN 2179-1074
Fig. 8. Receive random signal on the OFDM sounder.
Figure 7 shows a pseudorandom characteristic consistent with that expected for STDCC Sounder
and Figure 8 shows the OFDM signal, including the gap. It was inserted to facilitate synchronization
of OFDM sounder.
Power delay profiles were obtained in two different ways according to the selected sounder. For the
STDCC sounder the profile is obtained by the correlation between transmitted and received
PN-sequence. However, when using OFDM sounder, a random signal is transmitted using the technique
of cyclic prefix as guard time. Figures 9-14 show a comparison between examples of power delay
profiles with its respective multipath valid for each type of sounder and for each route.
When working with the measured power delay profiles to determine the dispersion parameters
channel, we must ensure stationary at least in small paths.
Power delay profiles are obtained after using the CFAR (Constant False Alarm) technique [6]. This
technique allows distinguishing between real components and multipath noise components of the
multipath. CFAR technique determines the noise by median and standard deviation of the power delay
profile to provide varying levels of noise. The noise floor is determined by the difference between
maximum peak and average plus standard deviation.
After determining the noise floor we have to evaluate: if a delay exceeds the noise floor, if the
delays before and after also exceed it. However, for the power profile is valid at least one of the
neighbors must satisfy the above condition. Figure 9 shows a profile measured on Route 1. The Route
1 is a route LOS typically urban. The values in Table II are consistent with obtained by Ron [7] and
Matos [8].
In figures 9.a, 10.a, 11.a, 12.a, 13.a and 14.a are shown three power delay profiles for each one
route. The color indicates the type of delay profile: the green, the delay profile captured; the red, the
profile before and the black the delay profile a posteriori. The technical of cleaner profile CFAR [6]
that it obliges us have information of the subsequent and previous delay profile. Figures 9.b, 10.b,
Brazilian Microwave and Optoelectronics Society-SBMO received 02 April 2012; for review 20 April 2012; accepted 28 Jan 2013 Brazilian Society of Electromagnetism-SBMag © 2013 SBMO/SBMag ISSN 2179-1074
Fig. 9. Comparison between OFDM Power Delay Profile with its respective multipath valid of Route 1 (d = 1.13 km): (a) OFDM Power Delay Profile; (b) OFDM multipath valid
Fig. 10. Comparison between STDCC Power Delay Profile with its respective multipath valid of Route 1 (d = 1.13 km): (a) STDCC Power Delay Profile; (b) STDCC multipath valid.
TABLE II. DISPERSION OF THE CHANNEL PARAMETERS TO ROUTE1
Route 2 is NLOS. The profiles are illustrated in Figure 11, the values of mean spread and RMS
delay spread are shown in Table III. We note that the OFDM sounder did not show any results in the
LOS case.
PN OFDM
RMS RMS
Delay Spread Delay Spread
1 0,1028µs 0,1778µs 0,149µs 0,086µs NLOS 1,13km -55,65dBm -53,18dBm
1 0,0448µs 0,1120µs - - NLOS 1,13km -55,68dBm -51,51dBm
1 0µs 0µs - - NLOS 1,2km -55,20dBm -50,29dBm
1 0,0886µs 0,1559µs 0,2607µs 0,0488µs NLOS 1,09km -57,76dBm -56,37dBm
1 0µs 0µs 0µs 0µs LOS 1,03km -52,69dBm -53,02dBm
Receive Pow er
Receive Pow er
Routes Distância
Tx e Rx Line of
Sight STDCC OFDM
Mean Spread
Brazilian Microwave and Optoelectronics Society-SBMO received 02 April 2012; for review 20 April 2012; accepted 28 Jan 2013 Brazilian Society of Electromagnetism-SBMag © 2013 SBMO/SBMag ISSN 2179-1074
Fig. 11. Comparison between STDCC Power Delay Profile with its respective multipath valid of Route 2 (d = 2.69 km): (a) STDCC Power Delay Profile; (b) STDCC multipath valid.
TABLE III. DISPERSION OF THE CHANNEL PARAMETERS TO ROUTE 2
The Route 3 begins NLOS at Amaro Cavalcanti Avenue passing below the Yellow Line and
entering LOS with the transmitter on the Manoel Vitorino Street. Figures 12 and 13 present the power
delay profile with its respective values of mean spread and RMS delay spread presented by Table IV.
Fig. 12. Comparison between OFDM Power Delay Profile with its respective multipath valid of Route 3 (d = 1.25 km): (a) OFDM Power Delay Profile; (b) OFDM multipath valid.
PN OFDM
RMS RMS
Delay Spread Delay Spread
2 0,1570µs 0,1809µs - - NLOS 2,69km -66,72dBm -66,82dBm 2 0,0962µs 0,1156µs - - NLOS 2,69km -66,77dBm -66,83dBm
2 0,0984µs 0,1241µs - - NLOS 2,69km -66,76dBm -66,83dBm
2 0,1778µs 0,2268µs - - NLOS 2,69km -66,63dBm -66,88dBm
2 0,0914µs 0,1252µs - - NLOS 2,66km -66,74dBm -66,77dBm 2 0µs 0µs - - NLOS 2,65km -66,72dBm -66,80dBm
Receive Pow er
Receive Pow er Routes
STDCC OFDM
Line of Sight
Distância Tx e Rx Mean
Spread
Brazilian Microwave and Optoelectronics Society-SBMO received 02 April 2012; for review 20 April 2012; accepted 28 Jan 2013 Brazilian Society of Electromagnetism-SBMag © 2013 SBMO/SBMag ISSN 2179-1074
Fig. 13. Comparison between STDCC Power Delay Profile with its respective multipath valid of Route 3 (d = 1.25 km): (a) STDCC Power Delay Profile; (b) STDCC multipath valid.
TABLE IV. DISPERSION OF THE CHANNEL PARAMETERS TO ROUTE 3
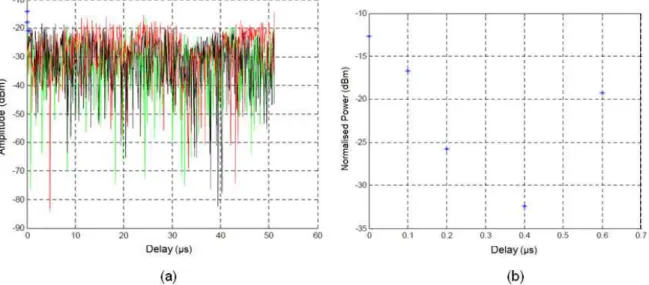
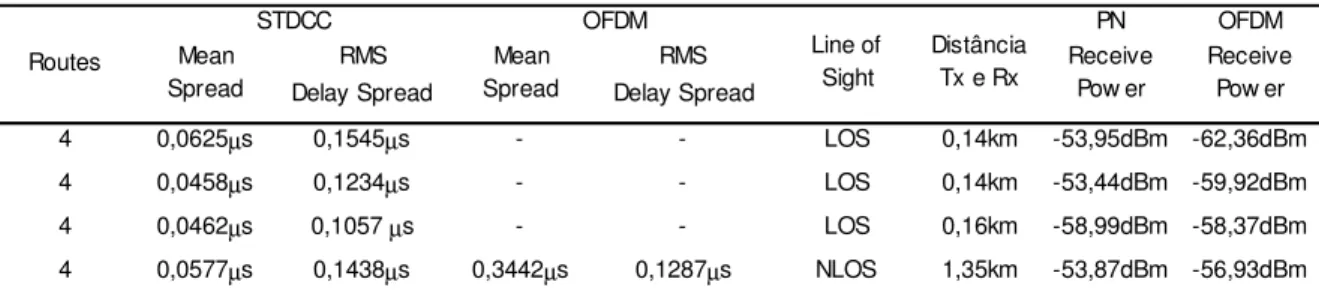
Route 4 is NLOS. Figure 14 illustrate one of the power delay profiles over the route, and Table V
shows the values of mean spread and RMS delay spread in this route.
Only the STDCC sounder has shown a satisfactory performance in LOS cases. The OFDM sounder
did not perform at all in this situation as can be seen in the tables II to V.
Fig. 14. Comparison between STDCC Power Delay Profile with its respective multipath valid of Route 4 (d = 0.14 km): (a) STDCC Power Delay Profile; (b) STDCC multipath valid.
PN OFDM
RMS RMS
Delay Spread Delay Spread
3 0,0608µs 0,1156 µs - - NLOS 1,26km -65,46dBm -64,65dBm
3 1,1053µs 0,8028µs 0,2476µs 0,0499µs NLOS 1,25km -66,14dBm -65,36dBm
3 0,8294µs 0,7171µs - - NLOS 1,23km -65, 69dBm -64,99dBm
3 0,1654µs 0,2246µs 0,3657µs 0,1524µs NLOS 1,21km -64,93dBm -63,82dBm
Receive Pow er
Receive Pow er Routes
STDCC OFDM
Line of Sight
Distância Tx e Rx Mean
Spread
Brazilian Microwave and Optoelectronics Society-SBMO received 02 April 2012; for review 20 April 2012; accepted 28 Jan 2013 Brazilian Society of Electromagnetism-SBMag © 2013 SBMO/SBMag ISSN 2179-1074
TABLE V. DISPERSION OF THE CHANNEL PARAMETERS TO ROUTE 4
V. CONCLUSIONS
STDCC and OFDM sounders using the same setup allowed a comparative study, so the setup was
adjusted to attend the restrictions of both sounders. In order to provide a fear comparison between the
OFDM and STDCC sounders we have decided to use the same bandwidth on both sounding signals.
This band was set to 10 MHz due to the band limitation of the STDCC sounder. Hence, under the
same constraint of bandwidth the STDCC has performed much better than the OFDM. However, the
OFDM sounder can be implemented with a larger bandwidth which would improve significantly its
performance as would be expected [7].
Figure 4 clearly illustrates the main disadvantage of the STDCC sounder that are the side lobes with
significant level, not present at the OFDM signal. This is why we would expect a better performance
of the OFDM sounder [8, 11].
However, the OFDM sounder has also its disadvantage showing a problem regarding
synchronization [12] that injures its operation in Line-Of-Sight (LOS) region. Without the use of these
techniques of synchronization and not utilizing the better configuration of its parameters, OFDM has
its performance degraded.
The suburban environment was suitable for such studies because they represent the regions where
WiMAX systems will work to meet demand for broadband in the last mile.
The contribution of this work was to show that the OFDM sounder has a loss of performance when
adjusting its parameters to the STDCC sounder and that the OFDM needs a technique to detect and
compensate the synchronization offsets.
REFERENCES
[1] M. F. Iskander and Z. Yun, “Propagation Prediction Models for Wireless Communication Systems,” IEEE Trans. on Microwave Theory and Techniques, vol. 50, no. 3, pp. 662-67, March 2002.
[2] J.D. Parsons, D.A. Demery, A.M.D. Turkmani, “Sounding techniques for wideband mobile radio channels: a review”, IEE Proceedings-I, vol.138, no.5, pp.437-446, october 1991
[3] Sarwate, D.V., and Pursley, M.B.: ‘Crosscorrelation properties of pseudorandom and related sequences’, Proc. IEEE, 1980, 68, (5), pp. 593–61
[4] D. Cox, “Delay doppler characteristics of multipath propagation at 910 MHz in a suburban mobile radio environment,” Antennas and Propagation, IEEE Transactions on, vol. 20, no. 5, pp. 625-635, Jan 1972.
[5] E.L. Pinto, C.P. de Albuquerque, “A Técnica de Transmissão OFDM”, Revista Cientifica Periódica - Telecomunicações, vol. 1, Nº 5, Junho de 2002.
PN OFDM
RMS RMS
Delay Spread Delay Spread
4 0,0625µs 0,1545µs - - LOS 0,14km -53,95dBm -62,36dBm 4 0,0458µs 0,1234µs - - LOS 0,14km -53,44dBm -59,92dBm
4 0,0462µs 0,1057 µs - - LOS 0,16km -58,99dBm -58,37dBm
4 0,0577µs 0,1438µs 0,3442µs 0,1287µs NLOS 1,35km -53,87dBm -56,93dBm
Receive Pow er Receive Pow er Routes STDCC OFDM Line of Sight Distância Tx e Rx Mean
Spread
Brazilian Microwave and Optoelectronics Society-SBMO received 02 April 2012; for review 20 April 2012; accepted 28 Jan 2013 Brazilian Society of Electromagnetism-SBMag © 2013 SBMO/SBMag ISSN 2179-1074 [6] SOUZA, E.S.; JOVANOVIC, V.M.; DAIGNEAULT, C. Delay Spread Measurements for the Digital Cellular Channel
in Toronto, IEEE Trans. On Vehicular Technology, vol. 43, Nº 4, November 1994.
[7] RON, Carlos Vinicio Rodríguez, Caracterização do Canal Rádio em Banda Larga na faixa de 3,5GHz em Ambiente Urbano, Tese de Doutorado , Pontifícia Universidade Católica do Rio de Janeiro , Rio de Janeiro, Setembro de 2009.
[8] MATOS, Leni J. de, Influência da Vegetação na Dispersão dos Sinais Rádio-Móveis, Tese de Doutorado, Pontifícia Universidade Católica do Rio de Janeiro , Rio de Janeiro, Setembro de 2005.
[9] Peled, A. and Ruiz, A., ‘Frequency domain data transmission using reduced computational complexity algorithms’, Proc. IEEE ICASSP, pp. 964–967, Denver, Colorado, 1980
[10] B. Muquet, Z.Wang, G. B. Giannakis, M. de Courville, and P. Duhamel, “Cyclic prefix or zero padding for wireless multicarrier transmission?,” IEEE Trans. Commun., vol. 50, pp. 2136–2148, Dec. 2002.
[11] JERUCHIM et all. Simulation of Communication Systems, Plenum Press, New York, 1992.
[12] ACOSTA-MARUM, Guillermo. Measurements, Modeling, and OFDM Synchronization for the Wideband Mobile-to-Mobile Channel, Thesis of PhD, Georgia Institute of Technology, 2007.
Rogerio Moreira Lima Silva was born in São Luis, MA, Brazil on May, 1976. He received Bs.C. degree in Electric Engineer from Federal University of Maranhão in 2001. In 2004 received the Ms.C. in Mobile Telecommunications from Engineering Military Institute (IME), Rio de Janeiro, Brazil. He received his DSc degree in Applied Electromagnetism Program of Centro de Estudos de Telecomunicações (CETUC) of PUC/RJ, Brazil, in 2011. He is currently a professor in the department of electrical engineering in Gama Filho University and has worked on characterization Channel Radio Propagation.
Leonardo Henrique Gonsioroski was born in Rio de Janeiro, RJ, Brazil on October, 1975. He received Bs.C. degree in Electric Engineer from Federal University of Maranhão in 1998. In 2002 received the M.Sc. degree in nuclear engineering from Engineering Military Institute (IME), Rio de Janeiro, Brazil. He is currently a professor in the department of electrical engineering in Gama Filho University and has worked on his DSc thesis on characterization Channel Radio Propagation in Urban Regions in Microwave band by Applied Electromagnetism Program of Centro de Estudos de Telecomunicações (CETUC) of Pontifical University Catholic of Rio de Janeiro - PUC-Rio.
Gláucio L. Siqueira was born in Belo Horizonte, MG, Brazil on August, 1952. He received a degree of Electronic and Telecommunication Engineer from Pontifical Catholic University of Minas Gerais and a degree in Mathematics from the Federal University of Minas Gerais in 1977 and 1978, respectively, In 1982, he received a degree of MSc from the Campinas State University (UNICAMP). He received his PhD degree in Electrical Engineering from the University College London, England, in 1989. Since then, he is in the Center for Telecommunication Studies (CETUC) at the Pontifical Catholic University of Rio de Janeiro (PUC/RJ). He has published several research papers including IEEE Transactions, and was awarded with a number of lecturing distinctions. His research interests include random media propagation, rain induced attenuation and mobile radio channel characterization and modeling. He is member of IEEE since 1989.
Carlos Rodriguez Vinicio Ron holds a DSc degree in Applied Electromagnetism Program of Centro de Estudos de Telecomunicações (CETUC) of PUC/RJ. Ms.C. in Mobile Telecommunications from Engineering Military Institute (IME), Rio de Janeiro, Brazil . Bs.C. degree in Electronic Engineer Specialized in Telecommunications from Army Polytechnic School - Quito – Ecuador.
Brazilian Microwave and Optoelectronics Society-SBMO received 02 April 2012; for review 20 April 2012; accepted 28 Jan 2013 Brazilian Society of Electromagnetism-SBMag © 2013 SBMO/SBMag ISSN 2179-1074 wideband channel. Works jointly with Inmetro in projects relative to Cognitive Radio and modeling of the wideband wireless channel.