Abstract— In this paper, field measurements carried out in a suburban SFN network with two synchronized transmitters are reported. It is found that the radio signal coverage of the distributed transmission scheme is distinctly improved when compared to a single transmitter system. The path loss gain and improvement associated to the SFN scheme are obtained as well as the multipath channel parameters including the mean and RMS delay spread. A tapped delay line is used to model the average power delay profile (PDP) in the distributed transmission cases and shows rather different features than the single transmission case.
Index Terms— single frequency networks, digital television, broadcast channel modeling.
I. INTRODUCTION
In a DTV traditional wireless transmission scenario, only one transmitter is used to transmit the
wanted signal in an assigned channel to a given user. Signals from other transmitters are taken as
interferences and should be kept out of the assigned frequency or time or coding channel of the given
user. In such case, the signal strength variation is characterized by the path loss, as given by [1,2], and
the time delay dispersion of received signal, expressed by power delay profile (PDP) [3], that is
usually modeled by an exponential decay.
In digital systems, alternative transmission scenarios with the utilization of distributed transmitters
are possible and have been found to be efficient to improve signal coverage. One application of this
idea is the Single Frequency Network (SFN) [4], which uses distributed radio transmitters to
broadcast the same signal over the same frequency channel to improve coverage and improve
reception on shadowed areas.
The channel characteristics for SFN transmission differ from the traditional single transmitter case
due to the presence of signals reaching the receiver originating from more than one transmitter. These
signals create a severe artificial multipath propagation environment at the receiver as observed by
Tang et.al.[5], Zhao et. al. [6] and Guerra et. al.[7]. It translates not only into intersymbol interference
SFN Channel Measurements in Brazil
Maurício V. Guerra
CEFET/RJ – Centro Federal de Educação Tecnológica Celso Suckow da Fonseca, Rio de Janeiro, Estrada de Adrianópolis, 1.317, Santa Rita, Nova Iguaçu, RJ, 26041-271, Brazil
Carlos V. Rodriguez R. and Luiz da Silva Mello
Center for Telecommunication Studies – Catholic University of Rio de Janeiro, R. Marquês de São Vicente, 225, Gávea, Ed. Kennedy, 7º andar, Rio de Janeiro, RJ, 22453-900, Brazil
smaller than the guard interval, no intersymbol interference occurs and the signal contributes totally to
the wanted signal. Signals arriving later than Ts are treated as interfering signals. A method that is
often used as a countermeasure against self-interferences is to increase the total symbol duration (the
actual symbol length and the guard space). The receiver can then make use of the multiple received
signals, thus yielding a diversity gain. The performance limits are still set by interference from very
large delayed signals, which are inherent to the structure of SFN.
To properly design a SFN system, the propagation characteristics of channel with distributed
transmission have to be studied carefully. It is known that the power delay profile (PDP) in a SFN
channel shows rather different features than in the single transmission cases and cannot be modeled
simply by an exponential decay due the existence of distributed transmitters [5]. Thus, it is necessary
to obtain data from field measurements in different scenarios to derive appropriate SFN channel
models.
In this paper, preliminary results of field measurement carried out in a suburban SFN scenario with
two synchronized transmitters are reported. The path loss gain and improvement associated to the
SFN scheme are obtained, as well as the multipath channel parameters, including the mean delay and
RMS delay spread. A tapped delay line is used to model the average power delay profile (PDP) in the
distributed transmission cases and shows rather different features than the single transmission case.
II. EXPERIMENTAL SETUP
Measurements were performed in a commercial broadcast ISDB-T system with two-transmitters
SFN, deployed in a suburban area in Rio de Janeiro, Brazil. The OFDM modulation scheme with
dense net of pilot carriers used in the ISDBT-T system [9] allows the evaluation of channel
parameters by processing the received signals from regular transmissions.
A network analyzer ANRITSU MS8901A, with the capability to measure channel impulse response
and amplitude/phase characteristics was used. The measurements were performed at 563 MHz, with a
channel bandwidth 6MHz. The modulation parameters were FFT=8k, GI 1/16 and 64 QAM.
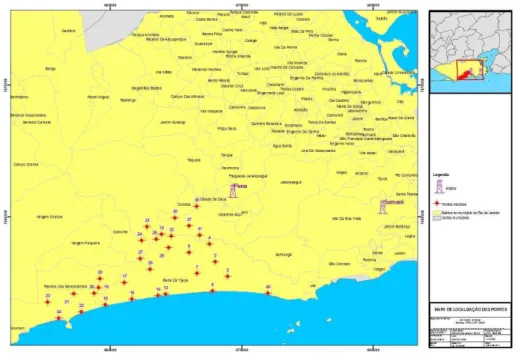
The campaign data includes static measurements performed at 31 points with both a directional
antenna of 14 dB gain and an omnidirectional antenna, positioned 13.4 m above ground level. Fig. 1
shows the transmitter sites (Sumaré and Pena) and the 31 measurement points, chosen over the main
Figure 1. Transmitter sites and measurement points
Figure 2. Mobile unit and receiver setup
III. TRANSMISSION LOSS MEASUREMENTS
A. Path loss for a single transmitter
Conventionally, in point-to-point transmission systems, the signal strength variation is measured by
the path loss describing the range dependence of the signal strength, which is defined as
[dB] = 10 (1)
where PL is path loss, d is the distance between the transmitter and receiver; Pt and Pr are the
transmitted and received power, respectively; Gt and Gr are the transmitter and receiver antenna gain,
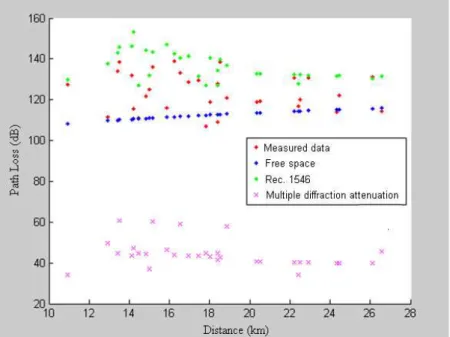
the signal from the main transmitter (Sumaré), which is located near by the top but on the eastern side
of the highest hills in the region, as indicated in Fig. 4. Due to the obstruction of the signal transmitted
by this main source, we observed higher losses in the measured points that are closer to the main site.
Although ITU-R P.1812 [2] could provide more accurate results for this type of environment, it
requires detailed information about the terrain profile that is not available in this case.
Figure 3. Measured path loss in single transmitter scenario.
B. Transmission loss in a Single Frequency Network
In a SFN, where multiple distributed transmitters are used to broadcast the same signals to every
user in the same frequency channel, the conventional range (d) between a specific user (or receiving
point) and the transmitter (or transmitting point) cannot be defined, so that the concept of "path loss"
is not suitable in this case. If there are N transmitters, the received power cannot be defined as Pr(d)
but as Pr (d1, d2,…,dn). Tang et. al. [5] define the combined transmission loss TL as the ratio of the
received power of a receiver at certain position to the effective power sum of all the transmitters in the
SFN.
TL[dB] = 10log !",!$,⋯,!&
' (")("* ($)($*⋯* (&)(&+), (2)
where N is the number of transmitters in the SFN. P.& and G.&is the transmitter power and antenna gain for the nth transmitter.
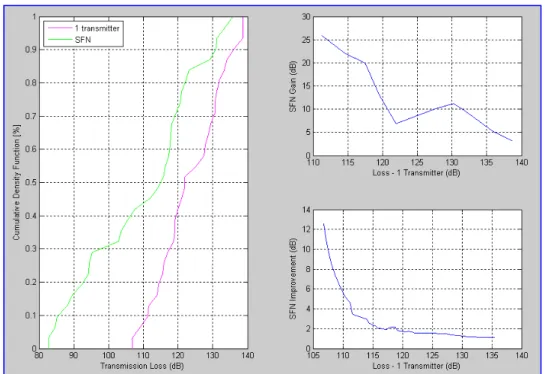
Fig.5 shows the cumulative distributions of the transmission loss in SFN and the path for a single
transmitter scenario, with the transmitted power in SFN kept the same as in the single transmitter
scenario.
Figure 5. Cumulative distribution of transmission loss in SFN and single transmitter scenarios.
It is clear that the transmission loss in SFN is significantly lower than that in single transmitter. The
second and third right hand side graphs in Fig. 5 show the diversity gain (G) and the diversity
where p denotes probability of exceedance. PL is the path loss of a single transmitter and PT is the
SFN loss. This gain, i.e. the decrease of transmission loss, results from the fact that the SFN provides
multiple opportunities for the receiver to acquire the signal. Even if one or several paths are blocked,
others may provide enough intensity for the signal to be decoded by the receiver.
IV. WIDEBAND CHANNEL CHARACTERIZATION
A. SFN Channel Delay Spread
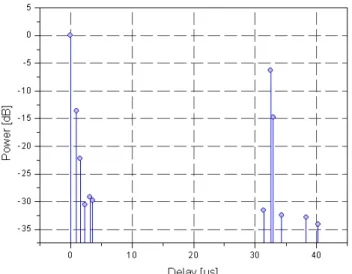
Typical average PDPs extracted from the measured data are shown in Fig. 5 and Fig. 6. Compared
to the average PDP received from a single transmitter, the average PDP received from two
transmitters is evidently sparse. Moreover, the PDP of distributed transmission system has the long
delay echoes due to the multiple transmitters.
The delay dispersion is usually characterized by the mean excess delay τ: and the root mean square (RMS) delay spread τ;:<, which are defined as the first central moment and the square root of the second central moment of the instantaneous PDP [10].
To calculate the delay dispersion parameters, a threshold must be defined, below which the
multipath components will be ignored. Three different threshold levels were considered at 10, 15 and
20 dB below the maximum value of the PDP. The obtained values of mean excess delay τ: and (RMS) delay spread τ;:< for each threshold are shown in Table I.
It can be observed that the maximum excess delays and RMS delay spreads are practically
independent of the threshold considered. The mean values, on the other hand, increase as the
threshold decreases. Also, the values of both the excess delay and the RMS delay spread are much
Figure 6. Power delay profile – measurement point 6.
Figure 7. Power delay profile – measurement point 16
TABLE I. DELAY PARAMETERS FOR TWO TRANSMITTERS SFNMEASUREMENTS
Threshold Excess delay (µµµµs) RMS delay spread (µµµµs)
Mean Max Mean Max
- 20 dB 1,86 12,7 3,72 13,1
- 15 dB 2,36 12,7 4,04 13,1
- 10 dB 3,83 12,5 5,85 12,7
B. Tapped Delay Line Model for SFN Channels
Tapped delay line (TDL) models are often used to model the average PDP for computational or
laboratory simulations [6]. These models represent the channel by a transversal filter structure with
distinct taps corresponding to delays =>?@A. Their calculation is based on the average power delay
numbers [13]. Compared with the single transmission case, the PDP in SFN channels should contain
more taps and have significantly longer delays [5,13,6].
Similarly to the calculation of RMS delay spread, thresholds must be set to include the significant
multipath components in the TDL model derivation. Examples of the TDL models obtained for the
SFN channel considered in this paper is shown in Table II. The threshold levels are [10; 15; 20] dB
below the maximum value in the PDP.
TABLE II. TDLMODELS FOR THE TWO TRANSMITTER SFNCHANNELS
This Work Tang [5]
-10 dB -15 dB -20 dB -20 dB
TAP no. Delays [µs]
Mag [dB]
TAP no. Delays [µs]
Mag [dB]
TAP no. Delays [µs]
Mag [dB]
TAP no. Delays [µs]
Mag [dB]
1 0 0 1 0 0 1 0 0 1 0 0
2 19,8 -4,5 2 0,48 -13,7 2 0,48 -13,7 2 0,48 -7,2 3 20,0 -5,5 3 0,60 -13,0 3 0,60 -13,0 3 3,14 -2,2 4 20,4 -9,8 4 19,8 -4,5 4 0,72 -16,3 4 19,23 -1,6 5 24,4 -6,9 5 20,0 -5,6 5 0,96 -17,9 5 20,08 -13,5 6 32,5 -6,3 6 20,4 -9,8 6 1,08 -19,1 6 22,25 -6,5
7 22,4 -13,2 7 1,68 -16,6
8 24,4 -6,9 8 19,8 -4,5
9 32,5 -6,3 9 20,0 -5,6
10 32,9 -14,7 10 20,2 -15,3
11 20,4 -9,8
12 21,0 -19,2
13 22,4 -13,2
14 24,4 -6,9
15 27,5 -19,9
16 32,5 -6,3
17 32,9 -14,7
18 33,5 -17,2
Comparing the model derived in this work with those also reported by Tang et. al. [5] for the
distributed transmitter case, the hilly nature of the area where the experiments have been carried out
explains the increased number of taps and the longer delays presented in Table II. Notice the results
reported in [5] were derived from measurements on a highway located in a plain area with elevated
transmitters at the two ends.
V. CONCLUSIONS
Results of field measurements performed in a SFN network with two ISDB-T digital TV
The path loss prediction method given in Rec. ITU-R P.1546 overestimates the measured values by
up to 20 dB. The transmission loss in SFN is significantly lower than that in single transmitter. A
minimum diversity gain of about 5 dB was obtained and a gain of 7 dB was exceeded at 50% of time.
The mean excess delay τ: and the root mean square (RMS) delay spread τ;:< for the two transmitters SFN were obtained. The values are more than one order of magnitude higher than those
usually observed for single transmitter configurations.
Tapped Delay Line models for computer or laboratory simulation of two-transmitter SFN channels
were also derived. As expected, when compared with single transmission cases, the PDP models for
the SFN channel contain more taps and have significant longer delays.
Though the results reported in this paper are drawn in a specific setup in a suburban area, they are
expected to contribute to the study of SFN channel characteristics.
ACKNOWLEDGMENTS
CNPq supported this work under covenant 573939/2008-0 (INCT-CSF). The authors are indebted
with Dr. P. V. Gonzalez Castellanos and Dr. J. A. Cal Bras, from the National Institute of Metrology,
Quality and Technology, for the helping assembling the measurements set-up and the use of the
mobile unit.
REFERENCES
[1] ITU-R Recommendation P. 1546-3, “Method for point-to-area predictions for terrestrial ervices in the frequency range 30 MHz to 3000 MHz”.
[2] ITU-R Recommendation P. 1812-2, “A path-specific propagation method for point-to-area terrestrial services in the VHF and UHF bandsethod for point-to-area predictions for terrestrial ervices in the frequency range”.
[3] ITU Recommendation ITU-R P. 1407: Multipath propagation and parameterisation of its characteristics, 1999.
[4] G. Malmgren, “On the performance of single frequency networks in correlated shadow fading,” IEEE Trans. On
Broadcasting, Vol. 43, no.2, June 1997.
[5] Shigang Tang; Changvong Pan; Ke Gong; and Zhixing Yang:, “Propagation Characteristics of Distributed Transmission with Two Synchronized Transmitters,” Vehicular Technology Conference 2006 VTC 2006-Spring. IEEE 63rd , vol.6, no., pp. 2932-2936, 7-10 May 2006.
[6] X. Zhao et al., ”Measurements and Modelling of the Small Scale Effects of Radio Channels for Rural and Suburban B3G Wireless Communications”, in 14th IST Mobile & Wireless Communications Summit, Dresden, Germany, June 2005.
[7] G. Guerra, et al, "Field measurement based characterization of the wideband urban multipath channel for portable DTV reception in single frequency networks," IEEE Trans. Broadcasting, vol.51, no.2, pp. 171-179, June 2005.
[8] G. Malmgren, “Network Planning of Single Frequency Broadcasting Networks”,Licentiate Thesis, TRITA-S3-RST-9606, Royal Institute of Technology, April 1996.
[9] Terrestrial Integrated Services Digital Broadcasting (ISDB-T) Document, “Specification o Channel Coding, Framing Structure and
Modulation”, 1998.
[10] H. L. Bertoni, Radio Propagation for Modern Wireless Systems, Prentice Hall PTR, 2000.
[11] Elvino S. Souza, Member, IEEE, Vladan M. Jovanovié, Member, IEEE, and Christian Daigneault, Member, IEEE.:
“Delay Spread Measurements for the Digital Cellular Channel in Toronto”, IEEE Transactions on Vehicular
Technology, Vol. 43. NO. 4, November 1994.
[12] Parsons, J.D.: The Mobile Radio Propagation Channel. Pentech Press Publishers, London, 1992.