Thermal Lens Temperature Sanning for
Quantitative Measurements in Complex Fluids
J. H. Rohling,J. Mura, J. R. D. Pereira, A. J.Palangana,
A. N.Medina, A. C. Bento,M. L. Baesso,
Departamentode Fsia, UniversidadeEstadualde Maringa,
Av. Colombo5790,CEP87020-900, Maringa,PR,Brazil
and L. C. M. Miranda
InstitutoNaionalde PesquisasEspaiais,CEP12227,S^aoJose dosCampos,SP,Brazil
Reeivedon12Deember,2001
Inthis workthermallens spetrometryis appliedto investigate the thermo-optial properties of
omplexuidsasafuntionofthetemperature. Themethodisappliedinpoly(vinylhloride),in
polyarbonate andinlyotropiliquidrystalsas thetestingsamples. Thefous ofthedisussion
will be in the temperature range where the phase transitions our. The perspetive of future
studiesinthisareawillbedisussed.
I Introdution
Theultimategoalin thestudyof thethermaland
op-tial properties of omplexuids asa funtion of the
temperatureisthedetermination oftheroleplayedby
these parametersin the material phase transitions
[1-14℄. It is well known that thermal ondutivity (K),
thermal diusivity (D) and the oeÆient of
temper-ature of the refrative index (dn=dT) present strong
variation in their valueswhen the temperature of the
sampleislosetotheregionwherethephasetransition
isexpetedtoours[1-7℄.Ontheotherhand,itis
re-ognizedthatthepreisedeterminationofphase
transi-tiontemperatureisstillanexperimentalhallengethat
needs to be aomplished. Conventional alorimetri
methods demands the use of a referene sample and
thereforeatemperaturelagbetweenthetestedsample
and thereferenemaytakeplae. Thisdoesnotallow
toloatethephasetransitiontemperaturepreisely
[1-5,12,13℄.
Inthelasttwodeadeswehavewitnessedthe
devel-opment of anumberof tehniquesfor non-destrutive
haraterizationof thethermal,optial andstrutural
properties of materials based upon the photothermal
tehniques [15, 16℄. Despite this growing interestand
the importane oftheappliations of thesetehniques
to theomplexuidarea[17-21℄,sofarthe
photother-mal measurements have been arried out mostly at
near room temperature onditions. A restrited
num-berofworkshasappliedphotothermalmethodsfor
dif-ferent temperature studies in the omplexuids area.
ri method to investigate the ritial behavior of the
thermal parameters lose to the liquid rystal phase
transitions. Theirexperimentshavebeenperformedin
thermotropi liquid rystal in the temperature range
between 35 0
C and 100 0
C : Reently, we have
intro-dued Thermal Lens Spetrometry (TLS) to measure
the thermo-optial properties of omplex uids as a
funtion of the temperature [3-11℄. The experiments
have been performed in polymer samples, polyvinyl
hlorideandpolyarbonate,andin pureandferrouid
dopedlyotropiliquidrystals. Inthesemeasurements
thethermo-optialpropertiesasafuntionofthe
tem-perature have been obtained. TLS is a very sensitive
tehniquethathasbeenprovedtobeavaluablemethod
for investigating not only the omplete thermal and
spetrosopipropertiesoftransparentmaterials,suh
as,glasses[22-33℄,liquidrystals[9-11,18℄andpolymers
[3-5,34℄,butalsoforthesensitivemonitoringofthe
ki-netisoffasthemialreations[35℄,perolationin
mi-roemulsions[36℄,anddynamisofwater-surfatant
in-teration[37℄. Thistehniquehasthespeialabilityof
beingaremotemethodandduetothefatthatthe
ne-essarytemperaturetoobtainthethermallenssignalis
lowerthan10 2
C,itallowsanedeterminationofthe
experimentalparametersverylosetothesamplephase
transition. OneadditionaladvantageoftheTLS,
espe-iallyfor anisotropisamples, is the determination of
theabsolutevalueofdn=dTforeahsampleorientation
independently. Thedeterminationofdn=dT asa
fun-tionof the temperature and sampleorientationis
im-portantbeause it ontainsinformation about sample
produeeitherlaserbeamself-fousinganddefousing,
dependingon thesample orientationand temperature
andalsothelaserbeampolarization[9,10,11℄.
Inthis work wedisuss theuseofthethermallens
(TL) tehnique for the measurements of the
thermo-optial properties of polymersand pure and ferrouid
dopedlyotropiliquidrystalsasafuntionof
temper-ature. Thefous ofthe disussion will be in the
tem-peraturerangein whihthe phasetransitionsof these
materialsour.
II Thermal lens Spetrometry
ThermalLensSpetrometrywasrstreportedin1964
by Gordan et al. [22℄. Sine then the tehnique has
proved to be a valuablemethod to study transparent
materials. TheTLeetisinduedwhenalaserbeam
passes through amaterial and the absorbedenergy is
onvertedintoheat. Theonsequenthangein the
op-tial path length indued by a temperature rise will
produe alenslike optial element at the sample, the
so alled thermal lens eet. The propagation of a
probe beam through the TL will then be aeted
re-sulting in a spreadingorfousing of thebeam enter.
Bymeasuringthisbeamenter intensityvariation,the
thermo-optial properties of the sample an be
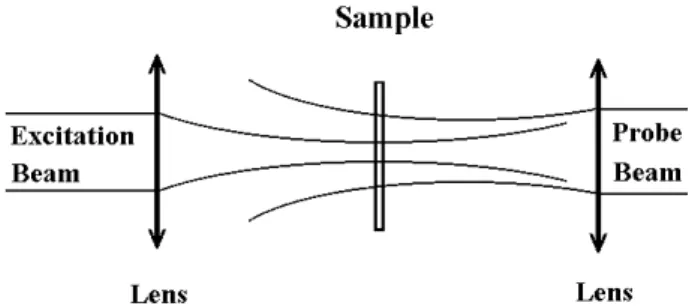
deter-mined. Themode mismathed onguration hasbeen
showntobethemostsensitiveexperimental setupfor
theTLmeasurements. Thisarrangementusestwolaser
Figure 1. Probe beam and exitation beamin the mode
mismathedTLonguration.
Thetheoretialtreatmentofthethermallenseet
takesintoaountthespherialaberrationofthe
ther-mallensandthewholeoptiallengthhangewith
tem-perature is onsidered. The rst step in the
develop-mentofthemodelistoonsidertheheatsoureprole,
Q(r), induedby thelaserbeam. Q(r) isproportional
totheGaussianintensityprolewhihanbeexpressed
asI
e
(r)=(2P
e =!
2
e
)exp( 2r 2
=! 2
e
),inwhihP
e isthe
exitation beam power and !
e
is the exitation beam
waistat thesampleposition. Thesolutionoftheheat
ondution equation depends onthe employed
bound-aryonditions. Shenetal. [38,39℄developedthe
inni-tiveaberrantmodelforthemodemismathed
ongu-ration. UsingtheonditionsT(r;0)=0(r<1)and
T(1;t) = 0(t > 0); the temporal evolution of the
temperatureprole4T(r;t)induedbytheTLin the
sampleisgivenby[22,38℄:
4T(r;t)= 2P
e A
e
! 2
e Z
t
0
1
1+(t 0
=2t
)
exp
2r 2
=! 2
e
1+(2t 0
=t
)
dt 0
(1)
d
InEq. (1)isthedensity,thespeiheat,A
e the
op-tialabsorptionoeÆientattheexitationbeam
wave-lengthandt
theharateristithermaltimeonstant,
denedas:
t
=
! 2
e
4D ;D=
K
(2)
whereDisthethermaldiusivityandKisthethermal
ondutivity.
This temperature rise, whih arries a Gaussian
prole, indues a slight distortion in the probe beam
wavefrontthatanbeassoiatedwiththeoptialpath
lengthhangewithrespetto theaxisas:
p
2 =l
0 (
ds
dT )
p
[T(r;t) T(0;t)℄ (3)
in whih is the phaseshift induedwhen theprobe
beam passes through the TL,
p
is the probe beam
wavelength, l
0
isthesamplethiknessand(ds=dT)
p is
thetemperatureoeÆientoftheoptiallengthat the
probebeamwavelength.
Finally, usingFresnelldirationtheory,theprobe
beam intensity at the detetor plane an be written
as an analytial expression for absolute
determina-tionof thethermo-optialpropertiesofthe sample,as
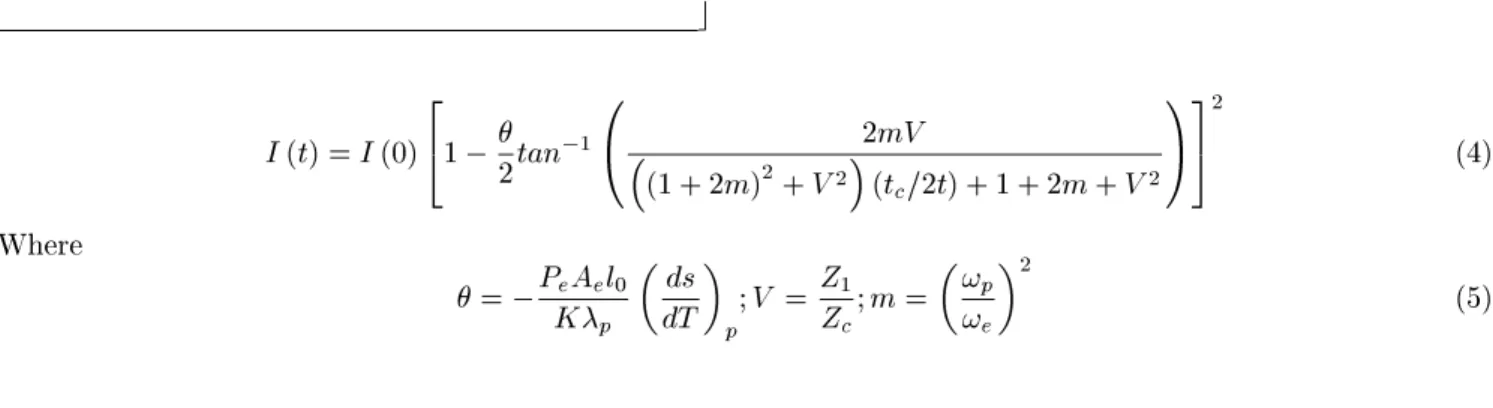
I( t)=I( 0) 2
4
1
2 tan
1 0
2mV
(1+2m) 2
+V 2
(t
=2t)+1+2m+V 2
1
A 3
5 2
(4)
Where
= P
e A
e l
0
K
p
ds
dT
p ;V =
Z
1
Z
;m=
!
p
!
e
2
(5)
d
In Eq. (4) I(t) is the temporal dependene of the
probe laser beam at the detetor, I(0) is the initial
value of I(t), is the thermally indued phase shift
of the probe beam after itspassing through the
sam-ple, !
p
is theprobe beam spot size at thesample, Z
is the onfoal distane of the probe beam, Z
1 is the
distanefromtheprobebeamwaisttothesample. We
shouldmentionthattheparameterds=dTdesribesthe
whole optial pathlengthhange induedbythe
exi-tation beam, whih means that for a solid materials
it depends on several mehanisms suh as the sample
bulging duringtheilluminationandalsoonthe
stress-optialoeÆient. Intheaseofliquidsamplewehave
ds=dT =dn=dT:
III Experimental
TL measurements an be performed for both
time-resolved and steady state mode. The time-resolved
methodpermitsthemeasurementofthedevelopmentof
thethermallensinashortperiodoftime,andthe
ad-vantageofthis proedure whenompared with steady
statemodeisthatitallowstomeasurethesample
ther-maldiusivity. Themodemismathedexperimentalset
up fortime resolvedmeasurementis shown in Fig. 2.
Theexperimentisperformedinthefollowingway: rst,
the probebeamis aligned,using mirror5, in orderto
haveits enter passingthroughthepinhole positioned
infrontofthedetetor;afterthatusingmirror2the
ex-itationbeamisusedtoinduethethermallensinthe
entralpartoftheprobebeam,induingaonsequent
hange in its intensity in the detetor, photodiode 2.
Thissignalvariationisreordedbytheosillosopeand
the data thus obtainedis proessed usingleast-square
urvetting. Inthetimeresolvedmeasurements,and
t
arestraightforwardlyobtainedfromthettingofthe
experimentallyobservedproleofthedeveloping
ther-mal lensto Eq. (4). Inorderto validate andevaluate
the sensitivity of the proposed method we have also
arried out omplementary measurements of
dieren-theevaluationoftheglasstransitiontemperature.
The poly (vinyl hloride) (PVC) lm used was
a 200 m thik with 12 mm diameter disks. The
PVClmswere preparedusing a20;000molarweight
PVC powder (Aldrih). The lms were ast from a
6:5%(w/w)1,2-di-hloroethanesolution, at room
tem-perature, over a at lean glass substrate. The TL
experiments were performedin thetemperaturerange
from 22 Æ
C up to 70 Æ
C. For the polyarbonate, the
tested sample used onsisted of a 1.4 mm thik, 12
mm diameter diss of polysafe poly(arbonate)
man-ufaturedbyWilsonSafetyProdutsCo. The
temper-aturerangefortheTLexperimentswasfrom22 Æ
Cup
to170 Æ
C.
Figure2. TLexperimentalsetup.
Thepureandferrouiddopedlyotropiliquid
rys-tal (LLC) samples were prepared with the following
omposition: potassium laurate (29.4 wt%), deanol
aquartzuvette0.5mmthik. Usingmagnetieldthe
LLC diretor wasaligned in parallel orperpendiular
tothesidewalls. Afterthat,thesamplewaspositioned
insideahotstage(MK200)devie. Themeasurements
wereperformedasafuntionofthetemperatureinthe
rangefrom13 Æ
Cupto54 Æ
C.
IV Thermal lens in polymers
IV.1 Room temperature study
Polymers are arboni ompounds whih, like
glasses,presenttherequiredpropertiestobeusedas
op-tial materials. Whensuitablefor optialappliations
the lower ost of fabriation of these materials make
them advantageous when ompared to optial glasses.
Therefore,itisimportanttodeterminethethermallens
eet in polymers sine it is related to the hange in
theoptialpathlengthwithtemperature,ds=dT. The
knowledgeofthisparameterisimportantwhenthe
ma-terialisusedin optialsystem.
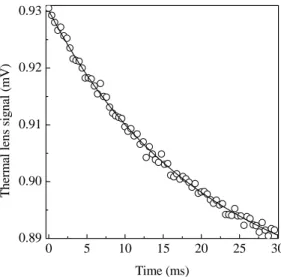
Fig. 3showsatypialTLsignalfor thePVC
sam-pleatroomtemperature. Thesolidlineorrespondsto
thedatattingofEq. (4)totheTLexperimentaldata
leaving and t
as adjustable parameters. The
val-ues we haveobtainedwere =(0:07910:0009)and
t
=(5:500:06)ms. Theorrespondingvalueofthe
thermaldiusivitywasD=(1:290:03)10 3
m 2
/s.
Thisvalueagreewiththatreportedintheliteraturefor
PVCatroomtemperature[7℄,namely,1:210 3
m 2
/s.
0
5
10
15
20
25
30
0.89
0.90
0.91
0.92
0.93
T
h
er
m
al le
ns sig
na
l (
m
V
)
Time (ms)
Figure3. Typialtransient TLsignal for PVC samplefor
apumpbeampowerof75mWatroomtemperature. The
solidlineorrespondstothedatattingtoEq. (4).
Wehaveperformedadditionalmeasurementsof
spe-i heat and taken the mass density from the
liter-1.6mW/mK.
Having the thermal ondutivity, the measured
valueof=P =(1:1W 1
),A
e
=(0:1m 1
),k=(1:87
mW/mK),
p
= (6:32810 5
m) and using Eq.
(5) the value of ds=dT was found to be ds=dT =
( 0:6210 4
K 1
): For solid sample, the parameter
ds=dT determinedbyTLmeasurementsanbewritten
as[23℄
ds
dT =(n
0
1)(1+)
T +
dn
dT +
1
4 n
3
0 Y
T (q
11 +q
12 );
(6)
inwhih
T
isthelinearthermalexpansionoeÆient,
isthePoissonratio,Y istheYoungmodulus,q
11 and
q
12
arethestressoptioeÆients,paralleland
perpen-diularto thediretion ofthelaserbeampropagation.
Negletingthelasttermoftheaboveequation,that
or-responds to about10% of the total ds=dT, and using
n =1:546, dn=dT = 1:1410 4
K 1
, and = 0:38
[7℄,weanestimatethevalueof
T
ofourPVCsample
as:
T
=6:910 5
K 1
. Thisresultsagreeswiththat
from theliterature[7℄,whihis: (6:810 5
K 1
). For
polyarbonate,thesameproedurewasadoptedandwe
foundds=dT = 0:2110 4
K 1
:
IV.2 Glass transition analysis
Thesameproedure was adopted to arryout the
experimentsasafuntion ofthetemperature. Figures
4and5showtheresultingtemperaturedependenewe
obtainedforthethermaldiusivityandthenormalized
thermallenssignal,;ofthePVCsample,respetively.
35
40
45
50
55
60
65
70
0.6
0.7
0.8
0.9
1.0
1.1
1.2
1.3
1.4
T
her
m
a
l D
if
fu
siv
ity
(
10
-3
cm
2
/s
)
Temperature (
o
C )
25 30 35 40 45 50 55 60 65 70
1.0
1.5
2.0
2.5
3.0
3.5
4.0
θ
/ P
(
W
-1
)
Temperature (
o
C )
Figure5.ThermallenssignalamplitudeparameterofPVC
asafuntionofthetemperature.
To better understand thetemperaturedependene
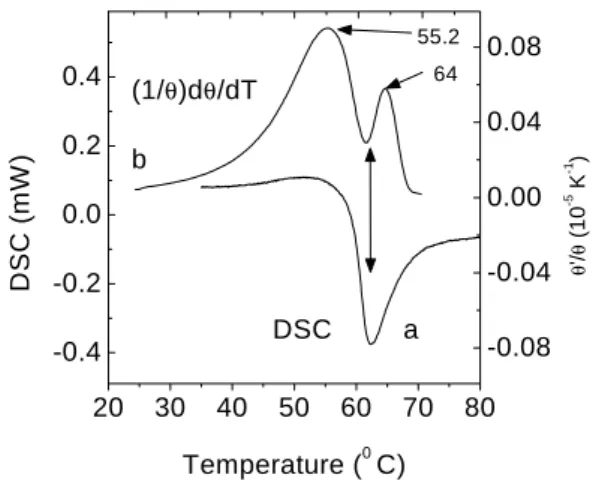
ofbothDand=P,wehavealsoarriedoutDSC
mea-surements. InFig. 6awepresentatypialDSC urve
for our sample. This result indiates that the glass
transition region of our PVCsample extendsfrom 50
Æ
Ctoabout67 Æ
Cwithapeakat62.5 Æ
C.FromFigs. 4
and5weobservethatbothD and=P showamarked
hange in their temperature dependene in this glass
transition region. Between 50 Æ
C to about 67 Æ
C, D
dereasesbyafatorofabout2at thesametimethat
=P experienesaninreaseoftheorderof3.5.
Thesomewhatomplextemperaturedependeneof
=P maybebetterunderstoodbylookingatthe
tem-perature derivative of the solid line in Fig. 5, shown
in Fig. 6b, whih was obtained by using a
ombina-tionofaLorentzianfuntionforthetemperaturerange
between22 Æ
C upto 60 Æ
Candalogistifuntion
(Y =A
2 +
(A
1 A
2 )
1+( x
x0 )
)
[4℄ for the temperatures above60 Æ
C. It tells us that,
oninreasingthetemperature,(1=)(d=dT)inreases,
goesthroughapeakaround56 Æ
C,thendereasesvery
sharplytoaminimumatroughly61 Æ
C,tonallyreah
a maximum at 64 Æ
C, as shown in the upper urve.
TheomparisonbetweenthetwoplotsinFig. 6issuh
thattherstpeakinurve(b),whihoursat56 Æ
C,
orrespondstothebeginningof theglass transitionas
determinedbytheDSCurve,whereastheseondpeak
of urve(b) orresponds to theinetion point of the
DSCurvebeforereahingitsminimumat62.5 Æ
C.We
-0.08
-0.04
0.00
0.04
0.08
20
30
40
50
60
70
80
-0.4
-0.2
0.0
0.2
0.4
(1/
θ
)d
θ
/dT
b
θ
'/
θ
(1
0
-5
K
-1
)
64
55.2
DSC a
DSC (
m
W
)
Temperature (
0
C)
Figure6. Temperaturederivative ofthe TLsignal(b) and
DSCdata(a) forPVCsample.
This result is indeed not as surprising as it may
lookat arstglane. InaDSC experimentone hasa
referenematerial,thesampletobeprobed,anda
pre-determinedheating(orooling)rateis imposed tothe
systemfor undergoingagiventemperatureexursion.
Aservo-systemmakesthesampletofollowthe
temper-atureoftherefereneandtheheatingpowerdierene
betweenthesampleandtherefereneisreorded. That
is,sinedT=dtisxed, onereordsessentiallydQ=dT.
In Fig. 7 we show the resulting temperature
de-pendene obtainedfor the thermaldiusivity and the
TLsignalparameter,=P,forthepolyarbonate
sam-ple, respetively. The DSC date is shown in urve
(). As performed for the PVC sample, in Fig. 8
we present the temperature derivative of =P. For
omparison, a plot of the temperature derivative of
the DSC data is also presented in Fig. 8, urve (b).
The existene of two minima in the DSC
tempera-turederivative data seemsto reetthe fat that the
polyarbonatesample has twodominant phases. One
phaseorresponding to aglass transition temperature
of about 143 Æ
C, and another one with T
g
of about
148 Æ
C. These two phases orrespond to pure
poly-arbonateandtoa
PCA/ABS(arylonitrile-butadiene-styrene) blend. This ABS blend is used to improve
the mehanial shok resistane of the polyarbonate
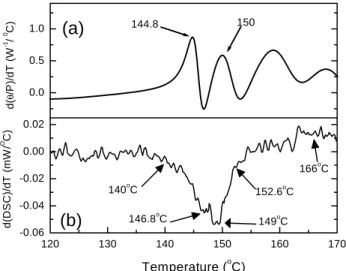
usedassafetyeyeglasses. In temperaturederivativeof
=P (Fig. 8a);in thetemperaturerange between140
Æ
C and 160 Æ
C, the peaks exhibit a distint
orrela-tionwith thoseof thetemperaturederivativeof DSC,
Fig. 8b. Themaxima ourat 144.8 Æ
C and 150 Æ
C,
orrespondingto the minimaof theDSC temperature
derivative. Thatis,thetemperaturedependeneof=P
0.6
0.8
1.0
1.2
2
4
6
8
10
12
14
120
130
140
150
160
170
-0.4
-0.3
-0.2
-0.1
0.0
147
148
149
-0.28
-0.24
-0.20
(a)
D (
1
0
-3
cm
2
/s
)
(b)
θ
/P
(W
-1
)
(c)
Temperature (
0
C)
P
o
wer (m
W
)
slope2=-0.0474
slope1=-0.0415
Figure7. a:Temperaturedependeneofthermaldiusivity
of the polyarbonate. The solidline representsthe
inter-polation shemefor thedata; b: Temperature dependene
ofthermallensamplitudeforpolyarbonate.Thesolidline
is the interpolation obtained from the experimental data;
: Typial DSC urve for polyarbonate showing a wide
glasstransitionfrom140 o
Cto155 o
C.Theinsetshowsthe
inetionpointat148 o
C.
120
130
140
150
160
170
-0.06
-0.04
-0.02
0.00
0.02
0.0
0.5
1.0
(b)
(a)
144.8
150
d(
θ
/P
)/dT
(W
-1
/
0
C)
166
o
C
152.6
o
C
140
o
C
146.8
o
C
149
o
C
d
(DSC)
/d
T
(
m
W
/
O
C)
Temperature (
o
C)
Figure8. a: Temperaturederivativeofthermallens signal
amplitudeobtainedfromtheinterpolatedurveofFig. 6b;
b): TemperaturederivativeoftheDSCdataobtainedfrom
Fig. 6a.
The above results for PVC and polyarbonate
in-diate that the similarity between the behavior of
1=(d=dT) and the DSC urve suggeststhat the TL
resulting signal of this tehnique would be d=dt =
(d=dT)(dT=dt), that is, proportional to d=dT, and
anprovideinformationregardingtheonsetoftheglass
transition.
V Thermal lens in lyotropi
liq-uid rystal
The similarity between lyotropi liquid rystal and
biologial membranes ombined with the well known
uniqueowphenomenapresentedbyliquidrystalline
materials have attrated the attention of many
re-searhersinthelastfewyears. Thestudyofthislassof
liquidrystalsareofonsiderableinterestduetothe
rel-ativelakofdetailed knowledgeoftheirphysial
prop-erties asompared to the thermotropiliquid rystals
andonsidering thepossibilityforexploring these
ma-terialsassensingdevieelements.
TheTL experimentshavebeenperformedforboth
orientation of the liquid rystal samples, i.e. paralell
andperpendiulartothediretoralignment. Itshould
benotedthat theTLtheoretialmodelwasdeveloped
foranisotropimedium, whilein theliquidrystal
ex-periments,espeiallyintheaseoftheplanargeometry,
the parameter hasan eetivevalue,dened as
ke .
Forhomeotropialignmentthere isaradialsymmetry
inthethermallensprole,whihmeansthatthevalues
ofthemeasuredparametersarerelatedtothe
perpen-diularorientationofthediretor. Herewedenoteas
? .
Figures 9a and 9b show the orresponding values
of
ke and
?
(normalized to the laser power) for the
pure LLC sample. For planar geometry the value of
ke
dereasesfromabout2at34 Æ
Cto 0.04at48.3 Æ
C
and beomesnegativebetween48.5 Æ
C and 49.3 Æ
C,
omingbaktoapositivevalueabove49.3 Æ
C.
It follows from Eq. (6) that this inversion of the
ke
signisaonsequeneofahangeofsignofdn=dT.
Wenotethatthisdefousing-self-fousinginversionwas
onlyobservedfortheplanargeometrynearthe
nemati-isotropi phasetransition. Weattribute thisinversion
totherateofhangeoftherefrativeindexwithrespet
to the temperature,namely, dn=dT. It is known that
dn=dT an be expressed as proportional to A[' ℄
[23,40,41℄,where'isthetemperatureoeÆientofthe
eletronipolarizability,isthethermalexpansion
o-eÆient,respetively,andAisaonstantthatdepends
on thesample refrativeindex. In thisrelation 'and
areounteratingfators aeting themagnitudeof
dn=dT. Inourresultsfortheplanargeometry,although
the polarizability is omprisedof twoontributionsof
dominantand probably ontrols the eetive valueof
theprobebeamphaseshift,
ke .
36
40
44
48
52
-6.00
-4.00
-2.00
0.00
2.00
4.00
N - phase
I - phase
I
N
θ
//e
/ P
e
(W
-1
)
Temperature (
0
C)
Figure 9a. Pure LC normalized probe beam phase shift
ke =Pe.
36
40
44
48
52
0.00
1.00
2.00
3.00
4.00
5.00
I
N
N - phase
I - phase
θ
⊥
/ P
e
(W
-1
)
Temperature (
0
C)
Figure 9b. Pure LC normalized probe beam phase shift
? =P
e .
Therefore, a possible mehanism driving the
ob-served inversion of dn=dT in the diretor orientation
is the inrease in the ' values in the long axis of
the mielles, resultingfrom theirhighereletroni
po-larizability near the nemati-isotropi phase
transi-tion asompared tothenemati and isotropiphases.
This agreeswith theobservationthat,in the
nemati-isotropi phase transition the eletroni polarizability
is greatlyenhanedin theaxisparallel tothe diretor
[6℄. The' value is assoiated to the eletroni
polar-2
dipoleharges,Z. Adereasein theratioZ =a 2
means
adereaseintheatomigroupssizeproduinga
onse-quent inreasein thevalue ofthese polarizinggroups.
This, in turn, suggests that the observed inversionin
dn=dT resultsfromahangeinthemiellesshape,
de-reasingthedistanebetweenthedipoleharges. This
explanationisonsistentwith publishedX-ray
dira-tionmeasurements,showingthemiellesshapehange
near thedisoti nemati-isotropi phasetransition in
lyotropiliquidrystal[42℄.
Forthehomeotropiongurationthe
?
values
in-reasewithinreasingtemperaturepresentingapeakat
50 Æ
C, Fig. 9b. In thissample alignment thethermal
expansionoeÆient,;dominatestheobservedhange
in dn=dT,whih is negativein the whole temperature
rangeinvestigatedinthis work.
WenoteinFig.9a,thatthetemperatureofthepeak
of
ke
for theplanaralignmentissmallerthan that of
thepeakinFig.9bforthehomeotropigeometry. This
dierenemaybeattributed to thefat that the
ele-troni polarizability inreases fast in the beginning of
the transition overoming the possible hanges in the
thermalexpansionvalues. Afterreahingthepeak,the
valuesof
ke
entersin agrowingregionuntilreahing
the isotropi phase, indiating that in this
tempera-turerange the thermal expansionoeÆient inreases
anddominatesdn=dT. Forthehomeotropigeometry,
asmentionedbefore,thethermalexpansionoeÆient
dominatesdn=dT inthewhole temperature rangeand
beomesmaximumjustbeforetheisotropiphase.
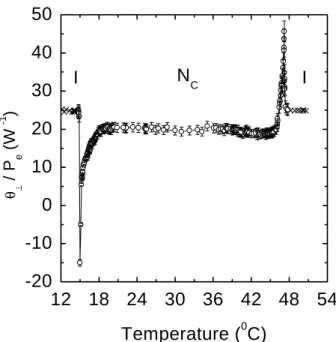
In Figures 10a and 10b we show the temperature
dependene ofthenormalizedTLsignal,;forthe
fer-rouid doped sample. In this ase the hosen
tem-perature range inluded the isotropi-nemati
transi-tionwhihtookplaearound14 Æ
C. Forthe
nemati-isotropitransitionthebehaviorof=P wassimilar to
thatourredforthepuresample. However,the
inver-sion in the =P valuesfor the isotropi-nemati
tran-sitionourred for the diretor perpendiular
orienta-tion,indiatingthat thehangesin themiellarshape
isoppositeasthat fornemati-isotropitransition.
VI Conlusion and future work
Inonlusion,in thispaperwedisusstheuseof
ther-mal lens tehnique to determine the thermo-optial
properties of omplex uids as afuntion of the
tem-perature. It is also disussed how the experimentally
determinedTL parametersanbeusedtoloatingthe
phasetransition ofthese materials. Theresultshowed
theabilityofthethermallenstehniquetoperformthe
measurements very lose to the phase transition. As
afuture work,weproposethat thetehniqueouldbe
adapted to developa new method, alled dierential
in-12
18
24
30
36
42
48
54
-20
-10
0
10
20
30
40
I
N
I
C
θ
⊥
/ P
e
(W
-1
)
Temperature (
0
C)
Figure 10a. Ferrouid dopedLC normalized probe beam
phaseshift
ke =Pe.
12
18
24
30
36
42
48
54
-200
-100
0
100
200
300
400
I
N
C
I
θ
||
/ P
e
(W
-1
)
Temperature (
0
C)
Figure 10b. Ferrouiddoped LCnormalized probe beam
phaseshift?=Pe:
Aknowledgements
Wearethankfulto theBrazilian ageniesCAPES,
CNPq and Funda~ao Arauaria for the nanial
sup-portofthiswork.
Referenes
[1℄ M.Marinelli,F.Meruri,U.Zammit,andF.Sudieri,
Phys.Rev.E53,701(1996).
[2℄ F.Meruri,M.Marinelli,U.Zammit,andF.Sudieri,
[4℄ J.H. Rohling, A.N. Medina, A.C. Bento, J.R.D.
Pereira, A.F. Rubira, M.L. Baesso, and L.C.M.
Mi-randa,J.Appl.Phys.89,2220(2001).
[5℄ J.H. Rohling,A.N. Medina, J.R.D. Pereira, A.F.
Ru-bira, A.C.Bento, L.C.M. Miranda, andM.L. Baesso,
AnalytialSienes17,s103(2001).
[6℄ G. Vertogen and W. H. de Jeu,Thermotropi Liquid
Crystal,(SpringerVerlag,Berlin,1988).
[7℄ J. Bandrup and E.H. Immerght, Polymer Handbook,
3rded.,pp.V/1ed.(Wiley,NewYork,1989).
[8℄ M.L.Baesso,J.R.D.Pereira,A.C.Bento,A.J.
Palan-gana, A.M.Mansanares,andL. R.Evangelista,Braz.
J.Physis28,359(1998).
[9℄ J.R.D. Pereira, A.J. Palangana, A.M. Mansanares,
E.C.daSilva,A.C.Bento,andM.L.Baesso,Phys.Rev.
E,61,5410 (2000).
[10℄ J.R.D. Pereira, A.M. Mansanares, A.J. Palangana,
M.L. Baesso, A.A. Barbosa, and P.R.G. Fernandes,
Phys.Rev.E,64,062701(2001).
[11℄ J.R.D.Pereira,A.M.Mansanares,A.J.Palangana,and
M.L.Baesso,Phys.Rev.E,6410,012701(2001).
[12℄ G. Hohne, W. Hemminger, and H.-J. Flammershein,
in: Dierenial SanningCalorimetry: A Introdution
forPrationers.(SpringerVerlag,1996).
[13℄ J.H. Rohling, A.N. Medina, A.C. Bento, J.R.D.
Pereira,M.L.Baesso,L.C.M.Miranda,S.M.Lima,and
T.Catunda,AnalytialSienes17,s106(2001).
[14℄ J.R.D. Pereira, A.J. Palangana, A.M. Mansanares,
E.C.daSilva,A.C.Bento,andM.L.Baesso,Analytial
Sienes,17,s175(2001).
[15℄ A. Rosenwaig, Photoaoustis and Photoaousti
Spetrosopy(Wiley,NewYork,1980).
[16℄ H. Vargas and L.C.M. Miranda, Phys. Rep. 161, 43
(1988).
[17℄ A. Lahaineand P.Poulet,Appl. Phys.Lett. 45,953
(1984).
[18℄ A.C. Bento, A.J. Palangana, L.R. Evangelista, M.L.
Baesso, J.R.D. Pereira, E.C. da Silva, and A.M.
Mansanares,Appl.Phys.Lett.68,3371(1996).
[19℄ J.R.D.Pareira,A.M.Mansanares,A.J.Palangana,and
M.L. Baesso, Mol. Cryst. Liq. Cryst. A, 332, 3079
(1999).
[20℄ W.L.F.dosSantos,M.F.Porto,E.C.Muniz,L.Olenka,
M.L. Baesso, A.C. Bento, and A.F. Rubira, J. Appl.
PolymerSiene,77,289(2000).
[21℄ L.Olenka,E.N.Nogueira,W.L.F.dosSantos,E.C.
Mu-niz,A.F.Rubira,A.N.Medina,L.P.Cardoso,L.C.
Mi-randa,M.L.Baesso,andA.C.Bento,J.Phys.D:Appl.
Phys.34,2248 (2001).
[23℄ M.L.Baesso,J.Shen,andR.D.Snook.J.Appl.Phys.
75,3732(1994).
[24℄ M.L.Baesso,A.C.Bento,A.R.Duarte,A.M.Neto,and
L.C.M. Miranda,J.Appl.Phys.85,8112(1999).
[25℄ M. L.Baesso,J.Shen,andR.D.Snook,Chem.Phys.
Lett.197,255(1992).
[26℄ M.L.Baesso,A.C.Bento,A.A. Andrade,T.Catunda,
J.A.Sampaio,andS.Gama,J.Non-Cryst.Solids219,
165(1997).
[27℄ M.L.Baesso,A.C.Bento,A.A.Andrade,J.A.
Sam-paio,E.Peoraro, L.A.O.Nunes,T.Catunda,andS.
Gama,Phys.Rev.B57,10545(1998).
[28℄ S.M.Lima,T.Catunda,R.Lebullenger,A.C.
Hernan-des, M.L. Baesso, A.C. Bento, and L.C.M. Miranda,
Phys.Rev.B60,15173(1999).
[29℄ A.A.Andrade,T.Catunda,R.Lebullenger,A.C.
Her-nandes, and M.L.Baesso, J.Opt. So.of Am.B 16,
395(1999).
[30℄ A.A.Andrade,T.Catunda,R.Lebullenger,A.C.
Her-nandes,andM.L.Baesso,Elet.Lett.34,117(1998).
[31℄ S.M. Lima, T. Catunda, M.L. Baesso, L.D. Vila, Y.
Messadeq, E.B. Stuhi, and S.J.L. Ribeiro, J.
Non-Cryst.Solids247,222(1999).
[32℄ S.M.Lima,J.A.Sampaio,T.Catunda,R.Lebullenger,
A.C.Hernandes,M.L.Baesso,A.C.Bento,andF.C.G.
Gandra,J.Non-Cryst.Solids 257,337(1999).
[33℄ S.M.Lima,A.A.Andrade,T.Catunda,R.Lebullenger,
A.C.Hernandes, and M.L. Baesso, Appl. Phys.Lett.
78,3220(2001).
[34℄ R.D. Snook, R.D. Lowe, andM. L. Baesso, Analyst
23,587(1998).
[35℄ M.FrankoandC.D.Tran,Rev.Si.Instrum.62,2438
(1991).
[36℄ M.S.BaptistaandC.D.Tran,J.Phys.Chem.B 101,
4209(1997).
[37℄ M.S. Baptista and C.D. Tran, J. Phys. Chem. 99,
12952(1995).
[38℄ J.Shen, R. D. Lowe, and R. D. Snook, Chem. Phys.
165,385(1992).
[39℄ J.Shen,M.L.Baesso,andR.D.Snook,J.Appl.Phys.
75,3738(1994).
[40℄ M.Sparks,J.Appl.Phys.42,5029 (1971).
[41℄ L. Prod'homme, Phys. and Chem. of Glasses 1, 119
(1961).
[42℄ Y. Galerne, A. M. Figueiredo Neto, and L. Liebent,